Schofield Residence Nursing Facility
Nursing Home, Adult Day Care, Home Care, Hospice Care, Palliative Care & Skilled Nursing · Buffalo, NY
CMS overall rating Info CMS (the Centers for Medicare & Medicaid Services) is the federal agency that rates nursing home quality. Its Overall Rating runs from 1 to 5 stars, combining health inspections, staffing, and quality measures, with inspections weighted most heavily.

Schofield Residence Nursing Facility

Nursing Home, Adult Day Care, Home Care, Hospice Care, Palliative Care & Skilled Nursing · Buffalo, NY
CMS overall rating Info CMS (the Centers for Medicare & Medicaid Services) is the federal agency that rates nursing home quality. Its Overall Rating runs from 1 to 5 stars, combining health inspections, staffing, and quality measures, with inspections weighted most heavily.
Calculator: See prices in your area
Schofield Residence Nursing Facility accepts Medicare, Medicaid, and private pay.

Overview of Schofield Residence Nursing Facility

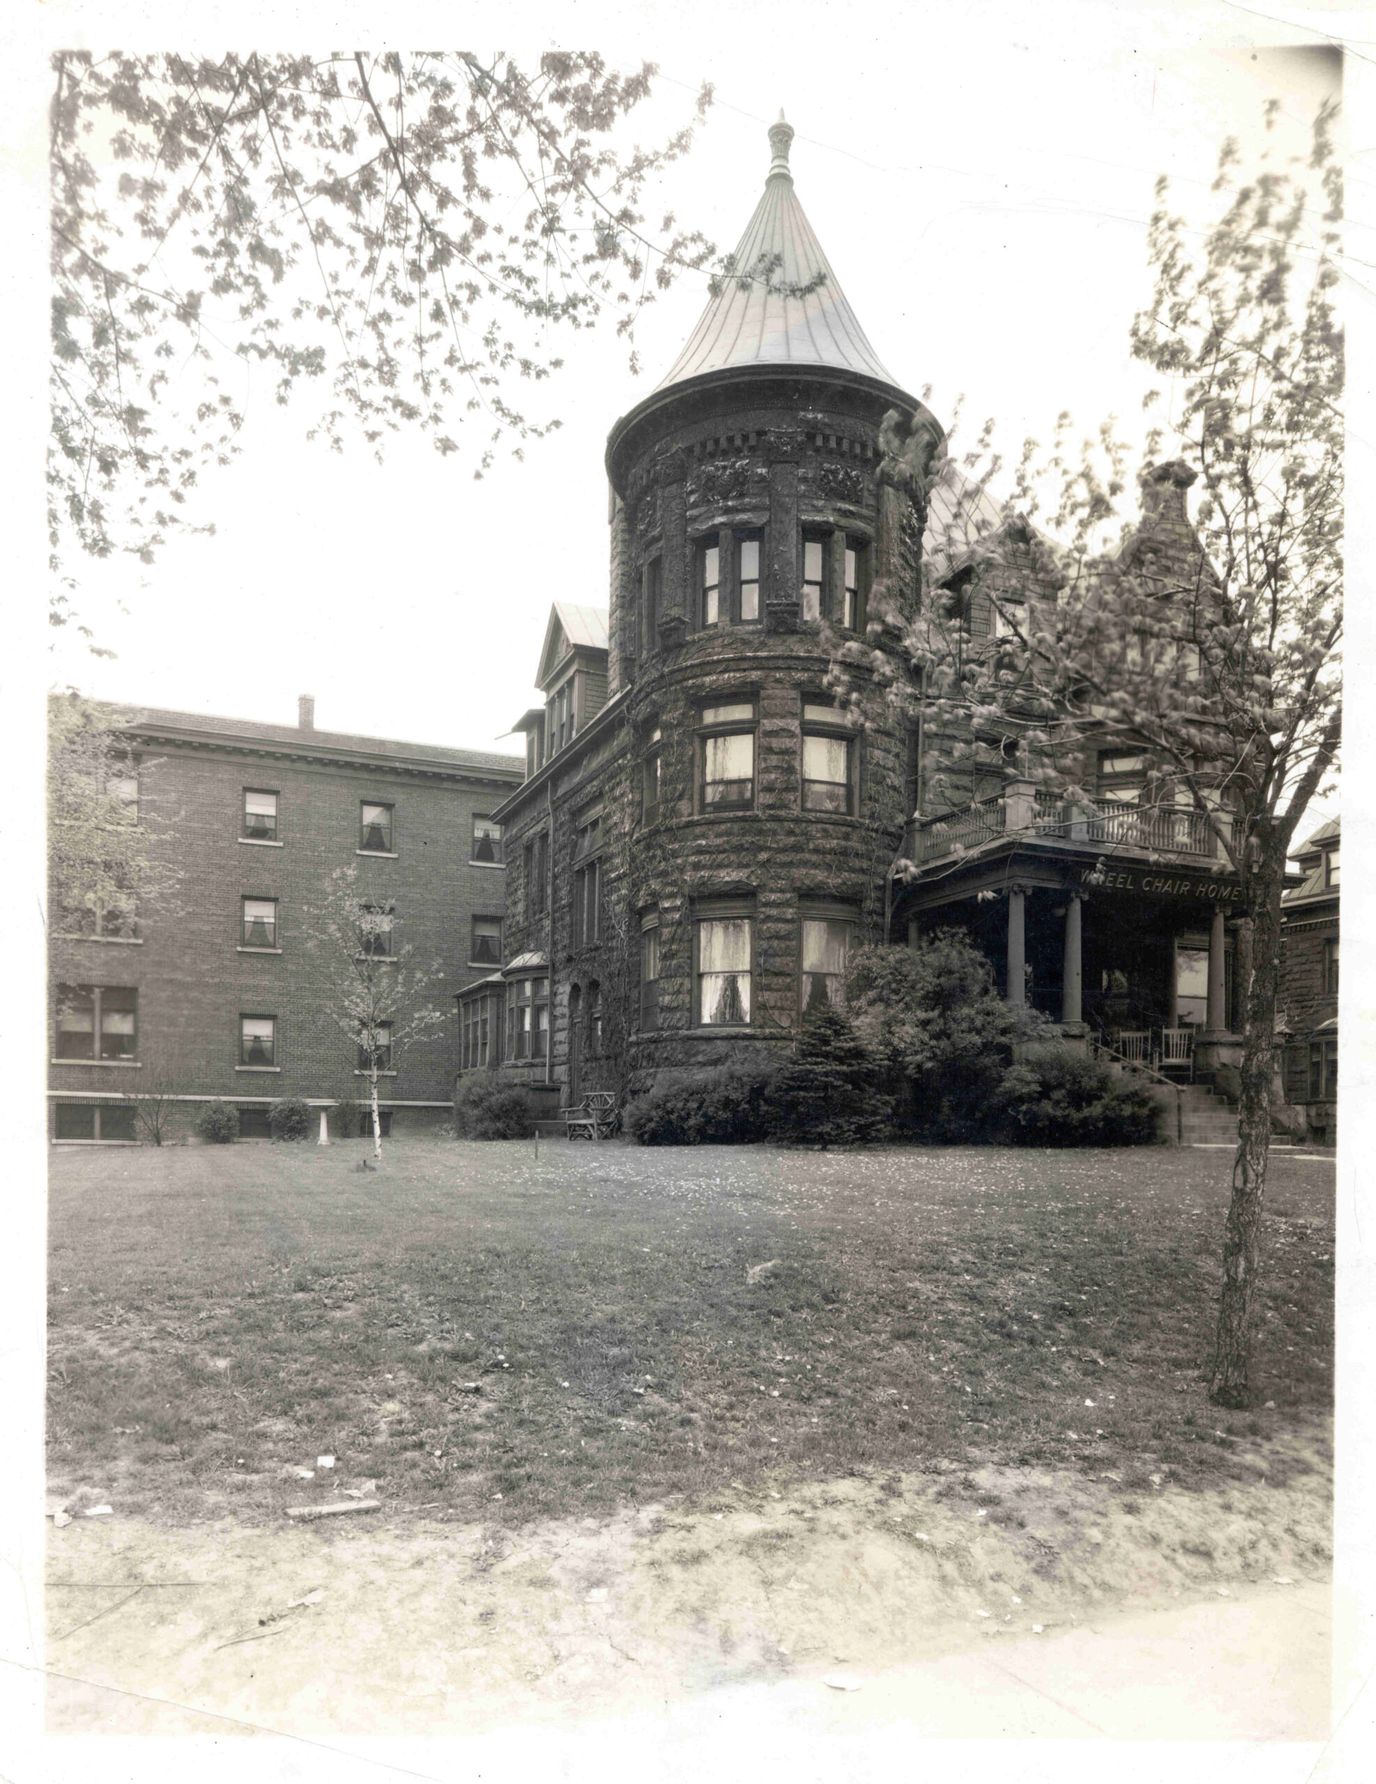
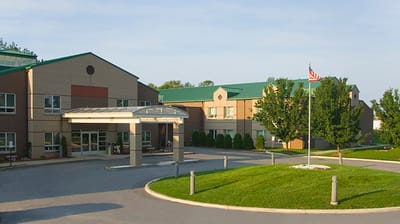
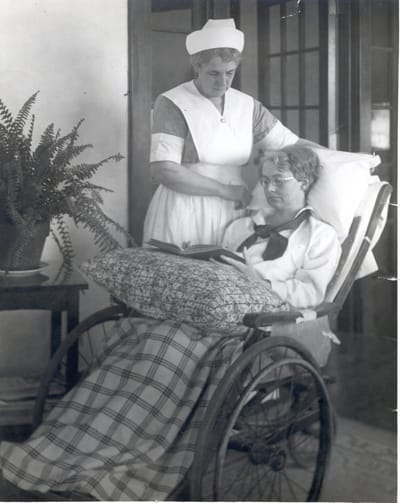
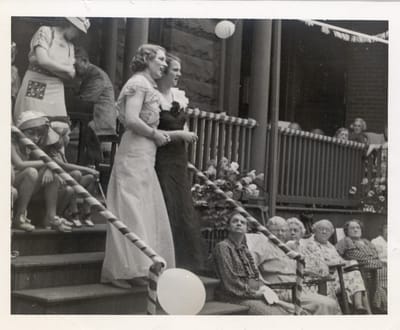
Catering to Erie and Niagara counties in New York State, Schofield Residence Nursing Facility is an esteemed independent and not-for-profit senior community. This exceptional assisted living community is a beacon of quality care, encompassing short-term rehabilitation, home care, adult day health care, and skilled nursing services. With its roots tracing back to 1910, Schofield remains committed to delivering care precisely when and where it’s needed.

Nestled in the serene residential neighborhood of Kenmore, New York, Schofield Residence accommodates 120 residents in a welcoming environment. Complementing its remarkable offerings, the Home Health teams extend a wide array of comprehensive services, including private duty aides, occupational and physical therapy, and nursing assistance.

Quality ratings

Measured by Centers for Medicare & Medicaid Services (CMS)

Overall rating Info The Overall CMS Rating combines results from health inspections, staffing levels and quality measures. Health inspections carry the most weight. Staffing and quality scores can increase or decrease the final rating based on performance compared to state and national standards.
▲ 30.2% Above NY avg. ▲ 30.2% Above NY avg.NY average: 3.1Click the badge to see the full State ranking.Click here to see the full State ranking.
Health Inspection Info Based on the results of the facility's three most recent standard inspections and any complaint investigations. CMS reviews the number, scope, and severity of deficiencies, with more recent findings weighted more heavily.
▲ 41.3% Above NY avg. ▲ 41.3% Above NY avg.NY average: 2.8Click the badge to see the full State ranking.Click here to see the full State ranking.
Staffing Info Measures average nursing staff hours per resident per day, including Registered Nurses (RNs) and total nursing staff. Ratings are adjusted based on the level of care residents require and are compared to state and national benchmarks.
▼ 26.4% Below NY avg. ▼ 26.4% Below NY avg.NY average: 2.7Click the badge to see the full State ranking.Click here to see the full State ranking.
Quality Measures Info Based on clinical and physical health indicators reported to CMS, such as hospital readmissions, falls, pressure ulcers, and improvements in mobility. These measures reflect how well residents' health needs are being managed.
▲ 4.8% Above NY avg. ▲ 4.8% Above NY avg.NY average: 3.8Click the badge to see the full State ranking.Click here to see the full State ranking.

Staffing hours breakdown

Info Daily nursing hours per resident by staff type, reported to CMS. Higher is generally better — compare this facility to state and national averages to see where staffing stands.

Hours per resident per day — compared to New York state averages

Total nursing care / resident Info This home is ranked 73rd out of 407 homes in New York for nurse hours. Total adjusted nursing hours per resident per day, combining RN, LPN, and aide time. CMS adjusts this for case-mix so facilities can be fairly compared.
4h 6m per day
Rank #73 / 407Nurse hours — State benchmarkedThis home is ranked 73rd out of 407 homes in New York. Shows adjusted nurse hours per resident per day benchmarked to the New York average, with a ranking across 407 New York facilities. More hours mean more direct care. The national average is about 3.5 hrs; below 3.0 is a red flag.Rankings are based only on facilities in New York that report data for that category. Facilities without available data are excluded from the ranking.Click the rank badge to see the full State ranking.Click here to see the full State ranking.
This facility New York avg (3h 35m per day)
vs New York avg
+14%

2 of 6 metrics below state avg

Standout metric LPN / LVN is +49% above state avg
Staff typeHours / Day / Residentvs state avg
Registered Nurse (RN) Info RNs hold the highest nursing license and can assess residents, interpret test results, and direct care plans. More RN hours per day often signals stronger clinical oversight and faster response to health changes. 21m per day ▼ 50% State avg: 42m per day · National avg: 41m per day
LPN / LVN Info Licensed Practical Nurses (LPNs) or Licensed Vocational Nurses (LVNs) deliver routine hands-on care — medication administration, wound dressing, and monitoring vital signs. They work under RN supervision and make up a large share of daily bedside care. 1h 9m per day ▲ 49% State avg: 46m per day · National avg: 52m per day
Nurse Aide Info Certified Nurse Aides (CNAs) provide the most direct day-to-day assistance: bathing, dressing, feeding, and mobility. Nurse aide hours are typically the largest staffing category and directly affect residents' quality of life. 2h 43m per day ▲ 25% State avg: 2h 11m per day · National avg: 2h 21m per day
Weekend Total Nursing Info Combined nursing hours (RN + LPN + Nurse Aide) per resident per day on weekends. Staffing often drops on weekends — this figure reveals whether the facility maintains adequate coverage outside of weekday hours. 3h 31m per day ▲ 11% State avg: 3h 10m per day · National avg: 3h 26m per day
Physical Therapist Info Hours per resident per day provided by licensed Physical Therapists (PTs) or PT Assistants. PT services help residents recover mobility after injury or illness and are especially important for post-acute (short-stay) rehabilitation. 8m per day ▲ 7% State avg: 7m per day · National avg: 4m per day
Weekend RN Info Registered nurse hours specifically on weekends. Facilities sometimes reduce RN presence on Saturdays and Sundays — a low weekend RN figure compared to weekday hours can indicate reduced clinical oversight when most administrative staff are absent. 9m per day ▼ 67% State avg: 28m per day · National avg: 29m per day

Capacity and availability

This home is often near full

Higher occupancy than the New York average: 88.3%
Occupancy rate
99.9% Rank #10 / 436Occupancy rate — State benchmarkedThis home is ranked 10th out of 436 homes in New York. Shows this facility's occupancy rate versus the New York average, with its Statewide rank out of 436. Higher occupancy signals strong local demand and financial stability.Rankings are based only on facilities in New York that report data for that category. Facilities without available data are excluded from the ranking.Click the rank badge to see the full State ranking.Click here to see the full State ranking.
Avg. Length of Stay Info Average number of days residents stay at this facility, based on CMS cost report data. Shorter stays often reflect post-acute or rehab care; longer stays reflect long-term care.
74 days
Bed community size
120-bed community Rank #412 / 748Bed count — State benchmarkedThis home is ranked 412th out of 748 homes in New York. Shows this facility's certified or reported bed count compared to other New York facilities. Larger communities may offer more amenities, programs, and on-site services for residents and families.Rankings are based only on facilities in New York that report data for that category. Facilities without available data are excluded from the ranking.Click the rank badge to see the full State ranking.Click here to see the full State ranking.
A larger shared setting that may offer more common spaces and organized community services.
Walk Score
Walk Score: 60 / 100 Rank #696 / 1173Walk Score — State benchmarkedThis home is ranked 696th out of 1173 homes in New York. Shows how walkable this facility's neighborhood is compared to the average Walk Score across New York facilities. Higher scores benefit residents, families, and staff.Rankings are based only on facilities in New York that report data for that category. Facilities without available data are excluded from the ranking.Click the rank badge to see the full State ranking.Click here to see the full State ranking.
Moderately walkable. Some errands can be accomplished on foot, with a mix of nearby amenities.

About this community

Awards

5-STAR Rating from Medicare.gov

Payment & Insurance

1 service
Accept Medicaid

Therapy & Rehabilitation

2 services
Rehabilitation Services
Short-Term Rehab

Staffing & Medical

2 services
Doctor on Staff
24-Hour Staffing

Additional Services

1 service
Home Care

Additional Policies & Features

Admission CriteriaHospice-eligible residents needing 24-hour nursing care.

Amenities & Lifestyle

Wellness ProgramNew Mondello Wellness & Family Center
Branded ProgramsSerenity at Schofield
Specific ProgramsAdult Day Health Care, Nursing Home Care, Hospice & Palliative Care, Traumatic Brain Injury, Veteran Care
Religious Services
Volunteer Program

Contact Schofield Residence Nursing Facility

Staffing Data

Reporting period: October 1 – December 31, 2025 (Q4 2025). Source: CMS Payroll-Based Journal report.

Total staff 205
Employees 138
Contractors 67
Staff to resident ratio 1.95 : 1
1014% more staff per resident than New York average
New York average ratio: 0.18 : 1 New York average ratio: 0.18 : 1See full New York ranking
Avg staff/day 62
Average shift 8.1 hours
5% better than New York average
New York average: 7.7 hours New York average shift: 7.7 hoursSee full New York ranking
Total staff hours (quarter) 46,352

Nursing staff breakdown

Q4 2025 · Oct 1 – Dec 31 More info This data comes from the CMS Payroll-Based Journal report covering October 1 – December 31, 2025.
Registered Nurse

Manages medical care and health needs.

RN Staff Info All 8 RN Staff are full-time employees. No contractors work on this role. 8
Average shift length Info Average shift length. Calculated as total hours divided by days worked and average staff per day. 8 hours
Licensed Practical Nurse

Assists with medical care and medications.

LPN Staff Info 49 total: 18 full-time employees and 31 contractors. 49
Average shift length Info Average shift length. Calculated as total hours divided by days worked and average staff per day. 8.2 hours
Certified Nursing Assistant

Helps with daily care and mobility.

CNA Staff Info 96 total: 60 full-time employees and 36 contractors. 96
Average shift length Info Average shift length. Calculated as total hours divided by days worked and average staff per day. 8.6 hours

Contractor staffing

Q4 2025 · Oct 1 – Dec 31 More info This data comes from the CMS Payroll-Based Journal report covering October 1 – December 31, 2025.

Total hours from contractors

8.5%

3,960 contractor hours this quarter

Certified Nursing Assistant: 36 Licensed Practical Nurse: 31

Staff by category

Q4 2025 · Oct 1 – Dec 31 More info This data comes from the CMS Payroll-Based Journal report covering October 1 – December 31, 2025.
Certified Nursing Assistant60369623,81692100%8.6
Licensed Practical Nurse1831499,69192100%8.2
Nurse Aide in Training120121,8044347%7.2
Registered Nurse8081,6509098%8
Physical Therapy Assistant8081,4397986%6.9
Other Dietary Services Staff4041,32092100%7.4
Clinical Nurse Specialist4041,2098592%7.7
Respiratory Therapy Technician7071,1777986%7.1
RN Director of Nursing5051,1007076%7.7
Dental Services Staff1014946065%8.2
Speech Language Pathologist2024586065%7.5
Administrator1014506065%7.5
Nurse Practitioner2024355863%7.5
Mental Health Service Worker1014205661%7.5
Physical Therapy Aide1014165459%7.7
Dietitian1012933942%7.5
Occupational Therapy Aide2021477582%1.7
Qualified Social Worker1013655%7.1
96 Certified Nursing Assistant
% of Days 100%
49 Licensed Practical Nurse
% of Days 100%
12 Nurse Aide in Training
% of Days 47%
8 Registered Nurse
% of Days 98%
8 Physical Therapy Assistant
% of Days 86%
4 Other Dietary Services Staff
% of Days 100%
4 Clinical Nurse Specialist
% of Days 92%
7 Respiratory Therapy Technician
% of Days 86%
5 RN Director of Nursing
% of Days 76%
1 Dental Services Staff
% of Days 65%
2 Speech Language Pathologist
% of Days 65%
1 Administrator
% of Days 65%
2 Nurse Practitioner
% of Days 63%
1 Mental Health Service Worker
% of Days 61%
1 Physical Therapy Aide
% of Days 59%
1 Dietitian
% of Days 42%
2 Occupational Therapy Aide
% of Days 82%
1 Qualified Social Worker
% of Days 5%

Penalties and fines

Federal penalties imposed by CMS for regulatory violations, including civil money penalties (fines) and denials of payment for new Medicare/Medicaid admissions.

Source: CMS Penalties Database

No penalties in the past 3 years

No civil money penalties or payment denials were reported in the last 3 years.

Quality of care over time

These measures show how residents usually do over time at this home, based on health outcomes and preventive care.

High-risk clinical events score Info A composite score based on pressure ulcers, falls with injury, weight loss, walking ability decline, and activities of daily living decline. 17.2
76% worse than New York average

New York average: 9.8

Functional decline score Info A composite score based on activities of daily living decline, walking ability decline, and incontinence. 33.9
87% worse than New York average

New York average: 18.1

Long-stay resident measures
Above average Info CMS star rating based on long-stay quality measure performance. 5 stars = significantly above average, 1 star = significantly below average.
Need for Help with Daily Activities Increased Info Percent of long-stay residents whose need for help with daily activities has increased 24.3%
48% worse than New York average

New York average: 16.4%

Walking Ability Worsened Info Percent of long-stay residents whose ability to move independently worsened 46.7%
182% worse than New York average

New York average: 16.6%

Low Risk Residents with Bowel/Bladder Incontinence Info Percent of low risk long-stay residents who lose control of their bowels or bladder 30.7%
44% worse than New York average

New York average: 21.4%

Falls with Major Injury Info Percent of long-stay residents experiencing one or more falls with major injury 2.1%
31% better than New York average

New York average: 3.0%

High Risk Residents with Pressure Ulcers Info Percent of long-stay high risk residents with pressure ulcers 8.0%
12% worse than New York average

New York average: 7.2%

Urinary Tract Infection Info Percent of long-stay residents with a urinary tract infection 0.9%
35% better than New York average

New York average: 1.4%

Lost Too Much Weight Info Percent of long-stay residents who lose too much weight 5.1%
16% better than New York average

New York average: 6.1%

Depressive Symptoms Info Percent of long-stay residents who have depressive symptoms 1.9%
90% better than New York average

New York average: 18.1%

Antipsychotic Use Info Percent of long-stay residents who received an antipsychotic medication 10.9%
13% better than New York average

New York average: 12.6%

Pneumococcal Vaccine Info Percent of long-stay residents assessed and appropriately given the pneumococcal vaccine 99.4%
9% better than New York average

New York average: 91.4%

Influenza Vaccine Info Percent of long-stay residents assessed and appropriately given the seasonal influenza vaccine 100.0%
5% better than New York average

New York average: 95.2%

Short-stay resident measures
Above average Info CMS star rating based on short-stay quality measure performance. 5 stars = much above average, 1 star = much below average.
Pneumococcal Vaccine Info Percent of short-stay residents assessed and appropriately given the pneumococcal vaccine 96.3%
26% better than New York average

New York average: 76.6%

Antipsychotic medication increase Info Percent of short-stay residents who newly received an antipsychotic medication 0.2%
82% better than New York average

New York average: 1.3%

Influenza Vaccine Info Percent of short-stay residents assessed and appropriately given the seasonal influenza vaccine 94.5%
20% better than New York average

New York average: 78.8%

Re-hospitalized after SNF stay Info Percentage of short-stay residents who were re-hospitalized after their nursing home admission. 33.0%
60% worse than New York average

New York average: 20.6%

Emergency department visits Info Percentage of short-stay residents who had an outpatient emergency department visit. 6.8%
30% better than New York average

New York average: 9.7%

Falls with major injury Info Percentage of SNF residents who experience falls with major injury during their stay. 0.0%
100% better than New York average

New York average: 0.8%

Ability to care for self at discharge Info Percentage of residents at or above expected ability to care for themselves at discharge. 66.7%
24% better than New York average

New York average: 53.7%

Successful return to home or community Info Rate of successful return to home or community from a skilled nursing facility. 48.3%
In line with New York average

New York average: 50.6%

Breakdown by payment type

Medicare

20% of new residents, usually for short-term rehab.

Typical stay 1 months

Private pay

75% of new residents, often for short stays.

Typical stay 1 - 2 months

Medicaid

5% of new residents, often for long-term daily care.

Typical stay 2 years

Facility Characteristics

Source: CMS Long-Term Care Facility Characteristics (Data as of Jan 2026)

Total residents 105
Medicare
18
17.1% of residents
Medicaid
73
69.5% of residents
Private pay or other
14
13.3% of residents
Programs & Services
Residents Group

Residents meet regularly to discuss policies, care quality, and activities

Nurse Aide Training

State-approved Nurse Aide Training and Competency Evaluation Program on-site

Active Resident Council

Organized group of residents that meets regularly to discuss facility policies, quality of life, and activities.

Finances and operations

Based on CMS SNF Cost Report for fiscal year ending in 12/2023.

Nonprofit
Nonprofit Corporation
Net patient revenue Info Net patient revenue — what the home actually collects for resident care, after contractual allowances, bad debt and discounts are subtracted from its gross charges (CMS cost report, Worksheet G-3). It covers resident care only; money the home earns from other sources is shown separately as "Other income."
$15.6M
Net patient income Info Net patient income: net patient revenue minus the home's total operating expenses. A positive figure means it earns more from resident care than it spends to deliver it; a negative figure means the opposite. It excludes non-operating "other income."
-$2.1M
Nonprofit Nonprofit Corporation
Net patient revenue Info Net patient revenue — what the home actually collects for resident care, after contractual allowances, bad debt and discounts are subtracted from its gross charges (CMS cost report, Worksheet G-3). It covers resident care only; money the home earns from other sources is shown separately as "Other income."
$15.6M Rank #238 / 403Revenue — State benchmarkedThis home is ranked 238th out of 403 homes in New York. Shows this facility's annual revenue compared to the New York average. Higher revenue generally means more resources for staffing and capital — read alongside Payroll %.Rankings are based only on facilities in New York that report data for that category. Facilities without available data are excluded from the ranking.Click the rank badge to see the full State ranking.Click here to see the full State ranking.
Net patient income Info Net patient income: net patient revenue minus the home's total operating expenses. A positive figure means it earns more from resident care than it spends to deliver it; a negative figure means the opposite. It excludes non-operating "other income."
-$2.1M
Other income Info Money the home earns outside of resident care — such as investments, grants, rentals and other non-operating sources (CMS cost report, Worksheet G-3). It is tracked separately from net patient revenue: it is not part of that figure, and it is not included in net patient income.
$1.0M
Payroll costs Info Staff salaries plus wage-related costs — benefits such as payroll taxes, health insurance and retirement — from the home's own accounting records (CMS cost report, Worksheet A). Contract or agency labor is counted separately, under other operating costs. Rank #256 / 403Payroll — State benchmarkedThis home is ranked 256th out of 403 homes in New York. Shows total annual staff payroll benchmarked to the New York average. Higher payroll investment relative to peers often signals better staffing and less reliance on cheaper contract labor.Rankings are based only on facilities in New York that report data for that category. Facilities without available data are excluded from the ranking.Click the rank badge to see the full State ranking.Click here to see the full State ranking.
$8.9M 57.3% of net patient revenue Info Payroll as a share of revenue: staff salaries and wage-related benefits divided by net patient revenue. A higher figure means more of each revenue dollar goes to staff pay. Rank #279 / 403Payroll % — State benchmarkedThis home is ranked 279th out of 403 homes in New York. Shows payroll as a percentage of revenue versus the New York average. Well-run New York facilities typically land around 53–65% — the top third Statewide. Below 25% may signal understaffing or heavy agency use — read with Staffing ratings.Rankings are based only on facilities in New York that report data for that category. Facilities without available data are excluded from the ranking.Click the rank badge to see the full State ranking.Click here to see the full State ranking.
Other operating costs Info Everything it costs to run the home apart from payroll — food, utilities, supplies, maintenance, contract labor and administration. Calculated as total operating expense minus payroll (staff salaries and wage-related benefits).
$8.8M
Total costs Info The home's total operating expense for the year — all the costs of running it, salaries included (CMS cost report, Worksheet G-3).
$17.7M

Who this home usually serves

TYPE OF STAY

Primarily short stays

Residents typically stay for brief periods, with frequent admissions and discharges throughout the year.

Most new residents arrive under private pay (75% of admissions), and a typical private pay stay runs around 1 - 2 months.

Admissions
530 total

Coverage residents most often arrive under.

Medicare 20%
Private pay 75%
Medicaid 5%
Discharges
511 total

Coverage residents most often leave under.

Medicare 17%
Private pay 67%
Medicaid 15%

Places of interest near Schofield Residence Nursing Facility

Address 7.0 miles from city center Info Estimated distance in miles from Buffalo's city center to Schofield Residence Nursing Facility's address, calculated via Google Maps.

Calculate Travel Distance to Schofield Residence Nursing Facility

Add your location

Address

Compare Nursing Homes around Buffalo

The information below is reported by the New York State Department of Health.

3 facilities compared · CMS & NY Dept. of Health data

Schofield Residence Nursing Facility
NH
ADC
HC
HOS
PC
SNF
Buffalo (Elmwood North)
120
Facility 120
NY AVG 160
Rank #412 / 748
99.9%
Facility 99.9%
NY AVG 88.3%
Rank #10 / 436
+13%
4.10
Facility 4.10
NY AVG 3.58
Rank #73 / 407
-69%+14%
$0
Facility $0
NY AVG $67.6k
Rank #1 / 415
-
15
Facility 15
NY AVG 18.5
Rank #170 / 414
3.8
Facility 3.8
NY AVG 5.1
Rank #120 / 414
-102-
60
Facility 60
NY AVG 63
Rank #696 / 1173
James Cambell
$15.6MFiscal year ending 12/2023
Facility $15.6MFiscal year ending 12/2023
NY AVG $32.0M
Rank #238 / 403
$8.9MFiscal year ending 12/2023
Facility $8.9MFiscal year ending 12/2023
NY AVG $10.7M
Rank #256 / 403
57.3%Fiscal year ending 12/2023
Facility 57.3%Fiscal year ending 12/2023
NY AVG 37%
Rank #279 / 403
335603
Ellicott Center for Rehabilitation and Nursing
NH
SNF
Buffalo (Lakeview)
160
Facility 160
NY AVG 160
Rank #298 / 748
90.6%
Facility 90.6%
NY AVG 88.3%
Rank #246 / 436
+3%
3.29
Facility 3.29
NY AVG 3.58
Rank #193 / 407
-30%-8%
$10.9k
Facility $10.9k
NY AVG $67.6k
Rank #332 / 415
66
Facility 66
NY AVG 83
Rank #541 / 593
32
Facility 32
NY AVG 18.5
Rank #373 / 414
8.0
Facility 8.0
NY AVG 5.1
Rank #363 / 414
1155-
89
Facility 89
NY AVG 63
Rank #287 / 1173
Denise Marciano
$17.1MFiscal year ending 12/2023
Facility $17.1MFiscal year ending 12/2023
NY AVG $32.0M
Rank #290 / 403
$6.4MFiscal year ending 12/2023
Facility $6.4MFiscal year ending 12/2023
NY AVG $10.7M
Rank #259 / 403
37.2%Fiscal year ending 12/2023
Facility 37.2%Fiscal year ending 12/2023
NY AVG 37%
Rank #123 / 403
335437
Buffalo Center for Rehabilitation and Nursing
NH
SNF
Buffalo (Masten Park)
200
Facility 200
NY AVG 160
Rank #169 / 748
95.0%
Facility 95.0%
NY AVG 88.3%
Rank #160 / 436
+8%
4.43
Facility 4.43
NY AVG 3.58
Rank #50 / 407
-39%+24%
$139.7k
Facility $139.7k
NY AVG $67.6k
Rank #398 / 415
63
Facility 63
NY AVG 83
Rank #572 / 593
36
Facility 36
NY AVG 18.5
Rank #379 / 414
6.0
Facility 6.0
NY AVG 5.1
Rank #289 / 414
3183-
76
Facility 76
NY AVG 63
Rank #517 / 1173
David Denny
$29.7MFiscal year ending 12/2023
Facility $29.7MFiscal year ending 12/2023
NY AVG $32.0M
Rank #190 / 403
$8.4MFiscal year ending 12/2023
Facility $8.4MFiscal year ending 12/2023
NY AVG $10.7M
Rank #223 / 403
28.2%Fiscal year ending 12/2023
Facility 28.2%Fiscal year ending 12/2023
NY AVG 37%
Rank #339 / 403
335638

Financial Assistance for
Nursing Home in New York

Schofield Residence Nursing Facility is located in Buffalo, New York State.
Here are the financial assistance programs available to residents in New York State.

Get Financial aid guidance

Community First Choice Option

NY Medicaid CFCO

Age 65+ or disabled
General New York resident, Medicaid- eligible, care need (not necessarily nursing home level).
Income Limits (2025) ~$2,829/month 300% FBR, individual
Asset Limits $30,182 individual, higher due to NY Medicaid expansion
NY

Higher asset limit; urban density increases demand.

Benefits
Personal care (5-7 hours/day) Respite care (240 hours/year) Home modifications ($1,500 avg.) Assistive technology ($500 avg.)

Expanded In-Home Services for the Elderly Program (EISEP)

NY EISEP

Age 60+
General New York resident, at risk of decline but not nursing home level.
Income Limits ~$2,500/month individual, varies
Asset Limits $15,000 individual
NY

Cost-sharing required above certain income; urban/rural balance.

Benefits
In-home care (3-5 hours/week) Respite (up to 10 days/year) Case management Transportation (~5 trips/month)

Frequently Asked Questions about Schofield Residence Nursing Facility

What neighborhood is Schofield Residence Nursing Facility in?

Schofield Residence Nursing Facility is in the Elmwood North neighborhood.

Is Schofield Residence Nursing Facility in a walkable area?

Schofield Residence Nursing Facility has a walk score of 60. Moderately walkable. Some errands can be accomplished on foot, with a mix of nearby amenities.

What is the occupancy rate at Schofield Residence Nursing Facility?

Schofield Residence Nursing Facility's occupancy is 99.9%.

Does Schofield Residence Nursing Facility operate as a for-profit or non-profit?

Schofield Residence Nursing Facility is registered as a non-profit.

Are there photos of Schofield Residence Nursing Facility?

Yes — there are 5 photos of Schofield Residence Nursing Facility in the photo gallery on this page.

What is the address of Schofield Residence Nursing Facility?

Schofield Residence Nursing Facility is located at 3333 Elmwood Ave, Buffalo, NY 14217.

What is the phone number of Schofield Residence Nursing Facility?

(716) 874-1566 will put you in contact with the team at Schofield Residence Nursing Facility.

Guides for Better Senior Living

Care Cost Calculator: See Prices in Your Area

Nursing Home Data Explorer

Don’t Wait Too Long: 7 Red Flag Signs Your Parent Needs Assisted Living Now

The True Cost of Assisted Living in 2025 – And How Families Are Paying For It

Understanding Senior Living Costs: Pricing Models, Discounts & Financial Assistance