Maryville Nursing Center
Nursing Home & Memory Care · Beaverton, OR
CMS overall rating Info CMS (the Centers for Medicare & Medicaid Services) is the federal agency that rates nursing home quality. Its Overall Rating runs from 1 to 5 stars, combining health inspections, staffing, and quality measures, with inspections weighted most heavily.

Maryville Nursing Center

Nursing Home & Memory Care · Beaverton, OR
CMS overall rating Info CMS (the Centers for Medicare & Medicaid Services) is the federal agency that rates nursing home quality. Its Overall Rating runs from 1 to 5 stars, combining health inspections, staffing, and quality measures, with inspections weighted most heavily.
Calculator: See prices in your area
Maryville Nursing Center accepts Medicare, Medicaid, and private pay.

Overview of Maryville Nursing Center

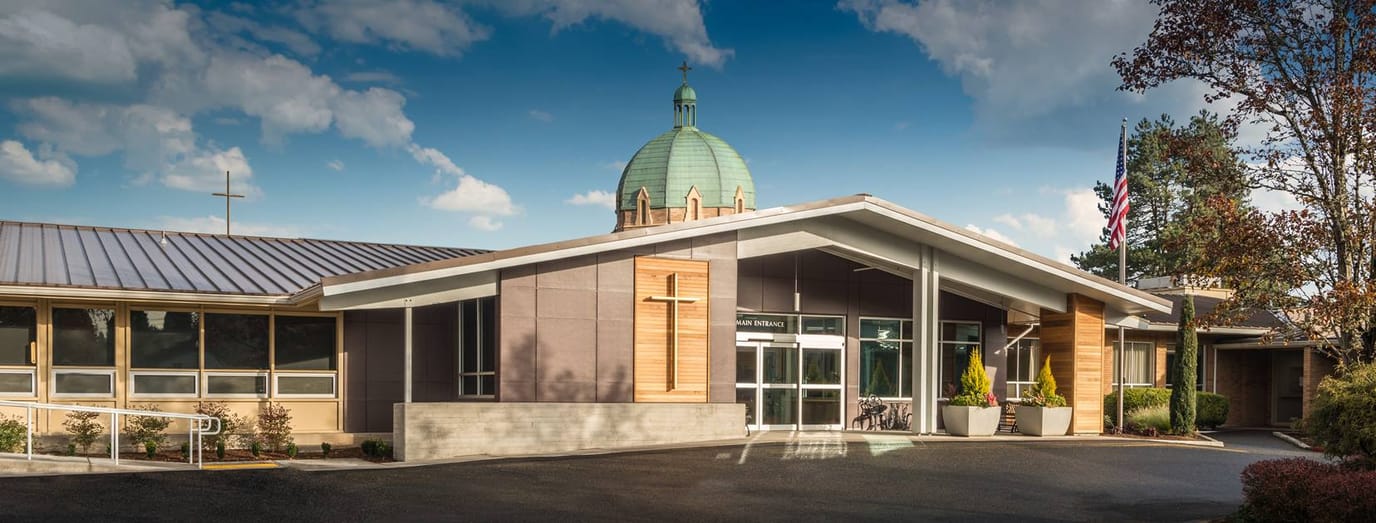
Set amidst the beautiful neighborhood of Beaverton, Oregon, Maryville Nursing Center is a dependable senior care provider, offering skilled nursing, rehabilitative, intermediate and memory care services. As a non-profit organization, the community warrants nothing but excellence in care that focuses only on the well-being of residents. Serving the senior community since 1963, Maryville Nursing Center guarantees care services founded on years of knowledge and experience, ensuring residents’ satisfaction.

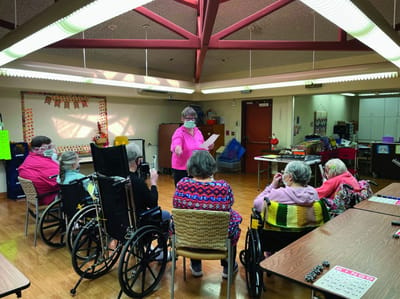
Committed to its residents’ whole-person, the community makes sure residents enjoy access to a vibrant programming that offers them plenty of opportunities to enrich their overall well-being. With access to physical, speech and occupational therapy services, residents are able to regain their strength and mobility that helps them enjoy more independence and an improved self worth and confidence.

(503) 643-8626

Quality ratings

Measured by Centers for Medicare & Medicaid Services (CMS)

Overall rating Info The Overall CMS Rating combines results from health inspections, staffing levels and quality measures. Health inspections carry the most weight. Staffing and quality scores can increase or decrease the final rating based on performance compared to state and national standards.
▲ 33.3% Above OR avg. ▲ 33.3% Above OR avg.OR average: 3.0Click the badge to see the full State ranking.Click here to see the full State ranking.
Health Inspection Info Based on the results of the facility's three most recent standard inspections and any complaint investigations. CMS reviews the number, scope, and severity of deficiencies, with more recent findings weighted more heavily.
▲ 8.5% Above OR avg. ▲ 8.5% Above OR avg.OR average: 2.8Click the badge to see the full State ranking.Click here to see the full State ranking.
Staffing Info Measures average nursing staff hours per resident per day, including Registered Nurses (RNs) and total nursing staff. Ratings are adjusted based on the level of care residents require and are compared to state and national benchmarks.
▲ 34.6% Above OR avg. ▲ 34.6% Above OR avg.OR average: 3.7Click the badge to see the full State ranking.Click here to see the full State ranking.
Quality Measures Info Based on clinical and physical health indicators reported to CMS, such as hospital readmissions, falls, pressure ulcers, and improvements in mobility. These measures reflect how well residents' health needs are being managed.
▲ 16.1% Above OR avg. ▲ 16.1% Above OR avg.OR average: 3.4Click the badge to see the full State ranking.Click here to see the full State ranking.

Staffing hours breakdown

Info Daily nursing hours per resident by staff type, reported to CMS. Higher is generally better — compare this facility to state and national averages to see where staffing stands.

Hours per resident per day — compared to Oregon state averages

Total nursing care / resident Info This home is ranked 20th out of 97 homes in Oregon for nurse hours. Total adjusted nursing hours per resident per day, combining RN, LPN, and aide time. CMS adjusts this for case-mix so facilities can be fairly compared.
5h 38m per day
Rank #20 / 97Nurse hours — State benchmarkedThis home is ranked 20th out of 97 homes in Oregon. Shows adjusted nurse hours per resident per day benchmarked to the Oregon average, with a ranking across 97 Oregon facilities. More hours mean more direct care. The national average is about 3.5 hrs; below 3.0 is a red flag.Rankings are based only on facilities in Oregon that report data for that category. Facilities without available data are excluded from the ranking.Click the rank badge to see the full State ranking.Click here to see the full State ranking.
This facility Oregon avg (5h 15m per day)
vs Oregon avg
+8%

2 of 6 metrics below state avg

Standout metric Registered Nurse (RN) is +45% above state avg
Staff typeHours / Day / Residentvs state avg
Registered Nurse (RN) Info RNs hold the highest nursing license and can assess residents, interpret test results, and direct care plans. More RN hours per day often signals stronger clinical oversight and faster response to health changes. 1h 0m per day ▲ 45% State avg: 41m per day · National avg: 41m per day
LPN / LVN Info Licensed Practical Nurses (LPNs) or Licensed Vocational Nurses (LVNs) deliver routine hands-on care — medication administration, wound dressing, and monitoring vital signs. They work under RN supervision and make up a large share of daily bedside care. 44m per day ▼ 18% State avg: 54m per day · National avg: 52m per day
Nurse Aide Info Certified Nurse Aides (CNAs) provide the most direct day-to-day assistance: bathing, dressing, feeding, and mobility. Nurse aide hours are typically the largest staffing category and directly affect residents' quality of life. 3h 50m per day ▲ 14% State avg: 3h 22m per day · National avg: 2h 21m per day
Weekend Total Nursing Info Combined nursing hours (RN + LPN + Nurse Aide) per resident per day on weekends. Staffing often drops on weekends — this figure reveals whether the facility maintains adequate coverage outside of weekday hours. 5h 4m per day ▲ 16% State avg: 4h 23m per day · National avg: 3h 26m per day
Physical Therapist Info Hours per resident per day provided by licensed Physical Therapists (PTs) or PT Assistants. PT services help residents recover mobility after injury or illness and are especially important for post-acute (short-stay) rehabilitation. 4m per day ▼ 18% State avg: 5m per day · National avg: 4m per day
Weekend RN Info Registered nurse hours specifically on weekends. Facilities sometimes reduce RN presence on Saturdays and Sundays — a low weekend RN figure compared to weekday hours can indicate reduced clinical oversight when most administrative staff are absent. 34m per day ▲ 30% State avg: 26m per day · National avg: 29m per day

Capacity and availability

This home usually has availability

Higher occupancy than the Oregon average: 65.7%
Occupancy rate
73.7% Rank #25 / 95Occupancy rate — State benchmarkedThis home is ranked 25th out of 95 homes in Oregon. Shows this facility's occupancy rate versus the Oregon average, with its Statewide rank out of 95. Higher occupancy signals strong local demand and financial stability.Rankings are based only on facilities in Oregon that report data for that category. Facilities without available data are excluded from the ranking.Click the rank badge to see the full State ranking.Click here to see the full State ranking.
Avg. Length of Stay
89 days
Bed community size
165-bed community Rank #5 / 351Bed count — State benchmarkedThis home is ranked 5th out of 351 homes in Oregon. Shows this facility's certified or reported bed count compared to other Oregon facilities. Larger communities may offer more amenities, programs, and on-site services for residents and families.Rankings are based only on facilities in Oregon that report data for that category. Facilities without available data are excluded from the ranking.Click the rank badge to see the full State ranking.Click here to see the full State ranking.
A large-scale community that may provide a wide range of amenities, services, and structured programs.
Years in operation
42 years in operation Rank #17 / 374Years in operation — State benchmarkedThis home is ranked 17th out of 374 homes in Oregon. Shows how long this facility has been in operation compared to other Oregon facilities. Longer operating histories may benefit residents, families, and staff.Rankings are based only on facilities in Oregon that report data for that category. Facilities without available data are excluded from the ranking.Click the rank badge to see the full State ranking.Click here to see the full State ranking.
A longer operating history, which may indicate experience navigating regulations and delivering ongoing care.
Walk Score
Walk Score: 55 / 100 Rank #256 / 476Walk Score — State benchmarkedThis home is ranked 256th out of 476 homes in Oregon. Shows how walkable this facility's neighborhood is compared to the average Walk Score across Oregon facilities. Higher scores benefit residents, families, and staff.Rankings are based only on facilities in Oregon that report data for that category. Facilities without available data are excluded from the ranking.Click the rank badge to see the full State ranking.Click here to see the full State ranking.
Moderately walkable. Some errands can be accomplished on foot, with a mix of nearby amenities.

About this community

License Details

CMS Certification Number385166

Staffing

Key information about the people who lead and staff this community.

Leadership

ContactKathleen Parry, Administrator

Contact Maryville Nursing Center

Inspection History

In Oregon, the Department of Human Services, Aging and People with Disabilities performs unannounced surveys and regular inspections to ensure resident safety in all care settings.

Health Inspection History

Inspections since 2019
Total health inspections 8

Oregon average 5.1


Last Health inspection on Apr 2025

Total health citations
36 Rank #52 / 95Health citations — State benchmarkedThis home is ranked 52nd out of 95 homes in Oregon. Shows this facility's total health deficiency citations benchmarked to the Oregon State average, with a ranking across all 95 OR facilities. Lower citation counts earn a better rank.Rankings are based only on facilities in Oregon that report data for that category. Facilities without available data are excluded from the ranking.Click the rank badge to see the full State ranking.Click here to see the full State ranking.

Oregon average 34

Citations per inspection
4.5 Rank #22 / 95Citations per inspection — State benchmarkedThis home is ranked 22nd out of 95 homes in Oregon. Shows average deficiency citations per CMS inspection for this facility versus the Oregon mean across 95 facilities with citation data. Lower is better.Rankings are based only on facilities in Oregon that report data for that category. Facilities without available data are excluded from the ranking.Click the rank badge to see the full State ranking.Click here to see the full State ranking.

Oregon average 6.86


Health citations are formal notices following inspections when they fail to comply with safety and care standards.

5 of 36 citations resulted from standard inspections; 22 of 36 resulted from complaint investigations; and 9 of 36 came from combined inspections (standard and complaint).

Breakdown of citation severity (last 7 years)
Critical health citations
2
300% worse than Oregon average

Oregon average: 0.5


Serious health citations
5
317% worse than Oregon average

Oregon average: 1.2

2 critical citations Oregon average: 0.5

5 serious citations Oregon average: 1.2

29 moderate citations Oregon average: 32.1

0 minor citations Oregon average: 0.2
Citations history (last 7 years)
Infection Control moderate citation Apr 11, 2025
Corrected

Quality of Care moderate citation Apr 11, 2025
Corrected

Quality of Care moderate citation Jan 03, 2025
Corrected

Quality of Care serious citation Mar 20, 2024
Corrected

Staffing Data

Reporting period: October 1 – December 31, 2025 (Q4 2025). Source: CMS Payroll-Based Journal report.

Total staff 370
Employees 207
Contractors 163
Staff to resident ratio 2.94 : 1
0% compared with Oregon average
Oregon average ratio: 2.93 : 1 Oregon average ratio: 2.93 : 1See full Oregon ranking
Avg staff/day 113
Average shift 7.6 hours
0% compared with Oregon average
Oregon average: 7.8 hours Oregon average shift: 7.8 hoursSee full Oregon ranking
Total staff hours (quarter) 79,043

Nursing staff breakdown

Q4 2025 · Oct 1 – Dec 31 More info This data comes from the CMS Payroll-Based Journal report covering October 1 – December 31, 2025.
Registered Nurse

Manages medical care and health needs.

RN Staff Info 33 total: 16 full-time employees and 17 contractors. 33
Average shift length Info Average shift length. Calculated as total hours divided by days worked and average staff per day. 8.3 hours
Licensed Practical Nurse

Assists with medical care and medications.

LPN Staff Info 43 total: 19 full-time employees and 24 contractors. 43
Average shift length Info Average shift length. Calculated as total hours divided by days worked and average staff per day. 7.8 hours
Certified Nursing Assistant

Helps with daily care and mobility.

CNA Staff Info 191 total: 105 full-time employees and 86 contractors. 191
Average shift length Info Average shift length. Calculated as total hours divided by days worked and average staff per day. 7.4 hours

Contractor staffing

Q4 2025 · Oct 1 – Dec 31 More info This data comes from the CMS Payroll-Based Journal report covering October 1 – December 31, 2025.

Total hours from contractors

15.3%

12,102 contractor hours this quarter

Certified Nursing Assistant: 86 Licensed Practical Nurse: 24 Registered Nurse: 17 Medication Aide/Technician: 9 Physical Therapy Assistant: 9 Speech Language Pathologist: 6 Qualified Social Worker: 5 Respiratory Therapy Technician: 4 Physical Therapy Aide: 3

Staff by category

Q4 2025 · Oct 1 – Dec 31 More info This data comes from the CMS Payroll-Based Journal report covering October 1 – December 31, 2025.
Certified Nursing Assistant1058619137,21492100%7.4
Licensed Practical Nurse1924438,42792100%7.8
Registered Nurse1617337,53592100%8.3
Medication Aide/Technician249337,52592100%8.4
Clinical Nurse Specialist100104,5297784%7.4
Nurse Aide in Training160163,5379199%8
Other Dietary Services Staff7072,5339098%7.5
Mental Health Service Worker4041,8807683%7.7
Speech Language Pathologist0661,4738188%6.5
Physical Therapy Aide0339307480%7.5
Respiratory Therapy Technician0448647986%6.5
RN Director of Nursing4048508795%7.5
Physical Therapy Assistant0994697379%5.4
Nurse Practitioner1014435964%7.5
Administrator1014355863%7.5
Qualified Social Worker0554006267%5.3
191 Certified Nursing Assistant
% of Days 100%
43 Licensed Practical Nurse
% of Days 100%
33 Registered Nurse
% of Days 100%
33 Medication Aide/Technician
% of Days 100%
10 Clinical Nurse Specialist
% of Days 84%
16 Nurse Aide in Training
% of Days 99%
7 Other Dietary Services Staff
% of Days 98%
4 Mental Health Service Worker
% of Days 83%
6 Speech Language Pathologist
% of Days 88%
3 Physical Therapy Aide
% of Days 80%
4 Respiratory Therapy Technician
% of Days 86%
4 RN Director of Nursing
% of Days 95%
9 Physical Therapy Assistant
% of Days 79%
1 Nurse Practitioner
% of Days 64%
1 Administrator
% of Days 63%
5 Qualified Social Worker
% of Days 67%

Penalties and fines

Includes penalties issued in 2023

Federal penalties imposed by CMS for regulatory violations, including civil money penalties (fines) and denials of payment for new Medicare/Medicaid admissions.

Source: CMS Penalties Database (Data as of Jan 2026)

Total fines amount $214K Rank #95 / 98Federal fines — State benchmarkedThis home is ranked 95th out of 98 homes in Oregon. Shows this facility's cumulative CMS federal fine dollars versus the Oregon average among facilities with fines, and where it ranks among 98 facilities in the pool. Lower total dollars mean a better rank.Rankings are based only on facilities in Oregon that report data for that category. Facilities without available data are excluded from the ranking.Click the rank badge to see the full State ranking.Click here to see the full State ranking.
258% higher than Oregon average

Oregon average: $60K

Number of fines 4
137% more fines than Oregon average

Oregon average: 1.7

Payment Denials Info Serious action where Medicare and/or Medicaid temporarily stops payments for new residents until issues are fixed. 0
100% fewer payment denials than Oregon average

Oregon average: 0.1

Fines amount comparison
This facility $214K
Oregon average $60K
Penalty History

Penalties are imposed by CMS for violations of federal nursing home regulations.

2 penalties in the past 3 years

Multiple penalties were reported in the last 3 years.

Civil Money Penalty Info Fines imposed for noncompliance, which can be assessed per day or per instance of violation. Dec 18, 2023
$107K
Civil Money Penalty Info Fines imposed for noncompliance, which can be assessed per day or per instance of violation. Aug 17, 2023
$56K

Last updated: Jan 2026

Quality of care over time

These measures show how residents usually do over time at this home, based on health outcomes and preventive care.

High-risk clinical events score Info A composite score based on pressure ulcers, falls with injury, weight loss, walking ability decline, and activities of daily living decline. 8.2
22% better than Oregon average

Oregon average: 10.5

Functional decline score Info A composite score based on activities of daily living decline, walking ability decline, and incontinence. 19.3
9% better than Oregon average

Oregon average: 21.1

Long-stay resident measures
Above average Oregon avg: 3.4 Info CMS star rating based on long-stay quality measure performance. 5 stars = significantly above average, 1 star = significantly below average.
Need for Help with Daily Activities Increased Info Percent of long-stay residents whose need for help with daily activities has increased 16.4%
In line with Oregon average

Oregon average: 16.3%

Walking Ability Worsened Info Percent of long-stay residents whose ability to move independently worsened 16.6%
33% better than Oregon average

Oregon average: 24.9%

Low Risk Residents with Bowel/Bladder Incontinence Info Percent of low risk long-stay residents who lose control of their bowels or bladder 24.7%
9% worse than Oregon average

Oregon average: 22.6%

Falls with Major Injury Info Percent of long-stay residents experiencing one or more falls with major injury 2.3%
In line with Oregon average

Oregon average: 2.4%

High Risk Residents with Pressure Ulcers Info Percent of long-stay high risk residents with pressure ulcers 3.5%
49% better than Oregon average

Oregon average: 6.9%

Urinary Tract Infection Info Percent of long-stay residents with a urinary tract infection 1.8%
13% better than Oregon average

Oregon average: 2.1%

Lost Too Much Weight Info Percent of long-stay residents who lose too much weight 2.0%
62% better than Oregon average

Oregon average: 5.3%

Depressive Symptoms Info Percent of long-stay residents who have depressive symptoms 3.0%
36% better than Oregon average

Oregon average: 4.6%

Antipsychotic Use Info Percent of long-stay residents who received an antipsychotic medication 13.8%
In line with Oregon average

Oregon average: 13.2%

Pneumococcal Vaccine Info Percent of long-stay residents assessed and appropriately given the pneumococcal vaccine 90.5%
5% worse than Oregon average

Oregon average: 95.7%

Influenza Vaccine Info Percent of long-stay residents assessed and appropriately given the seasonal influenza vaccine 98.0%
In line with Oregon average

Oregon average: 95.2%

Hospitalizations per 1,000 days Info Number of hospitalizations per 1,000 long-stay resident days. 1.63
16% worse than Oregon average

Oregon average: 1.40

ED visits per 1,000 days Info Number of outpatient emergency department visits per 1,000 long-stay resident days. 0.98
61% better than Oregon average

Oregon average: 2.52

Short-stay resident measures
Significantly above average Oregon avg: 3.2 Info CMS star rating based on short-stay quality measure performance. 5 stars = much above average, 1 star = much below average.
Pneumococcal Vaccine Info Percent of short-stay residents assessed and appropriately given the pneumococcal vaccine 84.5%
In line with Oregon average

Oregon average: 86.2%

Antipsychotic medication increase Info Percent of short-stay residents who newly received an antipsychotic medication 0.2%
87% better than Oregon average

Oregon average: 1.8%

Influenza Vaccine Info Percent of short-stay residents assessed and appropriately given the seasonal influenza vaccine 76.8%
5% worse than Oregon average

Oregon average: 81.2%

Re-hospitalized after SNF stay Info Percentage of short-stay residents who were re-hospitalized after their nursing home admission. 19.0%
12% better than Oregon average

Oregon average: 21.6%

Emergency department visits Info Percentage of short-stay residents who had an outpatient emergency department visit. 10.7%
29% better than Oregon average

Oregon average: 15.1%

Falls with major injury Info Percentage of SNF residents who experience falls with major injury during their stay. 0.0%
100% better than Oregon average

Oregon average: 0.8%

Ability to care for self at discharge Info Percentage of residents at or above expected ability to care for themselves at discharge. 61.7%
15% better than Oregon average

Oregon average: 53.7%

Successful return to home or community Info Rate of successful return to home or community from a skilled nursing facility. 65.3%
29% better than Oregon average

Oregon average: 50.6%

Breakdown by payment type

Medicare

26% of new residents, usually for short-term rehab.

Typical stay 1 - 2 months

Private pay

50% of new residents, often for short stays.

Typical stay 1 - 2 months

Medicaid

24% of new residents, often for long-term daily care.

Typical stay 8 - 9 months

Facility Characteristics

Source: CMS Long-Term Care Facility Characteristics (Data as of Jan 2026)

Total residents 126
Medicare
17
13.5% of residents
Medicaid
75
59.5% of residents
Private pay or other
34
27% of residents
Programs & Services
Residents Group

Residents meet regularly to discuss policies, care quality, and activities

Active Resident Council

Organized group of residents that meets regularly to discuss facility policies, quality of life, and activities.

Finances and operations

Based on CMS SNF Cost Report for fiscal year ending in 06/2024.

Governmental community
Operated by a subsidized facility district.
Net patient revenue Info Net patient revenue — what the home actually collects for resident care, after contractual allowances, bad debt and discounts are subtracted from its gross charges (CMS cost report, Worksheet G-3). It covers resident care only; money the home earns from other sources is shown separately as "Other income."
$25.1M
Net patient income Info Net patient income: net patient revenue minus the home's total operating expenses. A positive figure means it earns more from resident care than it spends to deliver it; a negative figure means the opposite. It excludes non-operating "other income."
-$1.9M
Governmental community Operated by a subsidized facility district.
Net patient revenue Info Net patient revenue — what the home actually collects for resident care, after contractual allowances, bad debt and discounts are subtracted from its gross charges (CMS cost report, Worksheet G-3). It covers resident care only; money the home earns from other sources is shown separately as "Other income."
$25.1M Rank #3 / 93Revenue — State benchmarkedThis home is ranked 3rd out of 93 homes in Oregon. Shows this facility's annual revenue compared to the Oregon average. Higher revenue generally means more resources for staffing and capital — read alongside Payroll %.Rankings are based only on facilities in Oregon that report data for that category. Facilities without available data are excluded from the ranking.Click the rank badge to see the full State ranking.Click here to see the full State ranking.
Net patient income Info Net patient income: net patient revenue minus the home's total operating expenses. A positive figure means it earns more from resident care than it spends to deliver it; a negative figure means the opposite. It excludes non-operating "other income."
-$1.9M
Other income Info Money the home earns outside of resident care — such as investments, grants, rentals and other non-operating sources (CMS cost report, Worksheet G-3). It is tracked separately from net patient revenue: it is not part of that figure, and it is not included in net patient income.
$1.1M
Payroll costs Info Staff salaries plus wage-related costs — benefits such as payroll taxes, health insurance and retirement — from the home's own accounting records (CMS cost report, Worksheet A). Contract or agency labor is counted separately, under other operating costs. Rank #3 / 93Payroll — State benchmarkedThis home is ranked 3rd out of 93 homes in Oregon. Shows total annual staff payroll benchmarked to the Oregon average. Higher payroll investment relative to peers often signals better staffing and less reliance on cheaper contract labor.Rankings are based only on facilities in Oregon that report data for that category. Facilities without available data are excluded from the ranking.Click the rank badge to see the full State ranking.Click here to see the full State ranking.
$12.4M 49.6% of net patient revenue Info Payroll as a share of revenue: staff salaries and wage-related benefits divided by net patient revenue. A higher figure means more of each revenue dollar goes to staff pay. Rank #16 / 93Payroll % — State benchmarkedThis home is ranked 16th out of 93 homes in Oregon. Shows payroll as a percentage of revenue versus the Oregon average. Well-run Oregon facilities typically land around 51–62% — the top third Statewide. Below 25% may signal understaffing or heavy agency use — read with Staffing ratings.Rankings are based only on facilities in Oregon that report data for that category. Facilities without available data are excluded from the ranking.Click the rank badge to see the full State ranking.Click here to see the full State ranking.
Other operating costs Info Everything it costs to run the home apart from payroll — food, utilities, supplies, maintenance, contract labor and administration. Calculated as total operating expense minus payroll (staff salaries and wage-related benefits).
$14.6M
Total costs Info The home's total operating expense for the year — all the costs of running it, salaries included (CMS cost report, Worksheet G-3).
$27.0M

What does this home offer?

Housing options icon

Housing Options: Studio / 1 Bed / 2 Bed

Building type icon
Building type icon

Building Type: Single-story

Who this home usually serves

TYPE OF STAY

Mix of rehab and long-term care

This home supports both short-term rehab and long-term care, with residents staying for a wide range of durations.

Most new residents arrive under private pay (50% of admissions), and a typical private pay stay runs around 1 - 2 months.

Admissions
498 total

Coverage residents most often arrive under.

Medicare 26%
Private pay 50%
Medicaid 24%
Discharges
513 total

Coverage residents most often leave under.

Medicare 23%
Private pay 55%
Medicaid 22%

Places of interest near Maryville Nursing Center

Address 9.1 miles from city center Info Estimated distance in miles from Beaverton's city center to Maryville Nursing Center's address, calculated via Google Maps.

Calculate Travel Distance to Maryville Nursing Center

Add your location

Address

Compare Nursing Homes around Beaverton

The information below is reported by the Oregon Department of Human Services, Aging and People with Disabilities.

2 facilities compared · CMS & OR Dept. of Health data

Avamere Rehabilitation of Beaverton
NH
AL
IL
MC
Beaverton (Vose)
104
Facility 104
OR AVG 67
Rank #45 / 351
73.0%
Facility 73.0%
OR AVG 65.7%
Rank #28 / 95
+11%
5.21
Facility 5.21
OR AVG 5.24
Rank #45 / 97
-9%-1%
$55.6k
Facility $55.6k
OR AVG $62.3k
Rank #81 / 98
18
Facility 18
OR AVG 34.0
Rank #18 / 95
4.5
Facility 4.5
OR AVG 6.9
Rank #22 / 95
174-
68
Facility 68
OR AVG 55
Rank #173 / 476
Nair Facility Holdings LLC
$16.8M
Facility $16.8M
OR AVG $12.6M
Rank #21 / 93
$7.5M
Facility $7.5M
OR AVG $4.5M
Rank #19 / 93
44.5%
Facility 44.5%
OR AVG 38%
Rank #60 / 93
385195
Maryville Nursing Center
NH
MC
Beaverton (Central Beaverton)
165
Facility 165
OR AVG 67
Rank #5 / 351
73.7%
Facility 73.7%
OR AVG 65.7%
Rank #25 / 95
+12%
5.64
Facility 5.64
OR AVG 5.24
Rank #20 / 97
-3%+8%
$162.8k
Facility $162.8k
OR AVG $62.3k
Rank #95 / 98
36
Facility 36
OR AVG 34.0
Rank #52 / 95
4.5
Facility 4.5
OR AVG 6.9
Rank #22 / 95
7137-
55
Facility 55
OR AVG 55
Rank #256 / 476
St Mary Of Oregon Ministries Oregon
$25.1M
Facility $25.1M
OR AVG $12.6M
Rank #3 / 93
$12.4M
Facility $12.4M
OR AVG $4.5M
Rank #3 / 93
49.6%
Facility 49.6%
OR AVG 38%
Rank #16 / 93
385166

Financial Assistance for
Nursing Home in Oregon

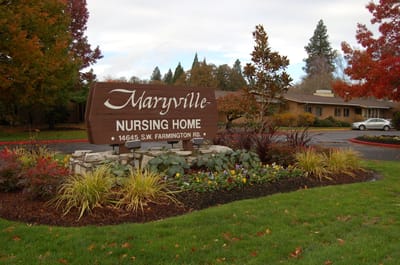
Maryville Nursing Center is located in Beaverton, Oregon.
Here are the financial assistance programs available to residents in Oregon.

Get Financial aid guidance

Oregon Project Independence (OPI)

OPI

Age 60+
General Oregon resident, at risk of nursing home but not Medicaid-eligible.
Income Limits ~$2,000/month individual, varies
Asset Limits $5,000 individual
OR

Cost-sharing required; rural/urban balance.

Benefits
In-home care (3-5 hours/week) Respite (up to 10 days/year) Adult day care (~$70/day) Transportation (~5 trips/month)

Oregon Medicaid Community-Based Care

OR Medicaid CBC

Age 65+ or disabled
General Oregon resident, Medicaid-eligible, nursing home-level care need.
Income Limits (2025) ~$2,829/month 300% FBR, individual
Asset Limits $2,000 (individual), $3,000 (couple).
OR

High demand in urban areas (e.g., Portland).

Benefits
Personal care (5-7 hours/day) Respite (240 hours/year) Adult day care ($70/day) Home modifications ($1,500 avg.)

Program of All-Inclusive Care for the Elderly (PACE)

Oregon PACE (e.g., Providence ElderPlace)

Age 55+
General OR resident (specific counties), NFLOC, safe with PACE support.
Income Limits (2025) ~$2,829/month (Medicaid-eligible); private pay option available.
Asset Limits $2,000 (individual), $3,000 (couple) for Medicaid enrollees.
OR

Available in 11 counties (e.g., Multnomah, Washington); Providence ElderPlace dominant provider.

Benefits
Personal care (5-7 hours/day) Medical care Meals Transportation Respite Therapies

Medicare Savings Program (MSP)

Oregon Medicare Savings Program

Age 65+ or disabled
General OR resident, Medicare Part A/B.
Income Limits (2025) ~$2,510/month (QMB), ~$3,380/month (SLMB), ~$3,598/month (QI)—individual.
Asset Limits $9,430 (individual), $14,130 (couple).
OR

Three tiers; includes Extra Help for Part D; no waitlist.

Benefits
Covers Part B premiums ($174.70/month) Deductibles ($240/year) Copays (~20%)

Family Caregiver Support Program (FCSP)

Oregon Family Caregiver Support Program

Age
General Caregivers of 60+ needing care or 55+ caregivers of others; OR resident; functional needs (2+ ADLs).
Income Limits (2025) No strict cap; prioritizes low-income ~$24,980/year
Asset Limits Not assessed; need-based.
OR

15 regions; rural priority; includes grandparent caregivers.

Benefits
Respite (4-6 hours/week or 5 days/year) Adult day care ($60/day) Training Supplies (~$500/year)

VA Aid and Attendance (A&A) and Housebound Benefits

Oregon VA Aid and Attendance/Housebound

Age 65+ or disabled veteran/spouse
General OR resident, wartime service, need for ADL help (A&A) or homebound.
Income Limits (2025) Net income < ~$1,984/month (veteran with dependent, A&A); pension offsets income.
Asset Limits ~$155,356 net worth limit
OR

High veteran demand; Oregon Veterans’ Homes option.

Benefits
Cash (~$1,433-$2,642/month veteran, ~$951-$1,318 spouse) for care costs (e.g., in-home, assisted living)

Senior Property Tax Deferral Program

Oregon Property Tax Deferral for Disabled and Senior Citizens

Age 62+
General OR resident, homeowner 5+ years, low-income.
Income Limits (2025) ~$58,000/year household, adjusted annually
Asset Limits Home value < county median; equity > 15%.
OR

Deferred taxes accrue 6% interest; repaid upon sale/death.

Benefits
Tax deferral (~$1,000-$3,000/year avg., varies by county)

Elderly Nutrition Program (ENP)

Oregon Elderly Nutrition Program

Age 60+
General OR resident (or spouse of any age); no income limit.
Income Limits (2025) None; donations encouraged.
Asset Limits Not assessed.
OR

Includes Meals on Wheels; prioritizes homebound/low-income.

Benefits
Home-delivered or congregate meals (~$5-$7/meal value, 5 meals/week avg.)

Frequently Asked Questions about Maryville Nursing Center

What neighborhood is Maryville Nursing Center in?

Maryville Nursing Center is in the Central Beaverton neighborhood of Beaverton.

Is Maryville Nursing Center in a walkable area?

Maryville Nursing Center has a walk score of 55. Moderately walkable. Some errands can be accomplished on foot, with a mix of nearby amenities.

What is the occupancy rate at Maryville Nursing Center?

Maryville Nursing Center's occupancy is 73.7%.

Are there photos of Maryville Nursing Center?

Yes — there are 4 photos of Maryville Nursing Center in the photo gallery on this page.

What is the address of Maryville Nursing Center?

Maryville Nursing Center is located at 14645 Sw Farmington Rd, Beaverton, OR 97007.

What is the phone number of Maryville Nursing Center?

(503) 643-8626 will put you in contact with the team at Maryville Nursing Center.

Is Maryville Nursing Center Medicare or Medicaid certified?

Yes — Maryville Nursing Center is a CMS-certified provider of Medicare and Medicaid.

Guides for Better Senior Living

Care Cost Calculator: See Prices in Your Area

Nursing Home Data Explorer

Don’t Wait Too Long: 7 Red Flag Signs Your Parent Needs Assisted Living Now

The True Cost of Assisted Living in 2025 – And How Families Are Paying For It

Understanding Senior Living Costs: Pricing Models, Discounts & Financial Assistance