The Merriman

Independent Living in Ohio

CMS overall rating Info The Overall CMS Rating is scored from 1 to 5 stars and combines results from health inspections, staffing levels, and quality measures. Health inspections carry the most weight. Staffing and quality scores can increase or decrease the final rating based on performance compared to state and national standards.
Calculator: See prices in your area
The Merriman accepts Medicare, Medicaid, and private pay.

Overview of The Merriman

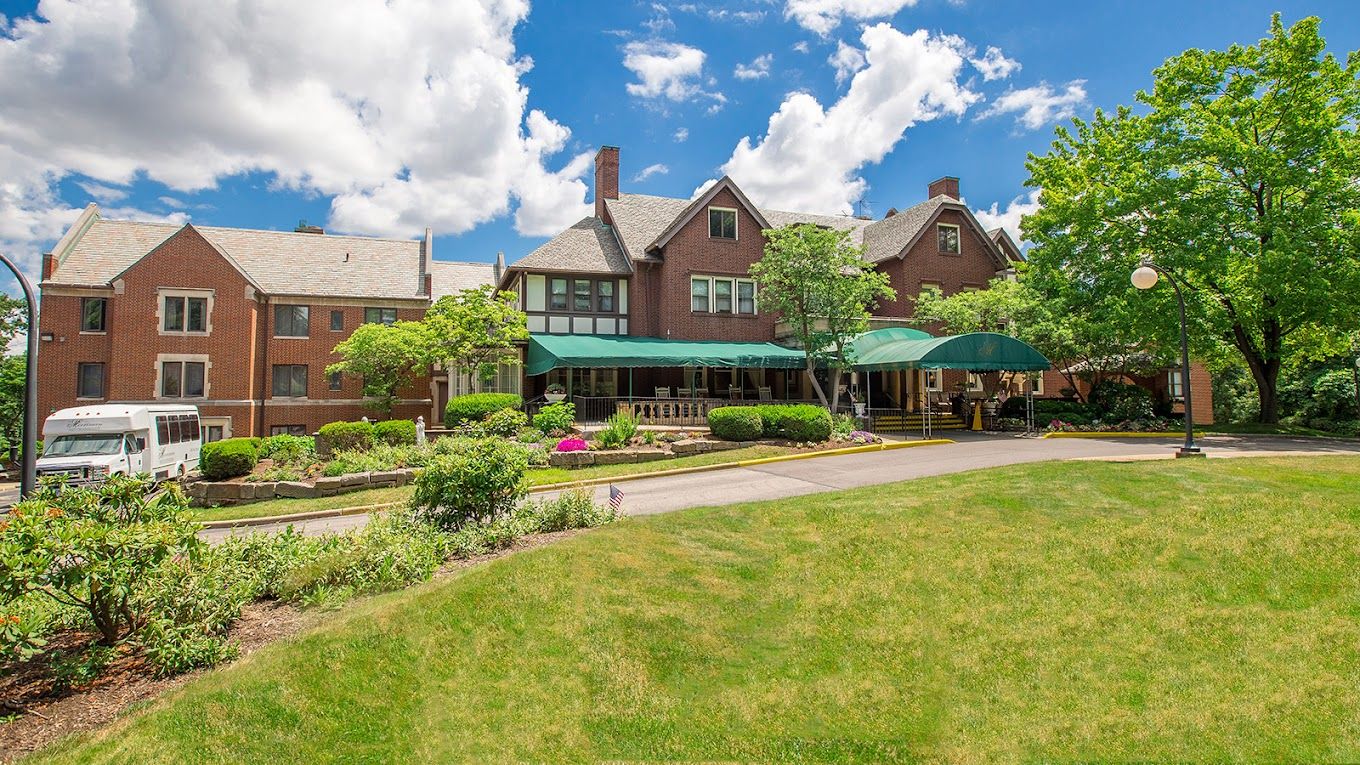
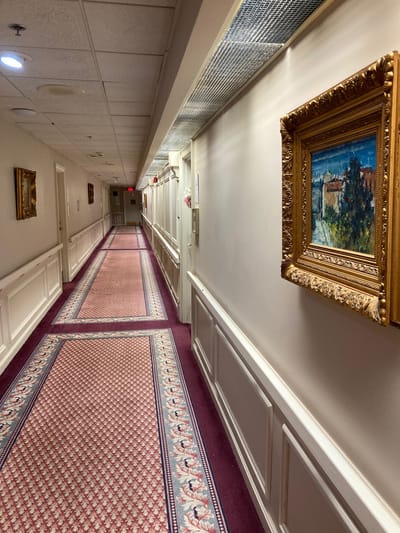
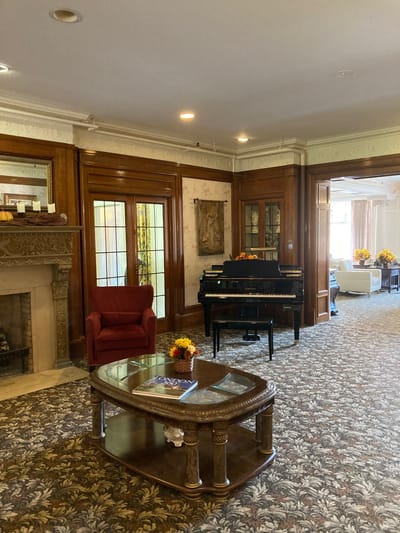
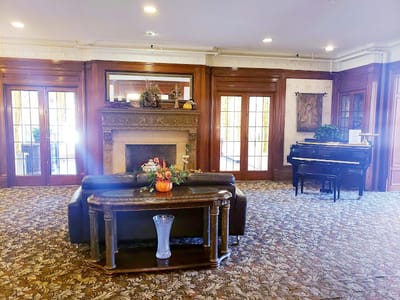
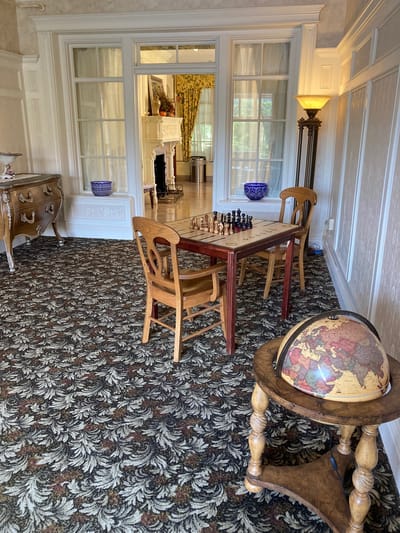
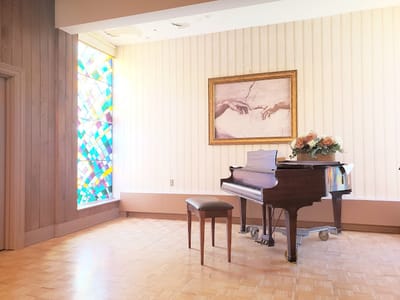
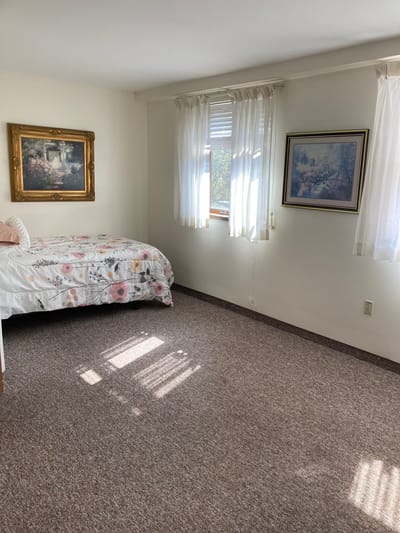
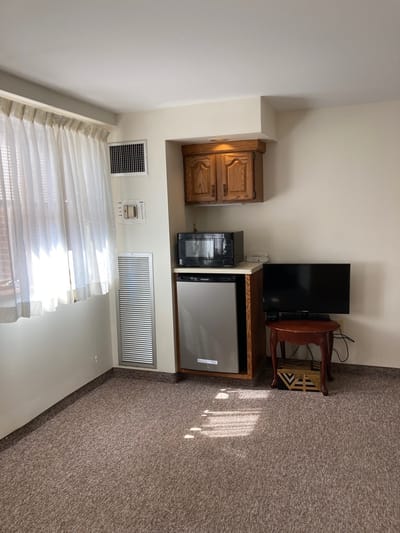
The Merriman is a distinguished assisted living and skilled nursing care facility in the heart of Akron, Ohio. Within its welcoming embrace, residents and patients discover a blend of warm indoor and inviting outdoor common spaces thoughtfully designed to provide comfort and relaxation. At The Merriman, a commitment to enhancing the quality of life is evident in their premium activities. These activities promote a healthy lifestyle and nurture a vibrant social life, recognizing the importance of social engagement in well-being.
What truly sets The Merriman apart is its exceptional staff, available around the clock to attend to medical, physical, and emotional needs. Regardless of the hour, their dedicated team ensures that residents and patients receive the required care and support. One notable aspect of The Merriman is its unique offering of assisted living and skilled nursing care on a single campus. This integrated approach ensures that residents and patients can access a continuum of care within a familiar and comforting environment.

Quality ratings

Measured by Centers for Medicare & Medicaid Services (CMS)

Overall rating Info The Overall CMS Rating combines results from health inspections, staffing levels and quality measures. Health inspections carry the most weight. Staffing and quality scores can increase or decrease the final rating based on performance compared to state and national standards.
2/5 ▼ 1.2 Ohio average: 3.2/5
Health Inspection Info Based on the results of the facility's three most recent standard inspections and any complaint investigations. CMS reviews the number, scope, and severity of deficiencies, with more recent findings weighted more heavily.
1/5 ▼ 1.8 Ohio average: 2.8/5
Staffing Info Measures average nursing staff hours per resident per day, including Registered Nurses (RNs) and total nursing staff. Ratings are adjusted based on the level of care residents require and are compared to state and national benchmarks.
2/5 ▼ 0.4 Ohio average: 2.4/5
Quality Measures Info Based on clinical and physical health indicators reported to CMS, such as hospital readmissions, falls, pressure ulcers, and improvements in mobility. These measures reflect how well residents' health needs are being managed.
5/5 ▲ 0.6 Ohio average: 4.4/5

Staffing hours breakdown

Info Daily nursing hours per resident by staff type, reported to CMS. Higher is generally better — compare this facility to state and national averages to see where staffing stands.

Hours per resident per day — compared to Ohio state averages

Total nursing care / resident Info This home is ranked 83rd out of 165 homes in Ohio.

Total adjusted nursing hours per resident per day, combining RN, LPN, and aide time. CMS adjusts this for case-mix so facilities can be fairly compared.
3h 31m per day
Rank #83 / 165Nurse hours — state benchmarkedThis home is ranked 83rd out of 165 homes in Ohio.Shows adjusted nurse hours per resident per day benchmarked to the Ohio average, with a ranking across 165 Ohio SNFs. More hours mean more direct care. The national average is about 3.5 hrs; below 3.0 is a red flag.
This facility Ohio avg (3h 32m per day)
vs Ohio avg
-1%

3 of 6 metrics below state avg

Standout metric RN (Weekend) is +16% above state avg
Staff type Hours / day vs state avg
Registered Nurse (RN) Info RNs hold the highest nursing license and can assess residents, interpret test results, and direct care plans. More RN hours per day often signals stronger clinical oversight and faster response to health changes. 28m per day ▼ 26% State avg: 38m per day · National avg: 41m per day
LPN / LVN Info Licensed Practical Nurses (LPNs) or Licensed Vocational Nurses (LVNs) deliver routine hands-on care — medication administration, wound dressing, and monitoring vital signs. They work under RN supervision and make up a large share of daily bedside care. 1h 0m per day ▲ 3% State avg: 58m per day · National avg: 52m per day
Nurse Aide Info Certified Nurse Aides (CNAs) provide the most direct day-to-day assistance: bathing, dressing, feeding, and mobility. Nurse aide hours are typically the largest staffing category and directly affect residents' quality of life. 1h 46m per day ▼ 17% State avg: 2h 8m per day · National avg: 2h 20m per day
Total Nursing (Weekend) Info Combined nursing hours (RN + LPN + Nurse Aide) per resident per day on weekends. Staffing often drops on weekends — this figure reveals whether the facility maintains adequate coverage outside of weekday hours. 2h 51m per day ▼ 13% State avg: 3h 17m per day · National avg: 3h 26m per day
Physical Therapist Info Hours per resident per day provided by licensed Physical Therapists (PTs) or PT Assistants. PT services help residents recover mobility after injury or illness and are especially important for post-acute (short-stay) rehabilitation. 3m per day ■ Avg State avg: 3m per day · National avg: 4m per day
RN (Weekend) Info Registered nurse hours specifically on weekends. Facilities sometimes reduce RN presence on Saturdays and Sundays — a low weekend RN figure compared to weekday hours can indicate reduced clinical oversight when most administrative staff are absent. 29m per day ▲ 16% State avg: 25m per day · National avg: 28m per day

Capacity and availability

This home usually has availability

Occupancy lower than 85% suggests more openings may be available.

Lower occupancy than the Ohio average: 78.7%
Occupancy rate 76.5% Rank #101 / 166Occupancy rate — state benchmarkedThis home is ranked 101st out of 166 homes in Ohio.Shows this facility's occupancy rate versus the Ohio average, with its statewide rank out of 166. Higher occupancy signals strong local demand and financial stability.
Avg. Length of Stay 297 days
Occupancy rate
76.5% Rank #101 / 166Occupancy rate — state benchmarkedThis home is ranked 101st out of 166 homes in Ohio.Shows this facility's occupancy rate versus the Ohio average, with its statewide rank out of 166. Higher occupancy signals strong local demand and financial stability.
Avg. Length of Stay
297 days

Who this home usually serves

TYPE OF STAY

Primarily long-term care, limited rehab

Most residents stay long-term, while a smaller portion are admitted for short-term rehab.

Breakdown by payment type

Medicare

11% of new residents, usually for short-term rehab.

Typical stay 2 - 3 months

Private pay

65% of new residents, often for short stays.

Typical stay 1 years

Medicaid

24% of new residents, often for long-term daily care.

Typical stay 4 - 5 months

Finances and operations

Privately-owned community
Operated by a partnership between two or more business owners.
Home revenue
$6.0M
Profit
$734.5K
Privately-owned community Operated by a partnership between two or more business owners.
Home revenue
$6.0M Rank #142 / 165Revenue — state benchmarkedThis home is ranked 142nd out of 165 homes in Ohio.Shows this facility's annual revenue compared to the Ohio SNF average. Higher revenue generally means more resources for staffing and capital — read alongside Payroll %.
Profit
$734.5K
Payroll costs Info The portion of the home's budget spent on staff, including nurses, caregivers, and other employees who support care and operations. Rank #140 / 165Payroll — state benchmarkedThis home is ranked 140th out of 165 homes in Ohio.Shows total annual staff payroll benchmarked to the Ohio average. Higher payroll investment relative to peers often signals better staffing and less reliance on cheaper contract labor.
$2.4M
39.6% of revenue Rank #70 / 165Payroll % — state benchmarkedThis home is ranked 70th out of 165 homes in Ohio.Shows payroll as a percentage of revenue versus the Ohio average. Well-run SNFs often land around 55–65%. Below 25% may signal understaffing or heavy agency use — read with Staffing ratings.
Other operating costs Info All remaining costs needed to run the home, such as food, utilities, building maintenance, supplies and administrative expenses.
$2.9M
Total costs $5.3M
Walk Score
Walk Score: 70 / 100 Rank #9 / 115Walk Score — state benchmarkedThis home is ranked 9th out of 115 homes in Ohio.Shows how walkable this facility's neighborhood is compared to the average Walk Score across Ohio SNFs. Higher scores benefit residents, families, and staff.
Very walkable. Most errands can be accomplished on foot, and many essentials are within a short walk.

About this community

Therapy & Rehabilitation

2 services
Rehabilitation Services
Respite Care

Staffing & Medical

3 services
Doctor on Staff
Licensed Nurses/CNAs
24-Hour Staffing

Amenities & Lifestyle

Activities On- & Off-Site
Devotional Services On- & Off-Site
Outdoor & Indoor Common Areas
Beautician On-Site
Specific ProgramsSkilled Nursing Care, Assisted Living Community, Diabetic Care, Non-Ambulatory Care

Dining & Nutrition

Food DescriptionMeals provided with vegetarian options and alternate menu options available.
Meals IncludedYes

Types of Care at The Merriman

Assisted Living Nursing Home

Contact The Merriman

Health Inspection History

Inspections
Total health inspections 16

State average 6.7


Last Health inspection on Jun 2025

Total health citations
63 Rank #158 / 166Health citations — state benchmarkedThis home is ranked 158th out of 166 homes in Ohio.Shows this facility's total health deficiency citations benchmarked to the Ohio state average, with a ranking across all 166 OH SNFs. Lower citation counts earn a better rank.

State average 30.9

Citations per inspection
3.94 Rank #73 / 166Citations per inspection — state benchmarkedThis home is ranked 73rd out of 166 homes in Ohio.Shows average deficiency citations per CMS inspection for this facility versus the Ohio mean across 166 SNFs with citation data. Lower is better.

State average 4.59


Health citations are formal notices following inspections when they fail to comply with safety and care standards.

20 of 63 citations resulted from standard inspections; 41 of 63 resulted from complaint investigations; and 2 of 63 came from combined inspections (standard and complaint).

Breakdown of citation severity (last 3 years)
Critical Health citations More info
0
100% better than State average

State average: 0.3


Serious Health citations More info 3
233% worse than State average

State average: 0.9

0 critical citations More info State average: 0.3

3 serious citations More info State average: 0.9

60 moderate citations More info State average: 29

0 minor citations More info State average: 0.7
Citations history (last 3 years)
Nutrition moderate citation Info Issues related to food quality, meal service, and resident's nutritional needs. Jun 26, 2025
Corrected

Resident Rights moderate citation Info Issues related to resident's rights, including dignity, privacy, and the ability to make decisions about their care. Jun 26, 2025
Corrected

Nutrition moderate citation Info Issues related to food quality, meal service, and resident's nutritional needs. Jan 23, 2025
Corrected

Nutrition moderate citation Info Issues related to food quality, meal service, and resident's nutritional needs. Jan 23, 2025
Corrected

Financial Assistance for
Independent Living in Ohio

The Merriman is located in Akron, Ohio.
Here are the financial assistance programs available to residents in Ohio.

Get Financial aid guidance

PASSPORT Waiver

Ohio Medicaid PASSPORT

Age 60+
General Ohio resident, Medicaid-eligible, nursing home-level care need.
Income Limits (2025) ~$2,829/month 300% FBR, individual
Asset Limits $2,000 (individual), $3,000 (couple).
OH

Administered through regional agencies; waitlists possible.

Benefits
Personal care (5-7 hours/day) Respite (240 hours/year) Adult day care ($65/day) Home modifications ($1,500 avg.)

Ohio Home Care Program (non-Medicaid)

OH HCP

Age 60+
General Ohio resident, at risk of decline.
Income Limits ~$2,000/month individual, varies
Asset Limits $5,000 individual
OH

Limited funding; regional variation.

Benefits
In-home care (3-5 hours/week) Respite (up to 10 days/year) Transportation (~5 trips/month)

Assisted Living Waiver (ALW)

Ohio Assisted Living Waiver

Age 21+ (65+ prioritized)
General OH resident, Medicaid-eligible, NFLOC.
Income Limits (2025) ~$2,829/month (individual); QIT required.
Asset Limits $2,000 (individual), $3,000 (couple).
OH

Covers ~300 facilities; room/board not included (separate cost).

Benefits
Personal care Meals Medication management Transportation (~$3,000-$4,000/month value)

Program of All-Inclusive Care for the Elderly (PACE)

Ohio PACE (e.g., McGregor PACE)

Age 55+
General OH resident (specific counties), NFLOC, safe with PACE support.
Income Limits (2025) ~$2,829/month (Medicaid-eligible); private pay option available.
Asset Limits $2,000 (individual), $3,000 (couple) for Medicaid enrollees.
OH

Available in 9 counties (e.g., Cuyahoga, Franklin); expanding via Healthy Aging Grants.

Benefits
Personal care (5-7 hours/day) Medical care Meals Transportation Respite Therapies

Medicare Savings Program (MSP)

Ohio Medicare Savings Program

Age 65+ or disabled
General OH resident, Medicare Part A/B.
Income Limits (2025) ~$2,510/month (QMB), ~$3,380/month (SLMB), ~$3,598/month (QI)—individual.
Asset Limits $9,430 (individual), $14,130 (couple).
OH

Three tiers; includes Extra Help for Part D; no waitlist.

Benefits
Covers Part B premiums ($174.70/month) Deductibles ($240/year) Copays (~20%)

Home Energy Assistance Program (HEAP)

Ohio HEAP

Age 60+ prioritized
General OH resident, low-income household.
Income Limits (2025) ~$3,970/month individual, 185% FPL
Asset Limits Not assessed; income-focused.
OH

Covers gas, electric, oil; emergency aid via Winter/Summer Crisis Programs.

Benefits
Heating/cooling aid ($300-$1,000/season) Emergency aid ($500 max)

Family Caregiver Support Program (FCSP)

Ohio Family Caregiver Support Program

Age
General Caregivers of 60+ needing care or 55+ caregivers of others; OH resident; functional needs (2+ ADLs).
Income Limits (2025) Prioritizes ~$24,980/year (individual); no strict cap.
Asset Limits Not assessed; need-based.
OH

12 AAAs; rural/low-income priority; volunteer respite option.

Benefits
Respite (4-6 hours/week or 5 days/year) Adult day care ($60/day) Training Supplies (~$500/year)

Senior Community Service Employment Program (SCSEP)

Ohio SCSEP

Age 55+
General unemployed, low-income, OH resident.
Income Limits (2025) ~$1,983/month 125% FPL
Asset Limits Not specified; income-focused.
OH

Priority for veterans, rural residents; AARP partnership.

Benefits
Paid training (~20 hours/week at ~$7.25/hour) Job placement

VA Aid and Attendance (A&A) and Housebound Benefits

Ohio VA Aid and Attendance/Housebound

Age 65+ or disabled veteran/spouse
General OH resident, wartime service, need for ADL help (A&A) or homebound.
Income Limits (2025) Net income < ~$1,984/month (veteran with dependent, A&A); pension offsets income.
Asset Limits ~$155,356 net worth limit
OH

High veteran demand; supports care in multiple settings.

Benefits
Cash (~$1,433-$2,642/month veteran, ~$951-$1,318 spouse) for care costs (e.g., in-home, assisted living)

Homestead Exemption

Ohio Homestead Exemption

Age 65+ (or disabled)
General OH resident, homeowner, low-income.
Income Limits (2025) ~$38,500/year individual, adjusted annually
Asset Limits Not assessed; home ownership required.
OH

Reduces taxable value by $25,000; applies to primary residence.

Benefits
Tax reduction (~$400-$800/year avg., varies by county)

Save the Dream Ohio (Homeowner Assistance Fund)

Ohio Save the Dream

Age 60+ prioritized
General OH resident, homeowner, hardship post-Jan 21, 2020.
Income Limits (2025) ~$147,600/year family of 4, 150% AMI; varies by county
Asset Limits Not assessed; hardship-focused.
OH

Covers delinquent mortgages, utilities, taxes; max $25,000 mortgage aid.

Benefits
Mortgage aid ($25,000 max) Utility/property tax aid ($5,000 avg.)

Places of interest near The Merriman

Address 1.6 miles from city center Info Estimated distance in miles from Akron's city center to The Merriman's address, calculated via Google Maps. — 1.49 miles to nearest hospital (Akron Children's Hospital)

Calculate Travel Distance to The Merriman

Add your location

Address

Staffing Data (Q2 2025)

This data corresponds to Q2 2025 and is based on CMS Payroll-Based Journal.

Total staff 175
Employees 99
Contractors 76
Staff to resident ratio 3.30:1
54% better than Ohio average

Ohio average ratio: 2.14:1

Avg staff/day 29
Average shift 7.6 hours
6% worse than Ohio average

Ohio average: 8.1 hours

Total staff hours (quarter) 20,180
Nursing staff breakdown
Registered Nurse

Manages medical care and health needs.

Total count 33
Average shift length Info Average shift length. Calculated as total hours divided by days worked and average staff per day. 9.9 hours

This role is partially covered by contractors.

Licensed Practical Nurse

Assists with medical care and medications.

Total count 41
Average shift length Info Average shift length. Calculated as total hours divided by days worked and average staff per day. 7.8 hours

This role is partially covered by contractors.

Certified Nursing Assistant

Helps with daily care and mobility.

Total count 65
Average shift length Info Average shift length. Calculated as total hours divided by days worked and average staff per day. 7.8 hours

This role is partially covered by contractors.

Contractor staffing

Total hours from contractors

9.8%

1,979 contractor hours this quarter

Registered Nurse: 25 Licensed Practical Nurse: 22 Certified Nursing Assistant: 20 Speech Language Pathologist: 2 Qualified Social Worker: 1 Physical Therapy Assistant: 1 Physical Therapy Aide: 1 Occupational Therapy Aide: 1 Medical Director: 1 Respiratory Therapy Technician: 1 Occupational Therapy Assistant: 1
Staff by category
Certified Nursing Assistant 45 20 65 8,651 91 100% 7.8
Licensed Practical Nurse 19 22 41 3,462 91 100% 7.8
Other Dietary Services Staff 7 0 7 1,570 90 99% 7
RN Director of Nursing 3 0 3 1,434 80 88% 8.1
Registered Nurse 8 25 33 1,344 82 90% 9.9
Speech Language Pathologist 3 2 5 917 71 78% 7.2
Nurse Practitioner 1 0 1 503 63 69% 8
Physical Therapy Aide 3 1 4 458 64 70% 6.8
Qualified Social Worker 2 1 3 445 61 67% 7.3
Physical Therapy Assistant 2 1 3 424 56 62% 7.6
Dental Services Staff 3 0 3 381 65 71% 4.7
Administrator 1 0 1 260 65 71% 4
Respiratory Therapy Technician 2 1 3 196 34 37% 5.1
Occupational Therapy Aide 0 1 1 88 16 18% 5.5
Medical Director 0 1 1 26 13 14% 2
Occupational Therapy Assistant 0 1 1 20 4 4% 4.9
65 Certified Nursing Assistant
% of Days 100%
41 Licensed Practical Nurse
% of Days 100%
7 Other Dietary Services Staff
% of Days 99%
3 RN Director of Nursing
% of Days 88%
33 Registered Nurse
% of Days 90%
5 Speech Language Pathologist
% of Days 78%
1 Nurse Practitioner
% of Days 69%
4 Physical Therapy Aide
% of Days 70%
3 Qualified Social Worker
% of Days 67%
3 Physical Therapy Assistant
% of Days 62%
3 Dental Services Staff
% of Days 71%
1 Administrator
% of Days 71%
3 Respiratory Therapy Technician
% of Days 37%
1 Occupational Therapy Aide
% of Days 18%
1 Medical Director
% of Days 14%
1 Occupational Therapy Assistant
% of Days 4%

Facility Characteristics

Source: CMS Long-Term Care Facility Characteristics (Data as of Jan 2026)

Total residents 53
Medicare
3
5.7% of residents
Medicaid
38
71.7% of residents
Private pay or other
12
22.6% of residents
Programs & Services
Residents Group

Residents meet regularly to discuss policies, care quality, and activities

Active Resident Council

Organized group of residents that meets regularly to discuss facility policies, quality of life, and activities.

Quality of care over time

These measures show how residents usually do over time at this home, based on health outcomes and preventive care.

High-risk clinical events score Info A composite score based on pressure ulcers, falls with injury, weight loss, walking ability decline, and activities of daily living decline. 3.7
37% better than Ohio average

Ohio average: 5.8

Functional decline score Info A composite score based on activities of daily living decline, walking ability decline, and incontinence. 7.1
44% better than Ohio average

Ohio average: 12.7

Long-stay resident measures
Significantly above average Ohio avg: 4.7 Info CMS star rating based on long-stay quality measure performance. 5 stars = significantly above average, 1 star = significantly below average.
Need for Help with Daily Activities Increased Info Percent of long-stay residents whose need for help with daily activities has increased 3.2%
54% better than Ohio average

Ohio average: 6.8%

Walking Ability Worsened Info Percent of long-stay residents whose ability to move independently worsened 5.7%
36% better than Ohio average

Ohio average: 8.9%

Low Risk Residents with Bowel/Bladder Incontinence Info Percent of low risk long-stay residents who lose control of their bowels or bladder 12.5%
43% better than Ohio average

Ohio average: 22.0%

Falls with Major Injury Info Percent of long-stay residents experiencing one or more falls with major injury 4.8%
40% worse than Ohio average

Ohio average: 3.4%

High Risk Residents with Pressure Ulcers Info Percent of long-stay high risk residents with pressure ulcers 1.4%
64% better than Ohio average

Ohio average: 3.9%

Urinary Tract Infection Info Percent of long-stay residents with a urinary tract infection 0.0%
100% better than Ohio average

Ohio average: 0.5%

Lost Too Much Weight Info Percent of long-stay residents who lose too much weight 3.2%
49% better than Ohio average

Ohio average: 6.2%

Depressive Symptoms Info Percent of long-stay residents who have depressive symptoms 37.3%
55% worse than Ohio average

Ohio average: 24.0%

Antipsychotic Use Info Percent of long-stay residents who received an antipsychotic medication 9.6%
14% worse than Ohio average

Ohio average: 8.4%

Pneumococcal Vaccine Info Percent of long-stay residents assessed and appropriately given the pneumococcal vaccine 95.7%
In line with Ohio average

Ohio average: 92.4%

Influenza Vaccine Info Percent of long-stay residents assessed and appropriately given the seasonal influenza vaccine 98.2%
In line with Ohio average

Ohio average: 94.5%

Short-stay resident measures
Pneumococcal Vaccine Info Percent of short-stay residents assessed and appropriately given the pneumococcal vaccine 59.1%
24% worse than Ohio average

Ohio average: 78.0%

Antipsychotic medication increase Info Percent of short-stay residents who newly received an antipsychotic medication 0.0%
100% better than Ohio average

Ohio average: 1.3%

Influenza Vaccine Info Percent of short-stay residents assessed and appropriately given the seasonal influenza vaccine 47.1%
38% worse than Ohio average

Ohio average: 75.6%

Falls with major injury Info Percentage of SNF residents who experience falls with major injury during their stay. 4.2%
442% worse than Ohio average

Ohio average: 0.8%

Penalties and fines

Federal penalties imposed by CMS for regulatory violations, including civil money penalties (fines) and denials of payment for new Medicare/Medicaid admissions.

Source: CMS Penalties Database (Data as of Jan 2026)

Total fines amount $31K
54% lower than Ohio average

Ohio average: $69K

Number of fines 3
62% more fines than Ohio average

Ohio average: 1.9

Payment Denials Info Serious action where Medicare and/or Medicaid temporarily stops payments for new residents until issues are fixed. 1
86% more payment denials than Ohio average

Ohio average: 0.5

Fines amount comparison
This facility $31K
Ohio average $69K
Penalty History

Penalties are imposed by CMS for violations of federal nursing home regulations.

1 penalty in the past 3 years

Jan 9, 2025 · $17K

Civil Money Penalty Info Fines imposed for noncompliance, which can be assessed per day or per instance of violation. Jan 9, 2025
$17K

Last updated: Jan 2026

Compare Independent Living around Ohio The information below is reported by the Ohio Department of Health, Bureau of Survey and Certification.

Filter by care type
The Knolls of Oxford
NH

Nursing Home Licensed facility providing 24/7 skilled nursing care for residents with complex, ongoing medical needs. Staffed by RNs, LPNs, and CNAs. Inspected and star-rated annually by CMS. Accepts Medicare (short-term rehab) and Medicaid (long-term care).

AL

Assisted Living A licensed, long-term care setting for seniors or individuals with disabilities who need help with daily activities — like bathing, dressing, and medication management — but not 24-hour skilled nursing. Offers housing, meals, and around-the-clock support while aiming to maximize resident independence.

Oxford 57 Yes 0 Private / 1 Bed / 2 Bed / 3 Bed Rooms - - 92 4
Heritage Senior Living of Plain City
AL

Assisted Living A licensed, long-term care setting for seniors or individuals with disabilities who need help with daily activities — like bathing, dressing, and medication management — but not 24-hour skilled nursing. Offers housing, meals, and around-the-clock support while aiming to maximize resident independence.

IL

Independent Living Lifestyle-focused communities for older adults offering dining, activities, and transportation with minimal personal care. Best for active, independent seniors who want community without medical support.

MC

Memory Care Secured, specialized care for people living with Alzheimer's or dementia. Staff trained in cognitive impairment, with higher staff-to-resident ratios and an environment designed to reduce confusion and wandering risk.

Plain City 56 No 16 - - Number Of Years In Long Term Care 83 1
The Merriman
AL

Assisted Living A licensed, long-term care setting for seniors or individuals with disabilities who need help with daily activities — like bathing, dressing, and medication management — but not 24-hour skilled nursing. Offers housing, meals, and around-the-clock support while aiming to maximize resident independence.

NH

Nursing Home Licensed facility providing 24/7 skilled nursing care for residents with complex, ongoing medical needs. Staffed by RNs, LPNs, and CNAs. Inspected and star-rated annually by CMS. Accepts Medicare (short-term rehab) and Medicaid (long-term care).

Akron (Highland Square) 55 No 70 - - - - 0
Sunrise of Gahanna
AL

Assisted Living A licensed, long-term care setting for seniors or individuals with disabilities who need help with daily activities — like bathing, dressing, and medication management — but not 24-hour skilled nursing. Offers housing, meals, and around-the-clock support while aiming to maximize resident independence.

HC

Home Care Professional care delivered in the person's own home — from companionship and errands to skilled nursing and therapy. Allows seniors to age in place. Medicare covers skilled home health when medically necessary.

MC

Memory Care Secured, specialized care for people living with Alzheimer's or dementia. Staff trained in cognitive impairment, with higher staff-to-resident ratios and an environment designed to reduce confusion and wandering risk.

Gahanna (East Johnstown Road) - Yes 36 - A- - - 0
Inniswood Village National Church Residences
AL

Assisted Living A licensed, long-term care setting for seniors or individuals with disabilities who need help with daily activities — like bathing, dressing, and medication management — but not 24-hour skilled nursing. Offers housing, meals, and around-the-clock support while aiming to maximize resident independence.

IL

Independent Living Lifestyle-focused communities for older adults offering dining, activities, and transportation with minimal personal care. Best for active, independent seniors who want community without medical support.

MC

Memory Care Secured, specialized care for people living with Alzheimer's or dementia. Staff trained in cognitive impairment, with higher staff-to-resident ratios and an environment designed to reduce confusion and wandering risk.

Westerville (Central College) - No 14 - - - - 0

Guides for Better Senior Living

Care Cost Calculator: See Prices in Your Area

Nursing Home Data Explorer

Don’t Wait Too Long: 7 Red Flag Signs Your Parent Needs Assisted Living Now

The True Cost of Assisted Living in 2025 – And How Families Are Paying For It

Understanding Senior Living Costs: Pricing Models, Discounts & Financial Assistance

Explore Open Rooms
1 Contact details
2 What type of senior care service are you looking for?
3 What budget do you have in mind for senior care?
4 How soon do you need to find care?
5 Additional details

Thank you for your interest!

Our team will be in touch shortly to help with next steps.