Explore Open Rooms

1 Contact details
2 What type of senior care service are you looking for?
3 What budget do you have in mind for senior care?
4 How soon do you need to find care?
5 Additional details

Thank you for your interest!

Our team will be in touch shortly to help with next steps.

Assisted Living Home

The Chateau at Sharmar Village

Assisted Living Home

The Chateau at Sharmar Village

1201 W Abriendo Ave, Pueblo, CO 81004 View map
Overview of The Chateau at Sharmar Village

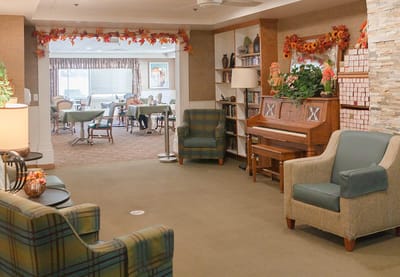
Entering an assisted living community doesn’t mean you have to sacrifice your independence and autonomy. At Sharmar Village’s The Chateau, their professional and friendly staff collaborates with each resident to ensure that they receive the helping hand they need and want. This allows seniors to choose the level of assistance they’d prefer, ranging from full supervision such as bathing and dressing, to minimal assistance with housekeeping here and there, alongside medical management.

This grants seniors in need of assisted living homes in Pueblo, Colorado,  a better sense of fulfillment and independence in their golden years, allowing them to invest their time in relaxation, recreation, and socialization among fellow residents.

Quality ratings

Measured by Centers for Medicare & Medicaid Services (CMS)

Overall rating Info The Overall CMS Rating combines results from health inspections, staffing levels and quality measures. Health inspections carry the most weight. Staffing and quality scores can increase or decrease the final rating based on performance compared to state and national standards.
3/5
Colorado average: 3.2/5
Health Inspection Info Based on the results of the facility's three most recent standard inspections and any complaint investigations. CMS reviews the number, scope, and severity of deficiencies, with more recent findings weighted more heavily.
2/5
Colorado average: 2.8/5
Staffing Info Measures average nursing staff hours per resident per day, including Registered Nurses (RNs) and total nursing staff. Ratings are adjusted based on the level of care residents require and are compared to state and national benchmarks.
3/5
Colorado average: 3.1/5
Quality Measures Info Based on clinical and physical health indicators reported to CMS, such as hospital readmissions, falls, pressure ulcers, and improvements in mobility. These measures reflect how well residents' health needs are being managed.
5/5
Colorado average: 4.1/5

Nursing care per resident

Info This shows how many total hours of nursing staff time are available per resident each day. Higher numbers usually mean more staff support.
3h 25m per day

This home provides 11% less nursing time per resident than the Colorado average.

Colorado average: 3h 51m per day

Capacity and availability

Smaller home

May offer a more intimate, personalized care environment.

Total beds 87

This home usually has availability

Lower occupancy suggests more openings may be available.

Lower demand than the Colorado average
Occupancy rate 70.4%
Residents per day (avg) 48
Occupancy rate
70.4%
Residents per day (avg)
48

Who this home usually serves

TYPE OF STAY

Mix of rehab and long-term care

This home supports both short-term rehab and long-term care, with residents staying for a wide range of durations.

Breakdown by payment type

Medicare

29% of new residents, usually for short-term rehab.

Typical stay 24 days

Private pay

55% of new residents, often for short stays.

Typical stay 3 months

Medicaid

16% of new residents, often for long-term daily care.

Typical stay 1 - 2 years

Finances and operations

Privately-owned community
Operated by a business corporation.
Home revenue
$7.1M
Profit
$211.6K
Privately-owned community Operated by a business corporation.
Home revenue
$7,067,584.00
Profit
$211,581.00
Payroll costs Info The portion of the home's budget spent on staff, including nurses, caregivers, and other employees who support care and operations.
$2.8M
39.8% of revenue
Other operating costs Info All remaining costs needed to run the home, such as food, utilities, building maintenance, supplies and administrative expenses.
$4.0M
Total costs $6.9M
Bed community size
87-bed community
A larger shared setting that may offer more common spaces and organized community services.
Walk Score
Walk Score: 22 / 100
Car-dependent. Most errands require a car, with limited nearby walkable options.
BBB Rating
BBB Rating: A+ (Not Accredited)
An independent rating from the Better Business Bureau based on factors such as complaint history, transparency, and business practices.
How BBB ratings work

About this community

License details

Status Active

Ownership & operating entity

The Chateau at Sharmar Village is administrated by Sykes, Lisa.

Owner: CONTINUUM AT CHATEAU INC

What does this home offer?

Housing options icon

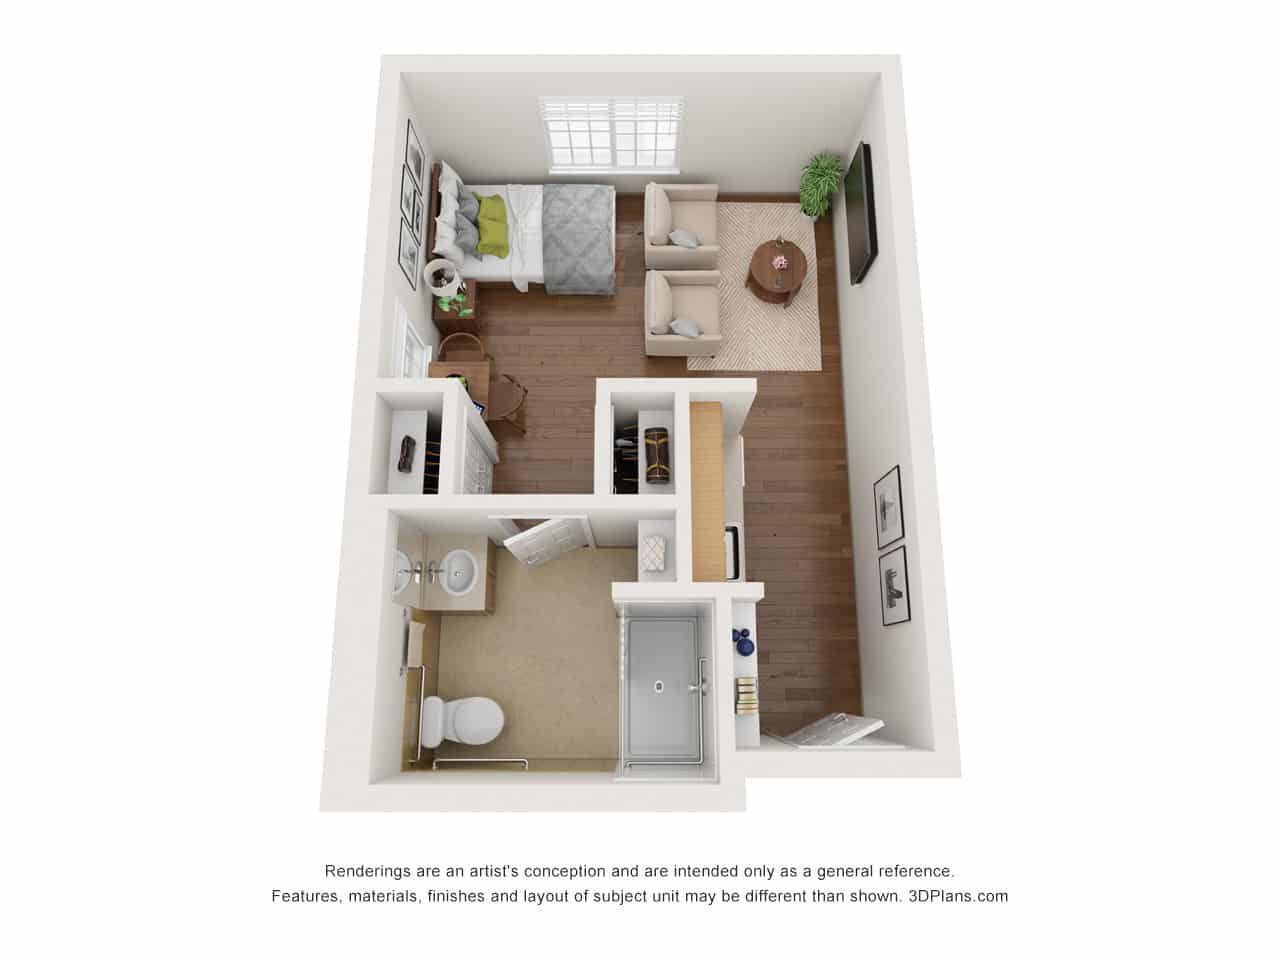
Housing Options: Private Rooms

Building type icon
Building type icon

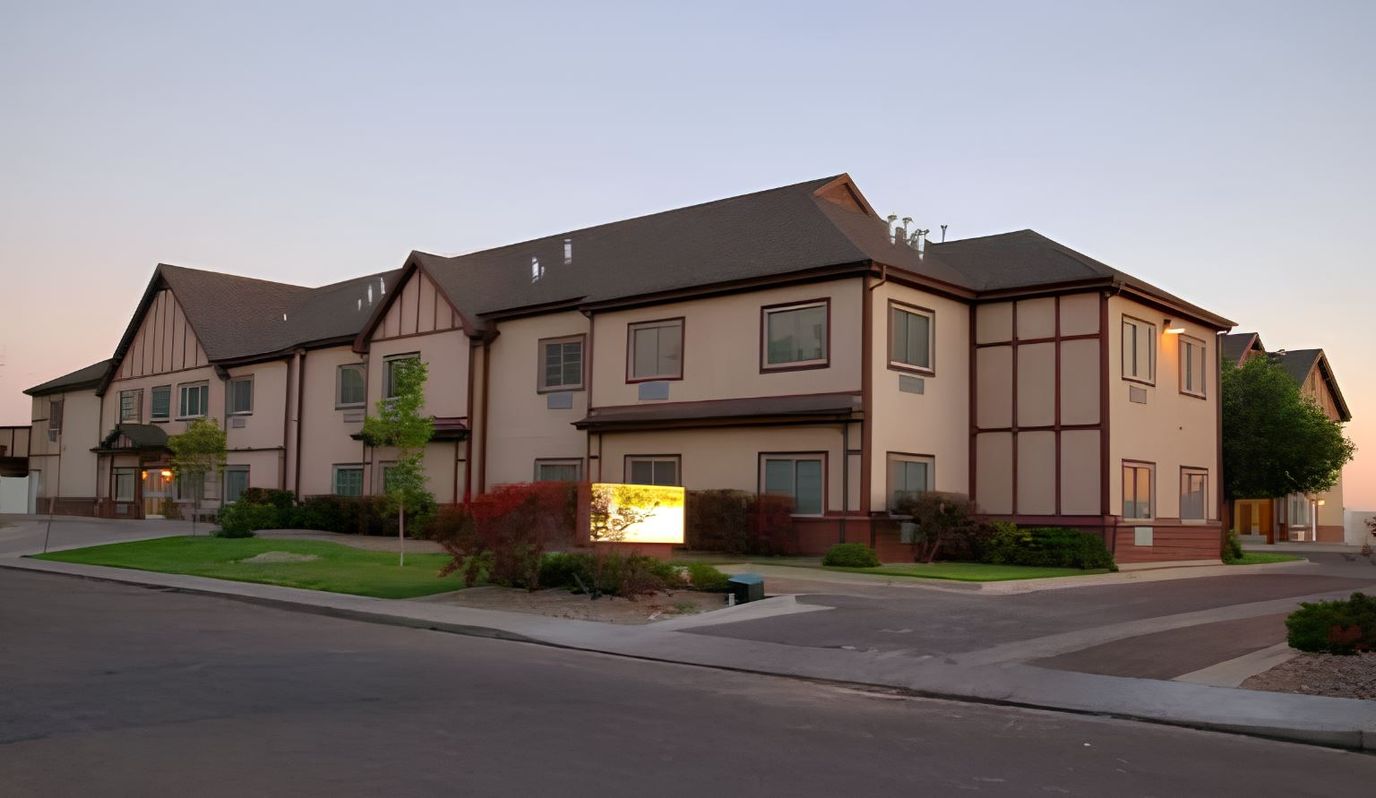
Building Type: Two-story

Transportation services icon

Transportation Services

Fitness and recreation icon

Fitness and Recreation
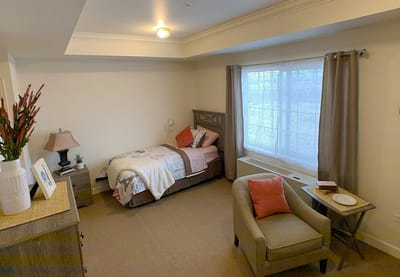
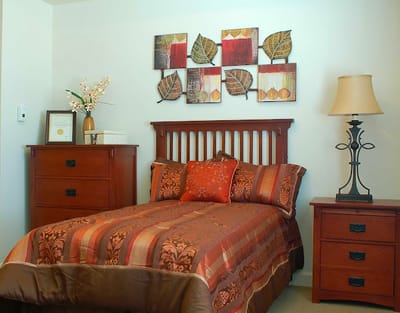
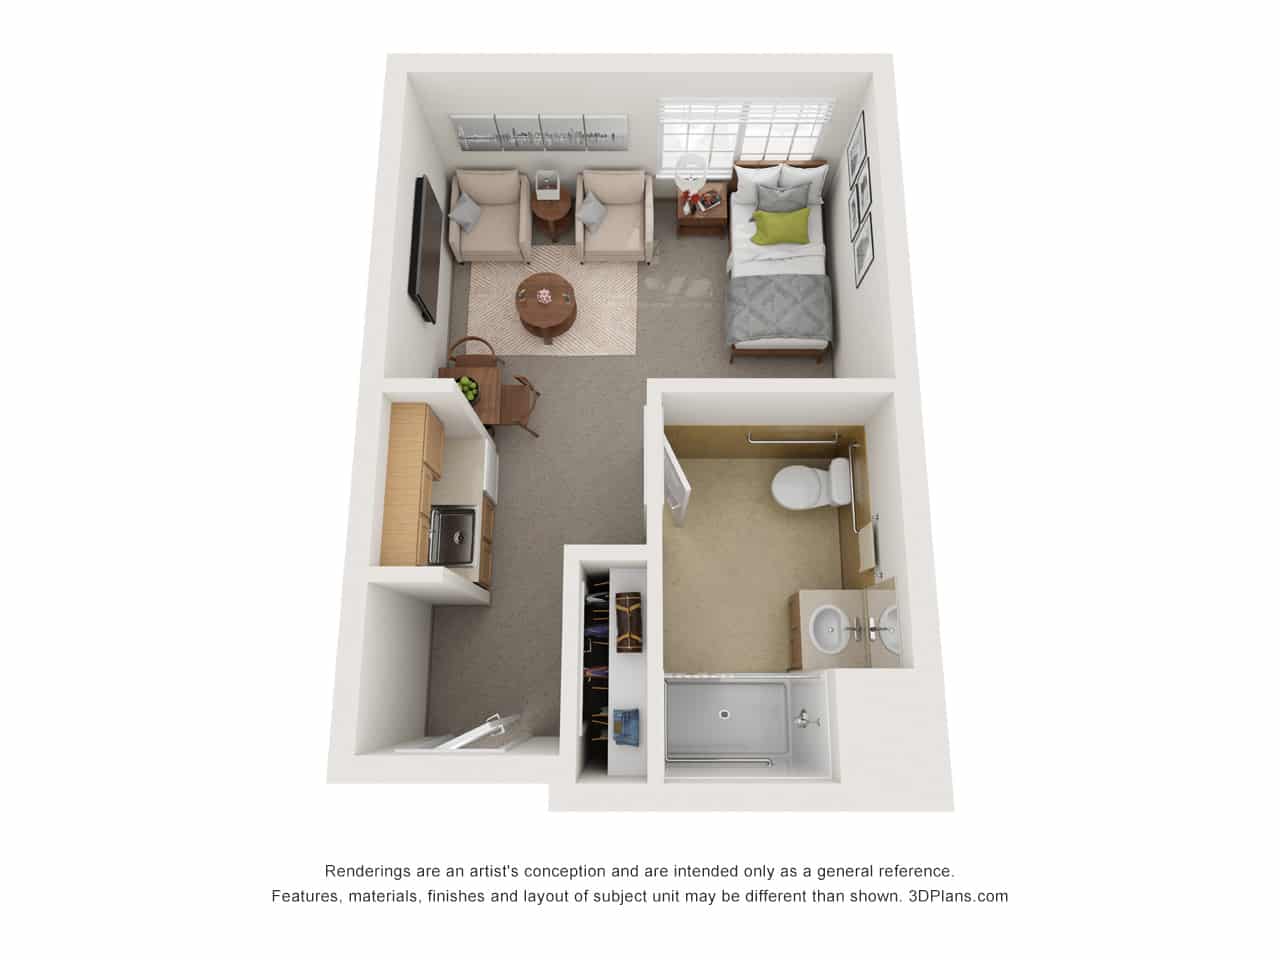
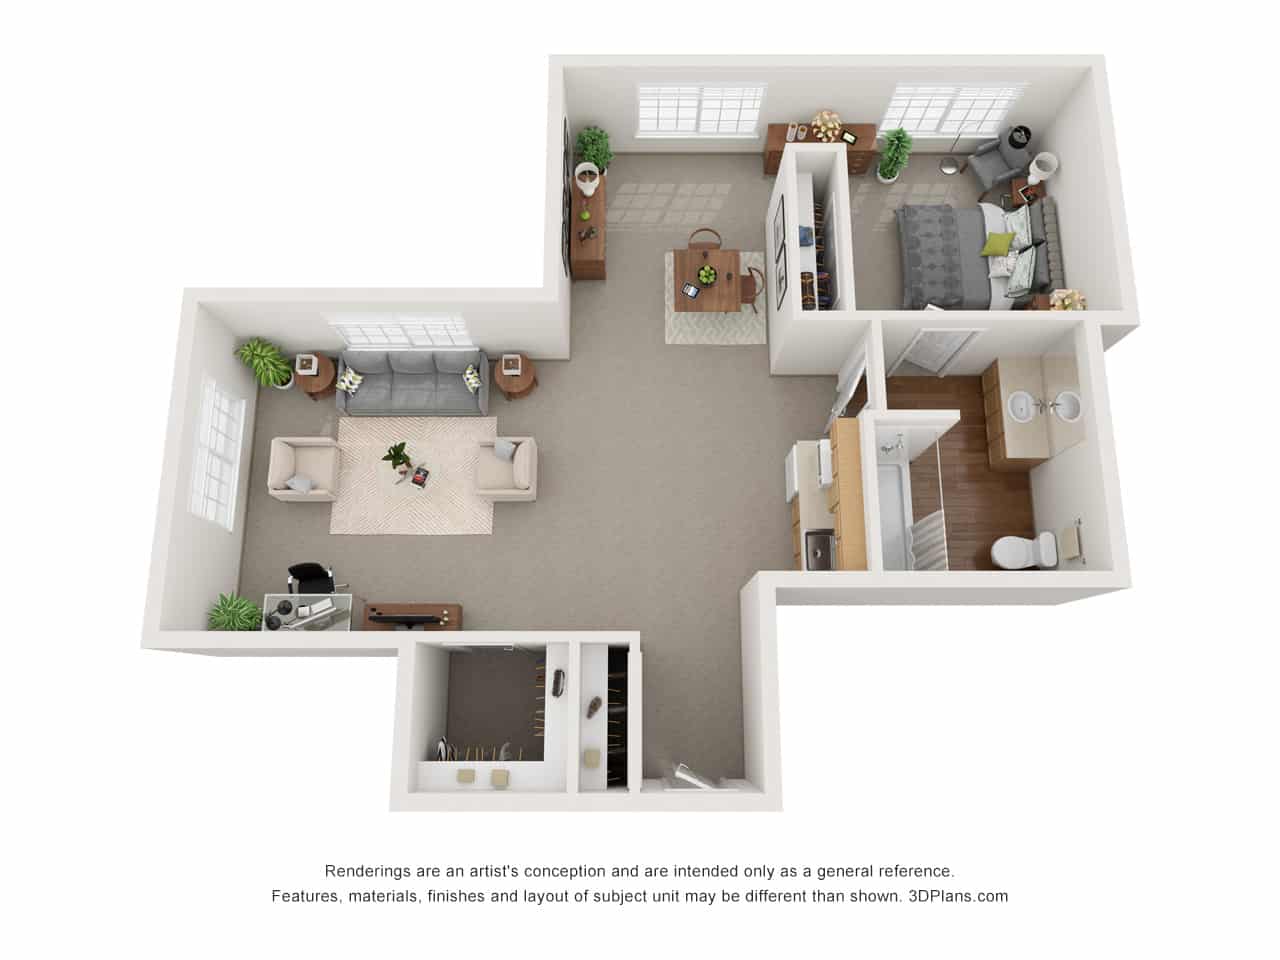
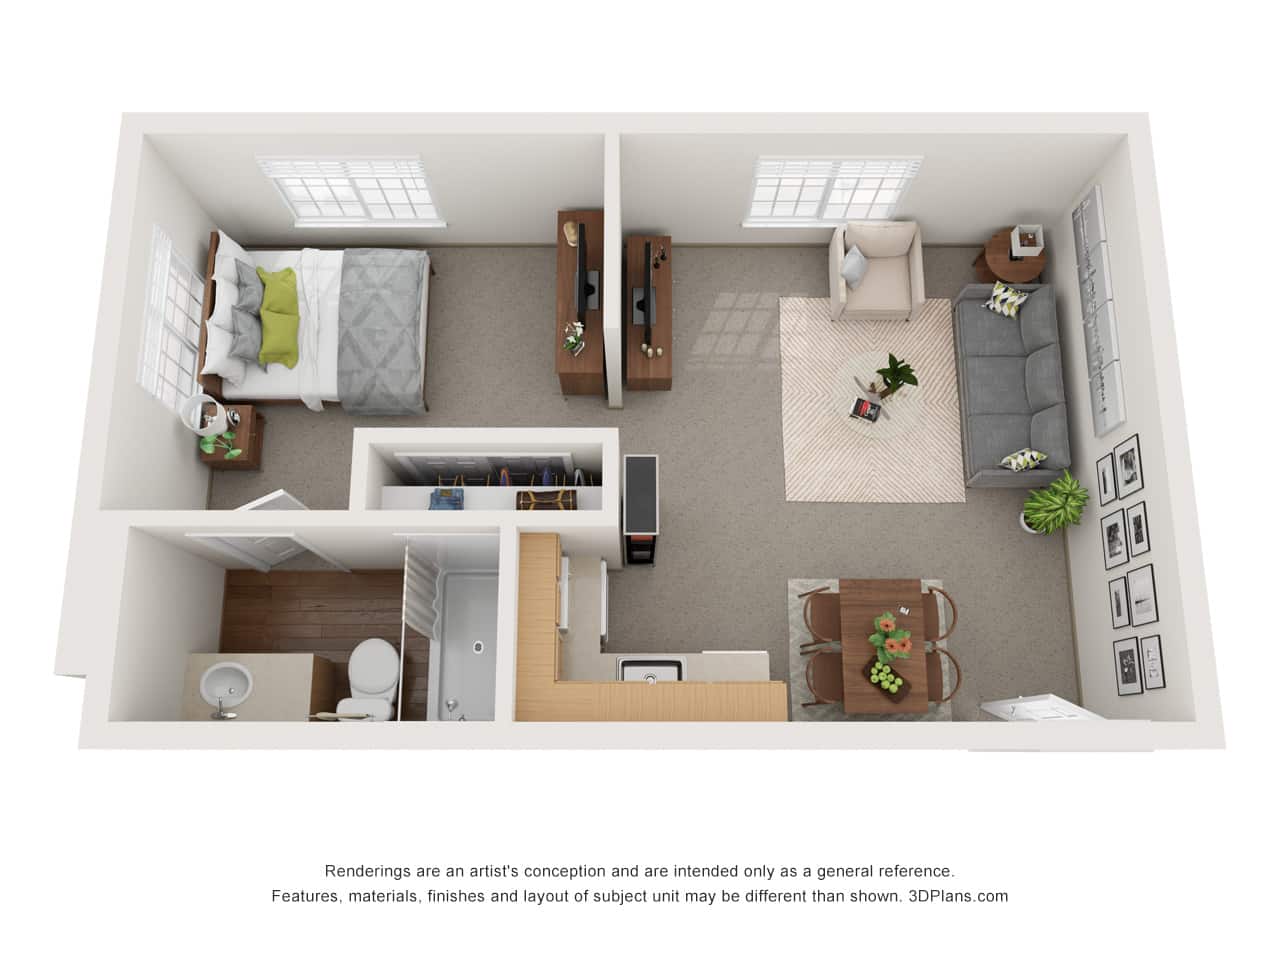
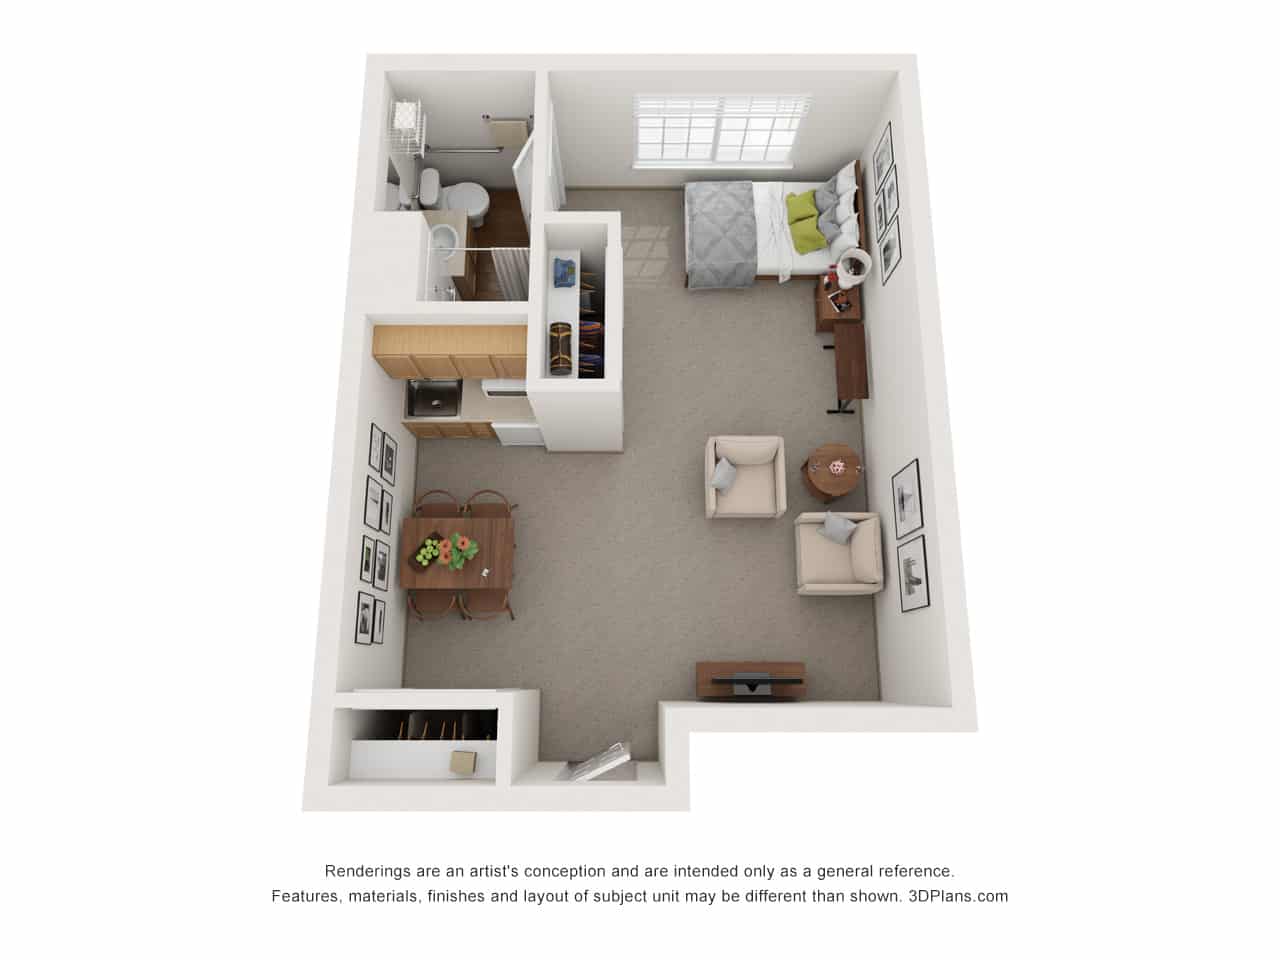
Types of Care at The Chateau at Sharmar Village

Assisted Living Independent Living Memory Care
Contact The Chateau at Sharmar Village

Access & Eligibility

Ways to qualify for care at this community, including accepted programs and payment options.

Payment & Funding Options

Private pay

Health Inspection History

Inspections
Total health inspections 5

Colorado average 4.8


Last Health inspection on Aug 2025

Total health citations 33

Colorado average 24.8

Citations per inspection
6.6

Colorado average 5.2


Health citations are formal notices following inspections when they fail to comply with safety and care standards.

25 of 33 citations resulted from standard inspections; 7 of 33 resulted from complaint investigations; and 1 of 33 came from combined inspections (standard and complaint).

Breakdown of citation severity (last 3 years)
Critical Health citations More info 1
150% worse than Colorado average

Colorado average: 0.4


Serious Health citations More info 5
138% worse than Colorado average

Colorado average: 2.1

1 critical citation More info Colorado average: 0.4

5 serious citations More info Colorado average: 2.1

27 moderate citations More info Colorado average: 22.2

0 minor citations More info Colorado average: 0.2
Citations history (last 3 years)
Nutrition moderate citation Info Issues related to food quality, meal service, and resident's nutritional needs. Aug 11, 2025
Corrected

Quality of Care moderate citation Info Issues related to how well residents receive appropriate treatment and support for their medical and daily care needs. Aug 11, 2025
Corrected

Quality of Care moderate citation Info Issues related to how well residents receive appropriate treatment and support for their medical and daily care needs. Aug 11, 2025
Corrected

Quality of Care serious citation Info Issues related to how well residents receive appropriate treatment and support for their medical and daily care needs. Aug 11, 2025
Corrected

Compare Assisted Living around Pueblo The information below is reported by the Colorado Department of Public Health and Environment, Health Facilities Division.

Bonaventure of Pueblo
AL

Assisted Living A licensed, long-term care setting for seniors or individuals with disabilities who need help with daily activities — like bathing, dressing, and medication management — but not 24-hour skilled nursing. Offers housing, meals, and around-the-clock support while aiming to maximize resident independence.

IL

Independent Living Lifestyle-focused communities for older adults offering dining, activities, and transportation with minimal personal care. Best for active, independent seniors who want community without medical support.

MC

Memory Care Secured, specialized care for people living with Alzheimer's or dementia. Staff trained in cognitive impairment, with higher staff-to-resident ratios and an environment designed to reduce confusion and wandering risk.

Pueblo (Hyde Park)
106
Yes
A+
7
1 Bed / 2 Bed
The Chateau at Sharmar Village
NH

Nursing Home Licensed facility providing 24/7 skilled nursing care for residents with complex, ongoing medical needs. Staffed by RNs, LPNs, and CNAs. Inspected and star-rated annually by CMS. Accepts Medicare (short-term rehab) and Medicaid (long-term care).

AL

Assisted Living A licensed, long-term care setting for seniors or individuals with disabilities who need help with daily activities — like bathing, dressing, and medication management — but not 24-hour skilled nursing. Offers housing, meals, and around-the-clock support while aiming to maximize resident independence.

Pueblo (Aberdeen)
59
No
A+
22
Private Rooms
Bluegrass Homecare LLC
AL

Assisted Living A licensed, long-term care setting for seniors or individuals with disabilities who need help with daily activities — like bathing, dressing, and medication management — but not 24-hour skilled nursing. Offers housing, meals, and around-the-clock support while aiming to maximize resident independence.

PUEBLO
32
No
-
-
Private Rooms
Eddie’s House LLC
AL

Assisted Living A licensed, long-term care setting for seniors or individuals with disabilities who need help with daily activities — like bathing, dressing, and medication management — but not 24-hour skilled nursing. Offers housing, meals, and around-the-clock support while aiming to maximize resident independence.

Pueblo (Bessemer)
14
No
-
57
Private Rooms
Brookdale Senior Living – El Camino
AL

Assisted Living A licensed, long-term care setting for seniors or individuals with disabilities who need help with daily activities — like bathing, dressing, and medication management — but not 24-hour skilled nursing. Offers housing, meals, and around-the-clock support while aiming to maximize resident independence.

Pueblo (Highland Park)
-
Yes
-
42
Studio / 1 Bed / 2 Bed

Living Spaces & Floor Plans

The Chateau At Sharmar Village Plan 5
The Chateau At Sharmar Village Plan 4
The Chateau At Sharmar Village Plan 3
The Chateau At Sharmar Village Plan 2
The Chateau At Sharmar Village Plan 1

Places of interest near The Chateau at Sharmar Village

Address 1.9 miles from city center — 1.17 miles to nearest hospital (Stephanie Payne, DO | Family Doctor)

Address 1201 W Abriendo Ave, Pueblo, CO 81004

Calculate Travel Distance to The Chateau at Sharmar Village

Add your location

Address

Staffing Data (Q2 2025)

This data corresponds to Q2 2025 and is based on CMS Payroll-Based Journal.

Total staff 147
Employees 70
Contractors 77
Staff to resident ratio 3.06:1
61% better than Colorado average

Colorado average ratio: 1.91:1

Avg staff/day 29
Average shift 7.6 hours
8% worse than Colorado average

Colorado average: 8.3 hours

Total staff hours (quarter) 20,105
Nursing staff breakdown
Registered Nurse

Manages medical care and health needs.

Total count 21
Average shift length Info Average shift length. Calculated as total hours divided by days worked and average staff per day. 10.4 hours

This role is partially covered by contractors.

Licensed Practical Nurse

Assists with medical care and medications.

Total count 6
Average shift length Info Average shift length. Calculated as total hours divided by days worked and average staff per day. 7.3 hours

This role is partially covered by contractors.

Certified Nursing Assistant

Helps with daily care and mobility.

Total count 91
Average shift length Info Average shift length. Calculated as total hours divided by days worked and average staff per day. 8.5 hours

This role is partially covered by contractors.

Contractor staffing

Total hours from contractors

15.5%

3,111 contractor hours this quarter

Certified Nursing Assistant: 50 Registered Nurse: 6 Speech Language Pathologist: 4 Physical Therapy Aide: 4 Respiratory Therapy Technician: 3 Physical Therapy Assistant: 2 Licensed Practical Nurse: 2 Occupational Therapy Assistant: 2 Mental Health Service Worker: 1 Medical Director: 1 Occupational Therapy Aide: 1 Qualified Social Worker: 1
Staff by category
Certified Nursing Assistant41509110,48491100%8.5
Registered Nurse156214,10091100%10.4
Other Dietary Services Staff4048198796%6.8
Physical Therapy Aide0447768897%5
Clinical Nurse Specialist2027406167%7.9
Nurse Practitioner1015206571%8
Dietitian1015046369%8
Mental Health Service Worker1124926066%8
Administrator1014846167%7.9
Speech Language Pathologist0444447582%3
Licensed Practical Nurse4264265156%7.3
Occupational Therapy Aide011811618%5.1
Physical Therapy Assistant022795055%1.6
Respiratory Therapy Technician033733741%2
Occupational Therapy Assistant022451213%3.7
Medical Director011242426%1
Qualified Social Worker011151112%1.3
91 Certified Nursing Assistant
% of Days 100%
21 Registered Nurse
% of Days 100%
4 Other Dietary Services Staff
% of Days 96%
4 Physical Therapy Aide
% of Days 97%
2 Clinical Nurse Specialist
% of Days 67%
1 Nurse Practitioner
% of Days 71%
1 Dietitian
% of Days 69%
2 Mental Health Service Worker
% of Days 66%
1 Administrator
% of Days 67%
4 Speech Language Pathologist
% of Days 82%
6 Licensed Practical Nurse
% of Days 56%
1 Occupational Therapy Aide
% of Days 18%
2 Physical Therapy Assistant
% of Days 55%
3 Respiratory Therapy Technician
% of Days 41%
2 Occupational Therapy Assistant
% of Days 13%
1 Medical Director
% of Days 26%
1 Qualified Social Worker
% of Days 12%

Facility Characteristics

Source: CMS Long-Term Care Facility Characteristics (Data as of Jan 2026)

Total census
48 residents
Residents by payment source
Medicare
5 residents (10.4%)
Medicaid
30 residents (62.5%)
Private pay or other
13 residents (27.1%)
Programs & Services
Residents' Group

Residents meet regularly to discuss policies, care quality, and activities

CCRC

Part of a Continuing Care Retirement Community offering multiple care levels

Active Resident Council

Organized group of residents that meets regularly to discuss facility policies, quality of life, and activities.

Quality of care over time

These measures show how residents usually do over time at this home, based on health outcomes and preventive care.

High-risk clinical events score Info A composite score based on pressure ulcers, falls with injury, weight loss, walking ability decline, and activities of daily living decline. 7.5
17% better than Colorado average

Colorado average: 9.0

Functional decline score Info A composite score based on activities of daily living decline, walking ability decline, and incontinence. 16.5
12% better than Colorado average

Colorado average: 18.8

Long-stay resident measures
Need for Help with Daily Activities Increased Info Percent of long-stay residents whose need for help with daily activities has increased 10.6%
34% better than Colorado average

Colorado average: 16.0%

Walking Ability Worsened Info Percent of long-stay residents whose ability to move independently worsened 13.0%
24% better than Colorado average

Colorado average: 17.0%

Low Risk Residents with Bowel/Bladder Incontinence Info Percent of low risk long-stay residents who lose control of their bowels or bladder 26.0%
12% worse than Colorado average

Colorado average: 23.2%

Falls with Major Injury Info Percent of long-stay residents experiencing one or more falls with major injury 2.5%
26% better than Colorado average

Colorado average: 3.3%

High Risk Residents with Pressure Ulcers Info Percent of long-stay high risk residents with pressure ulcers 3.9%
In line with Colorado average

Colorado average: 3.9%

Urinary Tract Infection Info Percent of long-stay residents with a urinary tract infection 0.6%
56% better than Colorado average

Colorado average: 1.4%

Lost Too Much Weight Info Percent of long-stay residents who lose too much weight 7.6%
46% worse than Colorado average

Colorado average: 5.2%

Depressive Symptoms Info Percent of long-stay residents who have depressive symptoms 7.7%
7% worse than Colorado average

Colorado average: 7.2%

Antipsychotic Use Info Percent of long-stay residents who received an antipsychotic medication 17.5%
7% better than Colorado average

Colorado average: 18.8%

Pneumococcal Vaccine Info Percent of long-stay residents assessed and appropriately given the pneumococcal vaccine 88.2%
5% worse than Colorado average

Colorado average: 93.3%

Influenza Vaccine Info Percent of long-stay residents assessed and appropriately given the seasonal influenza vaccine 88.9%
6% worse than Colorado average

Colorado average: 94.7%

Short-stay resident measures
Pneumococcal Vaccine Info Percent of short-stay residents assessed and appropriately given the pneumococcal vaccine 41.2%
46% worse than Colorado average

Colorado average: 76.6%

Antipsychotic medication increase Info Percent of short-stay residents who newly received an antipsychotic medication 0.0%
100% better than Colorado average

Colorado average: 1.4%

Influenza Vaccine Info Percent of short-stay residents assessed and appropriately given the seasonal influenza vaccine 68.2%
10% worse than Colorado average

Colorado average: 75.6%

Penalties and fines

Federal penalties imposed by CMS for regulatory violations, including civil money penalties (fines) and denials of payment for new Medicare/Medicaid admissions.

Source: CMS Penalties Database (Data as of Jan 2026)

Total fines amount $80K
101% higher than Colorado average

Colorado average: $40K

Number of fines 4
80% more fines than Colorado average

Colorado average: 2.2

Payment Denials Info Serious action where Medicare and/or Medicaid temporarily stops payments for new residents until issues are fixed. 0
100% fewer payment denials than Colorado average

Colorado average: 0.3

Fines amount comparison
This facility $80K
Colorado average $40K
Penalty History

Penalties are imposed by CMS for violations of federal nursing home regulations.

Civil Money Penalty Info Fines imposed for noncompliance, which can be assessed per day or per instance of violation. Aug 11, 2025
$19K
Civil Money Penalty Info Fines imposed for noncompliance, which can be assessed per day or per instance of violation. Feb 27, 2025
$33K
Civil Money Penalty Info Fines imposed for noncompliance, which can be assessed per day or per instance of violation. Apr 1, 2024
$12K
Civil Money Penalty Info Fines imposed for noncompliance, which can be assessed per day or per instance of violation. Aug 14, 2023
$15K

Last updated: Jan 2026

Guides for Better Senior Living

Care Cost Calculator: See Prices in Your Area

Nursing Home Data Explorer

Don’t Wait Too Long: 7 Red Flag Signs Your Parent Needs Assisted Living Now

The True Cost of Assisted Living in 2025 – And How Families Are Paying For It

Understanding Senior Living Costs: Pricing Models, Discounts & Financial Assistance

Financial Aid for Colorado Seniors

Get financial aid guidance

Elderly, Blind, and Disabled Waiver

Colorado Medicaid EBD Waiver

Age 65+ or disabled, Colorado resident, Medicaid- eligible, nursing home-level care need.

~$2,829/month (300% FBR, individual).

$2,000 (individual), $3,000 (couple).

Requires level-of-care assessment by case manager.

Old Age Pension (OAP) Health Care Program

Colorado OAP

Age 60+, Colorado resident.

~$1,215/month (individual).

$2,000 (individual).

Supplements SSI; limited medical coverage.

Program of All-Inclusive Care for the Elderly (PACE)

Colorado Medicaid PACE

Age 55+, Colorado resident, nursing home-level care need, safe with PACE support.

~$2,829/month (300% FBR).

$2,000 (individual), $3,000 (couple).

Limited to specific regions (e.g., Denver, Pueblo).

Home Care Allowance (HCA)

Colorado Home Care Allowance (HCA)

Seniors typically 65+, Age 5+ with disability, Colorado resident, financial/functional need.

~$1,004/month (individual, stricter than waivers).

$2,000 (individual), $3,000 (couple).

Must need help with ADLs; not Medicaid-waiver eligible.

Senior Community Service Employment Program (SCSEP)

Colorado SCSEP (federally funded, state-administered)

Age 55+, unemployed, low-income, Colorado resident.

~$1,983/month (125% FPL, individual).

Not specified; income-focused.

Priority for veterans, rural residents.