Sunset Home Assisted Living

Assisted Living in Illinois

CMS overall rating Info The Overall CMS Rating is scored from 1 to 5 stars and combines results from health inspections, staffing levels, and quality measures. Health inspections carry the most weight. Staffing and quality scores can increase or decrease the final rating based on performance compared to state and national standards.
Calculator: See prices in your area
Sunset Home Assisted Living accepts Medicare, Medicaid, and private pay.

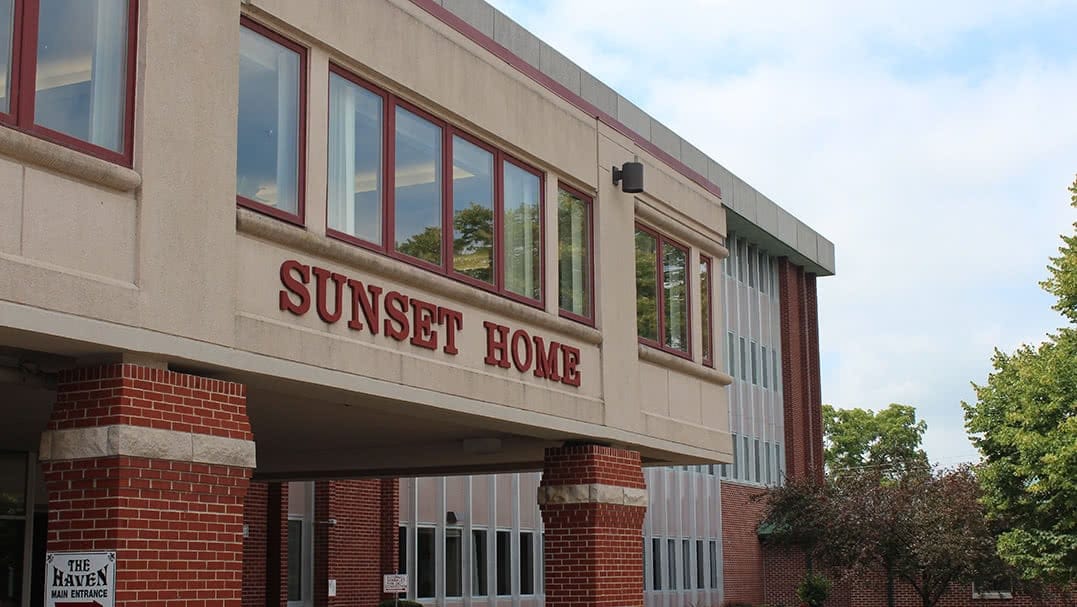
Overview of Sunset Home Assisted Living

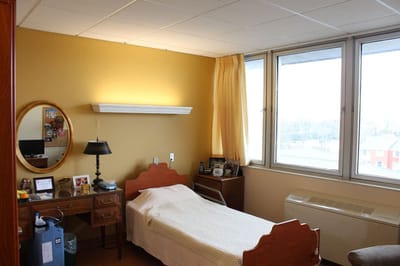
Nestled gracefully in Quincy, Illinois, Sunset Home Assisted Living provides support that nurtures residents’ independence while ensuring they receive the necessary assistance. Their focus extends beyond physical care to encompass social and emotional needs of seniors. This community boasts a range of living options, including 18 apartments, with studios and one-bedroom units designed to be handicap accessible. Each apartment is also equipped with private bathrooms featuring walk-in showers, as well as kitchenettes for added convenience.

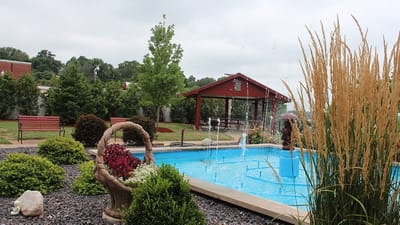
Sunset Home Assisted Living takes pride in its meticulous housekeeping and laundry services, maintaining a spotless and well-organized environment. Residents can even enjoy Wi-Fi connectivity, and the on-site therapy services offer physical, occupational, and speech therapy for those who need it. Furthermore, the facility houses a beauty and barber salon with affordable prices to cater to residents’ grooming needs. Outdoors, a courtyard provides a picturesque setting for various activities, including picnics and cookouts, creating a vibrant community for its residents.

Quality ratings

Measured by Centers for Medicare & Medicaid Services (CMS)

Overall rating Info The Overall CMS Rating combines results from health inspections, staffing levels and quality measures. Health inspections carry the most weight. Staffing and quality scores can increase or decrease the final rating based on performance compared to state and national standards.
1/5 ▼ 2.2 Illinois average: 3.2/5
Health Inspection Info Based on the results of the facility's three most recent standard inspections and any complaint investigations. CMS reviews the number, scope, and severity of deficiencies, with more recent findings weighted more heavily.
1/5 ▼ 2.0 Illinois average: 3.0/5
Staffing Info Measures average nursing staff hours per resident per day, including Registered Nurses (RNs) and total nursing staff. Ratings are adjusted based on the level of care residents require and are compared to state and national benchmarks.
3/5 ▼ 0.3 Illinois average: 3.3/5
Quality Measures Info Based on clinical and physical health indicators reported to CMS, such as hospital readmissions, falls, pressure ulcers, and improvements in mobility. These measures reflect how well residents' health needs are being managed.
2/5 ▼ 1.2 Illinois average: 3.2/5

Staffing hours breakdown

Info Daily nursing hours per resident by staff type, reported to CMS. Higher is generally better — compare this facility to state and national averages to see where staffing stands.

Hours per resident per day — compared to Illinois state averages

Total nursing care / resident Info This home is ranked 35th out of 122 homes in Illinois.

Total adjusted nursing hours per resident per day, combining RN, LPN, and aide time. CMS adjusts this for case-mix so facilities can be fairly compared.
4h 22m per day
Rank #35 / 122Nurse hours — state benchmarkedThis home is ranked 35th out of 122 homes in Illinois.Shows adjusted nurse hours per resident per day benchmarked to the Illinois average, with a ranking across 122 Illinois SNFs. More hours mean more direct care. The national average is about 3.5 hrs; below 3.0 is a red flag.
This facility Illinois avg (3h 57m per day)
vs Illinois avg
+11%
Staff typeHours / dayvs state avg
Total Nursing (Weekend) Info Combined nursing hours (RN + LPN + Nurse Aide) per resident per day on weekends. Staffing often drops on weekends — this figure reveals whether the facility maintains adequate coverage outside of weekday hours. 3h 45m per day

Capacity and availability

This home usually has availability

Occupancy lower than 85% suggests more openings may be available.

Higher occupancy than the Illinois average: 69.3%
Occupancy rate 77.8% Rank #52 / 122Occupancy rate — state benchmarkedThis home is ranked 52nd out of 122 homes in Illinois.Shows this facility's occupancy rate versus the Illinois average, with its statewide rank out of 122. Higher occupancy signals strong local demand and financial stability.
Avg. Length of Stay 127 days
Occupancy rate
77.8% Rank #52 / 122Occupancy rate — state benchmarkedThis home is ranked 52nd out of 122 homes in Illinois.Shows this facility's occupancy rate versus the Illinois average, with its statewide rank out of 122. Higher occupancy signals strong local demand and financial stability.
Avg. Length of Stay
127 days

Who this home usually serves

TYPE OF STAY

Mostly short-term rehab stays

Most residents typically stay for a few weeks or months before returning home or moving on.

Breakdown by payment type

Medicare

76% of new residents, usually for short-term rehab.

Typical stay 17 days

Private pay

14% of new residents, often for short stays.

Typical stay 8 - 9 months

Medicaid

11% of new residents, often for long-term daily care.

Typical stay 1 - 2 years

Finances and operations

Voluntary non-profit community
Operated by a church.
Home revenue
$11.6M
Operating deficit
-$740.5K
Voluntary non-profit community Operated by a church.
Home revenue
$11.6M Rank #102 / 120Revenue — state benchmarkedThis home is ranked 102nd out of 120 homes in Illinois.Shows this facility's annual revenue compared to the Illinois SNF average. Higher revenue generally means more resources for staffing and capital — read alongside Payroll %.
Operating deficit
-$740.5K
Payroll costs Info The portion of the home's budget spent on staff, including nurses, caregivers, and other employees who support care and operations. Rank #40 / 120Payroll — state benchmarkedThis home is ranked 40th out of 120 homes in Illinois.Shows total annual staff payroll benchmarked to the Illinois average. Higher payroll investment relative to peers often signals better staffing and less reliance on cheaper contract labor.
$7.3M
63.2% of revenue Rank #5 / 120Payroll % — state benchmarkedThis home is ranked 5th out of 120 homes in Illinois.Shows payroll as a percentage of revenue versus the Illinois average. Well-run SNFs often land around 55–65%. Below 25% may signal understaffing or heavy agency use — read with Staffing ratings.
Other operating costs Info All remaining costs needed to run the home, such as food, utilities, building maintenance, supplies and administrative expenses.
$5.0M
Total costs $12.3M
Walk Score
Walk Score: 68 / 100 Rank #33 / 94Walk Score — state benchmarkedThis home is ranked 33rd out of 94 homes in Illinois.Shows how walkable this facility's neighborhood is compared to the average Walk Score across Illinois SNFs. Higher scores benefit residents, families, and staff.
Moderately walkable. Some errands can be accomplished on foot, with a mix of nearby amenities.
BBB Rating
BBB Rating: A+ (Not Accredited)
An independent rating from the Better Business Bureau based on factors such as complaint history, transparency, and business practices.
How BBB ratings work

Staffing

Key information about the people who lead and staff this community.

Leadership

ContactTracy Hagman, Owner

Types of Care at Sunset Home Assisted Living

Assisted Living Skilled Nursing

Contact Sunset Home Assisted Living

Inspection History

In Illinois, the Department of Public Health, Office of Health Care Regulation conducts annual unannounced surveys to assess compliance with state and federal healthcare facility standards.

Health Inspection History

Inspections
Total health inspections 14

State average 10.4


Last Health inspection on Oct 2025

Total health citations
64 Rank #106 / 121Health citations — state benchmarkedThis home is ranked 106th out of 121 homes in Illinois.Shows this facility's total health deficiency citations benchmarked to the Illinois state average, with a ranking across all 121 IL SNFs. Lower citation counts earn a better rank.

State average 36.8

Citations per inspection
4.57 Rank #95 / 121Citations per inspection — state benchmarkedThis home is ranked 95th out of 121 homes in Illinois.Shows average deficiency citations per CMS inspection for this facility versus the Illinois mean across 121 SNFs with citation data. Lower is better.

State average 3.68


Health citations are formal notices following inspections when they fail to comply with safety and care standards.

30 of 64 citations resulted from standard inspections; and 34 of 64 resulted from complaint investigations.

Breakdown of citation severity (last 3 years)
Critical Health citations More info
5
614% worse than State average

State average: 0.7


Serious Health citations More info 6
67% worse than State average

State average: 3.6

5 critical citations More info State average: 0.7

6 serious citations More info State average: 3.6

53 moderate citations More info State average: 32

0 minor citations More info State average: 0.5
Citations history (last 3 years)
Abuse/Neglect critical citation Info Issues related to protecting resident's from harm, including abuse, neglect, or mistreatment. Oct 17, 2025
Corrected

Abuse/Neglect critical citation Info Issues related to protecting resident's from harm, including abuse, neglect, or mistreatment. Oct 17, 2025
Corrected

Nursing Services moderate citation Info Issues related to the availability and quality of nursing staff and the care they provide. Oct 17, 2025
Corrected

Abuse/Neglect moderate citation Info Issues related to protecting resident's from harm, including abuse, neglect, or mistreatment. May 03, 2025
Corrected

Financial Assistance for
Assisted Living in Illinois

Sunset Home Assisted Living is located in Quincy, Illinois.
Here are the financial assistance programs available to residents in Illinois.

Get Financial aid guidance

Community Care Program

Illinois CCP

Age 60+
General Illinois resident, at risk of nursing home placement.
Income Limits (2025) ~$1,215/month individual
Asset Limits $17,500 individual, excludes home, car
IL

High demand in urban areas; waitlists possible.

Benefits
In-home care (3-5 hours/day) Adult day services ($65/day) Emergency home response systems ($30/month)

Illinois Respite Program

IL Respite (via NFCSP)

Age Caregiver of someone 60+ (or with dementia)
General Illinois resident.
Income Limits No strict limit; prioritizes low-income.
Asset Limits Not applicable.
IL

Limited slots; urban/rural balance.

Benefits
In-home respite (4-6 hours/day) Adult day care (~$65/day) Short-term facility care (up to 5 days)

Supportive Living Program (SLP)

Illinois Medicaid Supportive Living Program

Age 65+ or 22-64 with disability
General Illinois resident, Medicaid-eligible, needs moderate assistance (not nursing home-level).
Income Limits (2025) ~$2,829/month (300% FBR, individual); QIT allowed.
Asset Limits $2,000 (individual), $3,000 (couple) (excludes home, car).
IL

~200 SLP sites statewide; room/board not covered.

Benefits
Personal care (5-7 hours/day, e.g., bathing, mobility) Meals Housekeeping Medication management Respite (~240 hours/year)

Persons Who Are Elderly Waiver

Illinois Medicaid Elderly Waiver

Age 65+
General Illinois resident, Medicaid-eligible, nursing home-level care need.
Income Limits (2025) ~$2,829/month 300% FBR, individual
Asset Limits $2,000 (individual), $3,000 (couple).
IL

Part of HealthChoice Illinois; consumer-directed options available.

Benefits
Personal care (5-7 hours/day, e.g., dressing, eating) Homemaker Adult day care (~$60/day) Respite (240 hours/year) Home mods ($1,000 avg.)

Medicare Savings Program (MSP)

Illinois Medicare Savings Program

Age 65+ or disabled
General Illinois resident, Medicare Part A/B.
Income Limits (2025) ~$2,510/month (QMB), ~$3,380/month (SLMB), ~$3,598/month (QI)—individual.
Asset Limits $9,430 (individual), $14,130 (couple).
IL

Three tiers; no waitlist.

Benefits
Covers Part B premiums ($174.70/month) Deductibles ($240/year) Copays (~20%)

Senior Community Service Employment Program (SCSEP)

Illinois SCSEP

Age 55+
General unemployed, low-income, Illinois resident.
Income Limits (2025) ~$1,983/month 125% FPL
Asset Limits Not specified; income-focused.
IL

Priority for veterans, rural residents.

Benefits
Paid training (~20 hours/week at ~$7.25/hour) Job placement

Optional State Supplementation (OSS)

Illinois Optional State Supplementation

Age 65+ or disabled
General Illinois resident, in approved facility, SSI recipient or low-income.
Income Limits (2025) ~$1,004/month including SSI
Asset Limits $2,000 (individual), $3,000 (couple).
IL

~$50-$500/month based on facility type.

Benefits
Cash (~$50-$500/month) for room/board in personal care homes or SLFs

VA Aid and Attendance (A&A) and Housebound Benefits

Illinois VA Aid and Attendance/Housebound

Age 65+ or disabled veteran/spouse
General Illinois resident, wartime service, need for ADL help (A&A) or homebound.
Income Limits (2025) Net income < ~$1,984/month (veteran with dependent, A&A); pension offsets income.
Asset Limits ~$155,356 net worth limit
IL

High veteran demand in urban/rural areas.

Benefits
Cash (~$1,433-$2,642/month veteran, ~$951-$1,318 spouse) for care costs (e.g., in-home, assisted living)

Places of interest near Sunset Home Assisted Living

Address 139 miles from city center Info Estimated distance in miles from Quincy's city center to Sunset Home Assisted Living's address, calculated via Google Maps. — 0.94 miles to nearest hospital (Quincy, Illinois)

Calculate Travel Distance to Sunset Home Assisted Living

Add your location

Address

Staffing Data (Q2 2025)

This data corresponds to Q2 2025 and is based on CMS Payroll-Based Journal.

Total staff 200
Employees 111
Contractors 89
Staff to resident ratio 2.30:1
21% better than Illinois average

Illinois average ratio: 1.90:1

Avg staff/day 54
Average shift 8.2 hours
8% better than Illinois average

Illinois average: 7.6 hours

Total staff hours (quarter) 40,049
Nursing staff breakdown
Registered Nurse

Manages medical care and health needs.

Total count 31
Average shift length Info Average shift length. Calculated as total hours divided by days worked and average staff per day. 7.5 hours

This role is partially covered by contractors.

Licensed Practical Nurse

Assists with medical care and medications.

Total count 37
Average shift length Info Average shift length. Calculated as total hours divided by days worked and average staff per day. 9.1 hours

This role is partially covered by contractors.

Certified Nursing Assistant

Helps with daily care and mobility.

Total count 107
Average shift length Info Average shift length. Calculated as total hours divided by days worked and average staff per day. 8.5 hours

This role is partially covered by contractors.

Contractor staffing

Total hours from contractors

15.1%

6,028 contractor hours this quarter

Certified Nursing Assistant: 44 Licensed Practical Nurse: 24 Registered Nurse: 18 Occupational Therapy Assistant: 2 Occupational Therapy Aide: 1
Staff by category
Certified Nursing Assistant634410720,85491100%8.5
Licensed Practical Nurse1324377,77791100%9.1
Registered Nurse1318313,96991100%7.5
Other Dietary Services Staff4041,56891100%7.9
Dental Services Staff3031,2887481%7
Physical Therapy Aide2029467380%8
Speech Language Pathologist3037926470%7
RN Director of Nursing1015386369%8.5
Nurse Practitioner1014996369%7.9
Administrator1014886167%8
Clinical Nurse Specialist2024516369%7
Qualified Social Worker1014046369%6.4
Physical Therapy Assistant1011724651%3.7
Respiratory Therapy Technician2021604853%3.3
Dietitian1016489%8
Occupational Therapy Aide011491314%3.7
Occupational Therapy Assistant0223155%6.2
107 Certified Nursing Assistant
% of Days 100%
37 Licensed Practical Nurse
% of Days 100%
31 Registered Nurse
% of Days 100%
4 Other Dietary Services Staff
% of Days 100%
3 Dental Services Staff
% of Days 81%
2 Physical Therapy Aide
% of Days 80%
3 Speech Language Pathologist
% of Days 70%
1 RN Director of Nursing
% of Days 69%
1 Nurse Practitioner
% of Days 69%
1 Administrator
% of Days 67%
2 Clinical Nurse Specialist
% of Days 69%
1 Qualified Social Worker
% of Days 69%
1 Physical Therapy Assistant
% of Days 51%
2 Respiratory Therapy Technician
% of Days 53%
1 Dietitian
% of Days 9%
1 Occupational Therapy Aide
% of Days 14%
2 Occupational Therapy Assistant
% of Days 5%

Facility Characteristics

Source: CMS Long-Term Care Facility Characteristics (Data as of Jan 2026)

Total residents 87
Medicare
9
10.3% of residents
Medicaid
49
56.3% of residents
Private pay or other
29
33.3% of residents
Programs & Services
Residents Group

Residents meet regularly to discuss policies, care quality, and activities

Active Resident Council

Organized group of residents that meets regularly to discuss facility policies, quality of life, and activities.

Quality of care over time

These measures show how residents usually do over time at this home, based on health outcomes and preventive care.

High-risk clinical events score Info A composite score based on pressure ulcers, falls with injury, weight loss, walking ability decline, and activities of daily living decline. 16.4
69% worse than Illinois average

Illinois average: 9.7

Functional decline score Info A composite score based on activities of daily living decline, walking ability decline, and incontinence. 30.2
63% worse than Illinois average

Illinois average: 18.6

Long-stay resident measures
Need for Help with Daily Activities Increased Info Percent of long-stay residents whose need for help with daily activities has increased 28.9%
86% worse than Illinois average

Illinois average: 15.5%

Walking Ability Worsened Info Percent of long-stay residents whose ability to move independently worsened 33.9%
84% worse than Illinois average

Illinois average: 18.4%

Low Risk Residents with Bowel/Bladder Incontinence Info Percent of low risk long-stay residents who lose control of their bowels or bladder 28.0%
29% worse than Illinois average

Illinois average: 21.6%

Falls with Major Injury Info Percent of long-stay residents experiencing one or more falls with major injury 9.2%
173% worse than Illinois average

Illinois average: 3.4%

High Risk Residents with Pressure Ulcers Info Percent of long-stay high risk residents with pressure ulcers 4.0%
25% better than Illinois average

Illinois average: 5.3%

Urinary Tract Infection Info Percent of long-stay residents with a urinary tract infection 1.0%
47% better than Illinois average

Illinois average: 1.8%

Lost Too Much Weight Info Percent of long-stay residents who lose too much weight 6.3%
In line with Illinois average

Illinois average: 6.5%

Depressive Symptoms Info Percent of long-stay residents who have depressive symptoms 0.3%
99% better than Illinois average

Illinois average: 48.1%

Antipsychotic Use Info Percent of long-stay residents who received an antipsychotic medication 15.6%
23% better than Illinois average

Illinois average: 20.2%

Pneumococcal Vaccine Info Percent of long-stay residents assessed and appropriately given the pneumococcal vaccine 91.8%
In line with Illinois average

Illinois average: 89.2%

Influenza Vaccine Info Percent of long-stay residents assessed and appropriately given the seasonal influenza vaccine 98.8%
8% better than Illinois average

Illinois average: 91.6%

Short-stay resident measures
Pneumococcal Vaccine Info Percent of short-stay residents assessed and appropriately given the pneumococcal vaccine 42.1%
38% worse than Illinois average

Illinois average: 68.3%

Antipsychotic medication increase Info Percent of short-stay residents who newly received an antipsychotic medication 0.0%
100% better than Illinois average

Illinois average: 2.3%

Influenza Vaccine Info Percent of short-stay residents assessed and appropriately given the seasonal influenza vaccine 53.5%
15% worse than Illinois average

Illinois average: 63.0%

Penalties and fines

Federal penalties imposed by CMS for regulatory violations, including civil money penalties (fines) and denials of payment for new Medicare/Medicaid admissions.

Source: CMS Penalties Database (Data as of Jan 2026)

Total fines amount $243K
70% higher than Illinois average

Illinois average: $143K

Number of fines 4
35% more fines than Illinois average

Illinois average: 3.0

Payment Denials Info Serious action where Medicare and/or Medicaid temporarily stops payments for new residents until issues are fixed. 0
100% fewer payment denials than Illinois average

Illinois average: 1.1

Fines amount comparison
This facility $243K
Illinois average $143K
Penalty History

Penalties are imposed by CMS for violations of federal nursing home regulations.

3 penalties in the past 3 years

Multiple penalties were reported in the last 3 years.

Civil Money Penalty Info Fines imposed for noncompliance, which can be assessed per day or per instance of violation. Mar 19, 2025
$39K
Civil Money Penalty Info Fines imposed for noncompliance, which can be assessed per day or per instance of violation. Apr 3, 2024
$40K
Civil Money Penalty Info Fines imposed for noncompliance, which can be assessed per day or per instance of violation. Jul 10, 2023
$135K

Last updated: Jan 2026

Compare Assisted Living around Quincy The information below is reported by the Illinois Department of Public Health, Office of Health Care Regulation.

Filter by care type
Sunset Home Assisted Living
NH

Nursing Home Licensed facility providing 24/7 skilled nursing care for residents with complex, ongoing medical needs. Staffed by RNs, LPNs, and CNAs. Inspected and star-rated annually by CMS. Accepts Medicare (short-term rehab) and Medicaid (long-term care).

AL

Assisted Living A licensed, long-term care setting for seniors or individuals with disabilities who need help with daily activities — like bathing, dressing, and medication management — but not 24-hour skilled nursing. Offers housing, meals, and around-the-clock support while aiming to maximize resident independence.

N

Nursing

Quincy132No 68 -A+-0-
Adams Pointe
AL

Assisted Living A licensed, long-term care setting for seniors or individuals with disabilities who need help with daily activities — like bathing, dressing, and medication management — but not 24-hour skilled nursing. Offers housing, meals, and around-the-clock support while aiming to maximize resident independence.

HC

Home Care Professional care delivered in the person's own home — from companionship and errands to skilled nursing and therapy. Allows seniors to age in place. Medicare covers skilled home health when medically necessary.

MC

Memory Care Secured, specialized care for people living with Alzheimer's or dementia. Staff trained in cognitive impairment, with higher staff-to-resident ratios and an environment designed to reduce confusion and wandering risk.

Quincy28No 45 1-Quincy I, Llc7Studio / 1 Bed
Adams Pointe Senior Living
AL

Assisted Living A licensed, long-term care setting for seniors or individuals with disabilities who need help with daily activities — like bathing, dressing, and medication management — but not 24-hour skilled nursing. Offers housing, meals, and around-the-clock support while aiming to maximize resident independence.

HC

Home Care Professional care delivered in the person's own home — from companionship and errands to skilled nursing and therapy. Allows seniors to age in place. Medicare covers skilled home health when medically necessary.

MC

Memory Care Secured, specialized care for people living with Alzheimer's or dementia. Staff trained in cognitive impairment, with higher staff-to-resident ratios and an environment designed to reduce confusion and wandering risk.

RC

Respite Care Short-term temporary care — days to weeks — to give family caregivers a break. Full care provided during the stay. Often used after hospitalization or to trial a facility before a permanent placement decision.

Quincy28Yes 45 1-Quincy I, Llc7-
Bickford of Quincy
AL

Assisted Living A licensed, long-term care setting for seniors or individuals with disabilities who need help with daily activities — like bathing, dressing, and medication management — but not 24-hour skilled nursing. Offers housing, meals, and around-the-clock support while aiming to maximize resident independence.

MC

Memory Care Secured, specialized care for people living with Alzheimer's or dementia. Staff trained in cognitive impairment, with higher staff-to-resident ratios and an environment designed to reduce confusion and wandering risk.

Quincy-Yes 35 26A+-0-
Cedarhurst of Quincy
AL

Assisted Living A licensed, long-term care setting for seniors or individuals with disabilities who need help with daily activities — like bathing, dressing, and medication management — but not 24-hour skilled nursing. Offers housing, meals, and around-the-clock support while aiming to maximize resident independence.

MC

Memory Care Secured, specialized care for people living with Alzheimer's or dementia. Staff trained in cognitive impairment, with higher staff-to-resident ratios and an environment designed to reduce confusion and wandering risk.

Quincy-Yes 19 17A+-0Suite

Guides for Better Senior Living

Care Cost Calculator: See Prices in Your Area

Nursing Home Data Explorer

Don’t Wait Too Long: 7 Red Flag Signs Your Parent Needs Assisted Living Now

The True Cost of Assisted Living in 2025 – And How Families Are Paying For It

Understanding Senior Living Costs: Pricing Models, Discounts & Financial Assistance

Explore Open Rooms
1 Contact details
2 What type of senior care service are you looking for?
3 What budget do you have in mind for senior care?
4 How soon do you need to find care?
5 Additional details

Thank you for your interest!

Our team will be in touch shortly to help with next steps.