


Total health inspections
5
Illinois average 10.4
Last Health inspection on Apr 2025
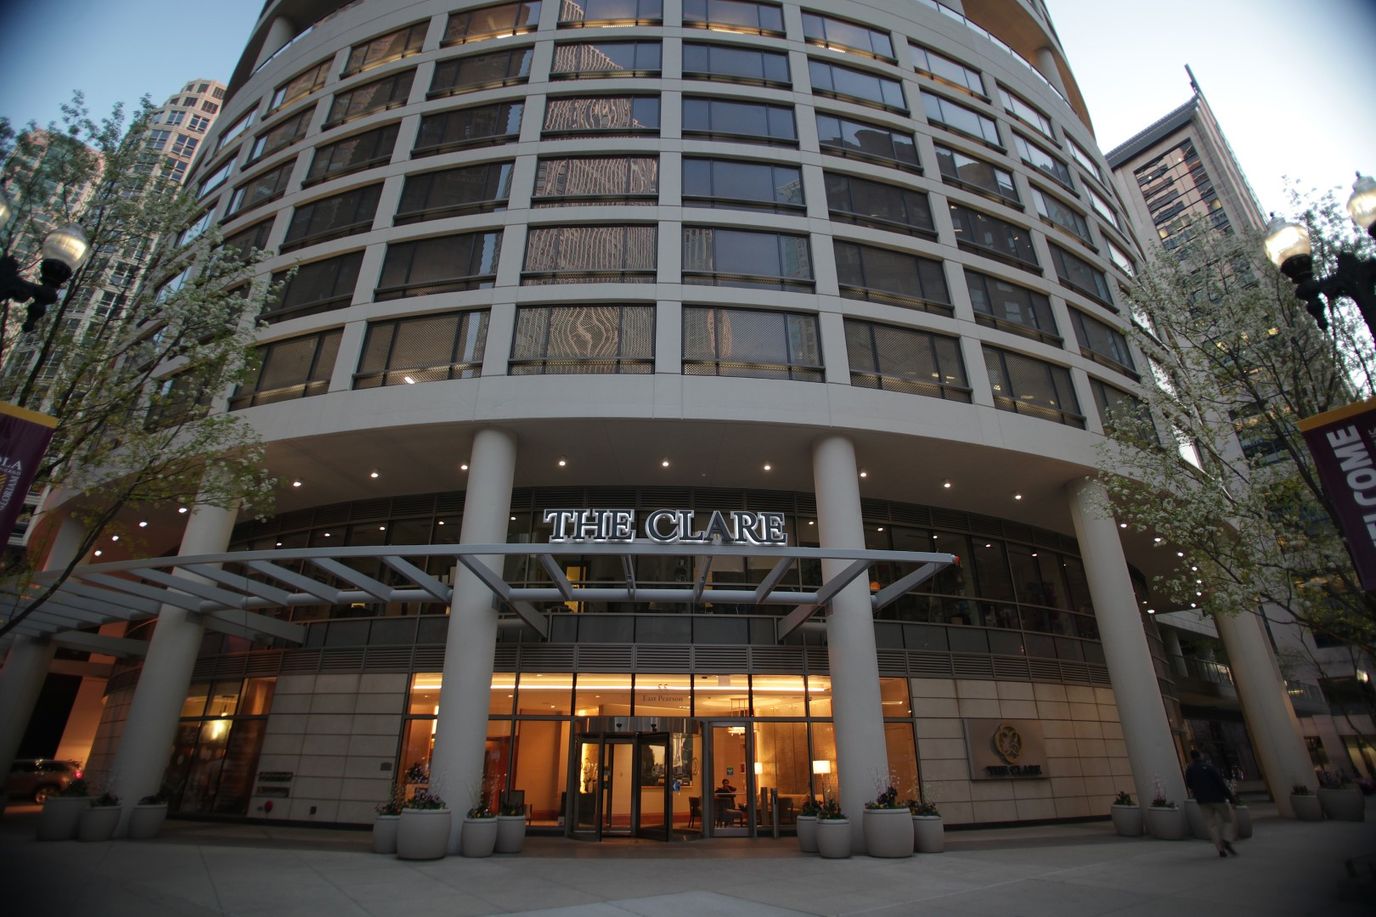
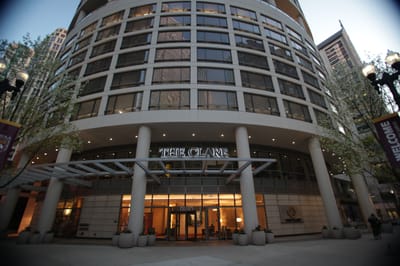


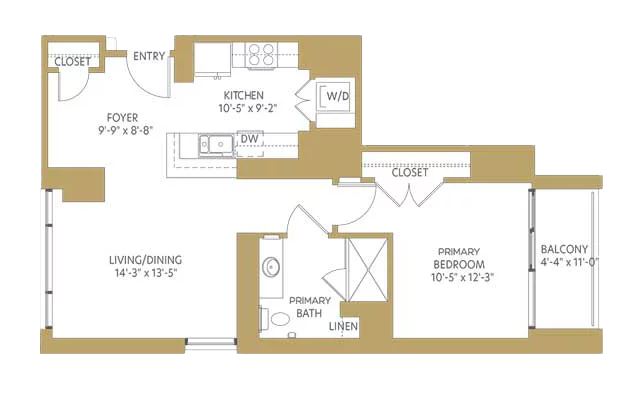
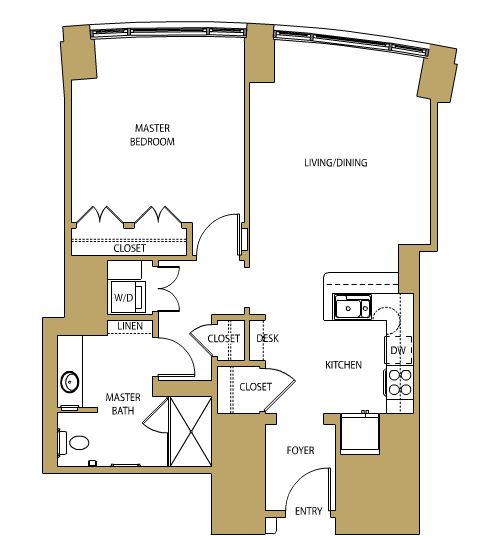
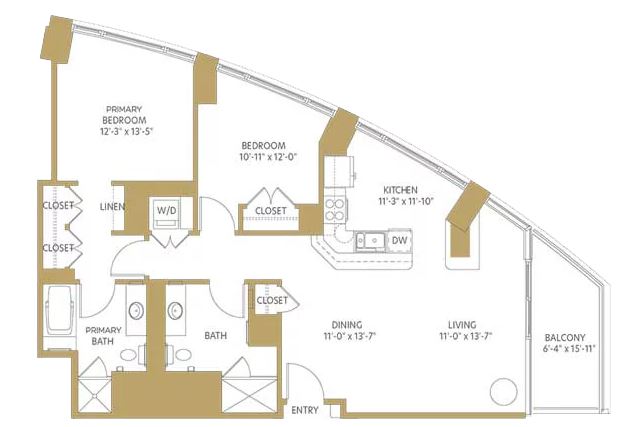
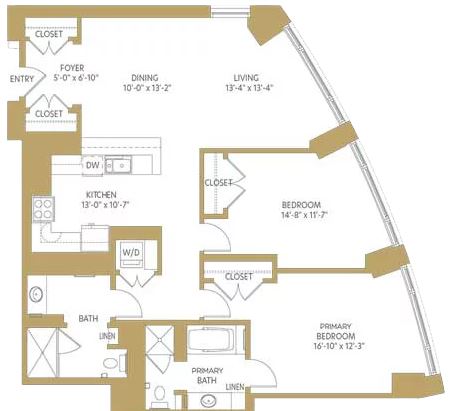
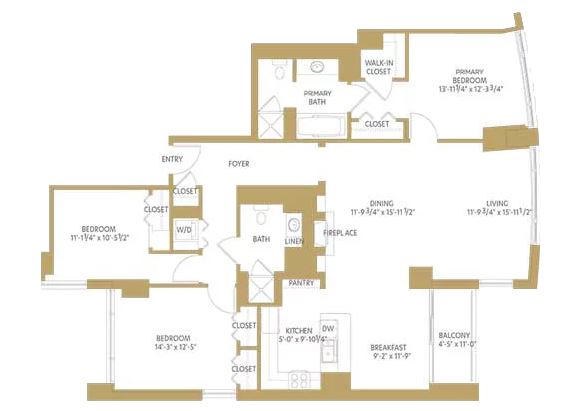
The Clare sits at 55 E Pearson St in Chicago’s Rush & Division neighborhood, a high-rise run by The Clare Partners LLC with 49 units split across one, two, and three-bedroom layouts. Sizes run from 774 square feet up to 1,709.
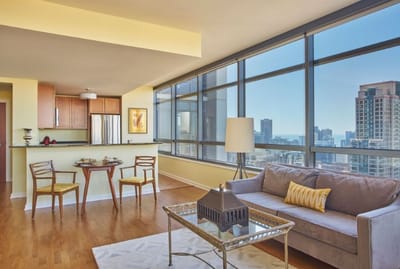
A Walk Score of 100 means groceries, pharmacies, and most daily errands are a walk away, not a drive. Occupancy sits at 84.4 percent, which tells you the building is mostly full but not maxed out. This is a place that covers a lot of ground on the care spectrum: independent living, assisted living, and memory care, all under one roof, with staff specifically trained in dementia care for residents who need it.
Beauty services, transportation, housekeeping, organized social and recreational activities, exercise and wellness programming, and parking are all part of daily life, and residents also get 24-hour security, an on-site concierge, and access to a full-time exercise physiologist. Dining is flexible and chef-prepared, not a fixed cafeteria schedule. Pets are welcome, too.
The Clare takes Medicare, Medicaid, and private pay, so families aren’t boxed into one funding path. For residents needing nursing-level support, the staffing data shows about 3 hours and 41 minutes of total nursing care per resident each day.
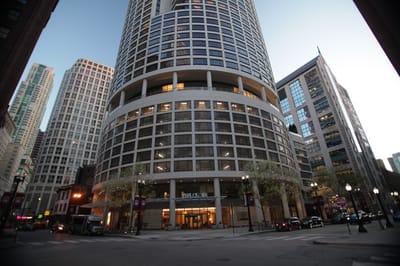
The Clare is a high-rise community built to handle a resident’s care needs as they change, independent living now, memory care later if it comes to that, without forcing a move somewhere new.
| Staff type | Hours / Day / Resident | vs state avg |
|---|---|---|
|
Registered Nurse (RN)
| 41m per day | ▼ 4% State avg: 43m per day · National avg: 41m per day |
|
LPN / LVN
| 36m per day | ▼ 8% State avg: 39m per day · National avg: 52m per day |
|
Nurse Aide
| 2h 16m per day | ▲ 7% State avg: 2h 7m per day · National avg: 2h 20m per day |
|
Weekend Total Nursing
| 2h 57m per day | ▼ 5% State avg: 3h 6m per day · National avg: 3h 27m per day |
|
Physical Therapist
| 1m per day | ▼ 76% State avg: 3m per day · National avg: 4m per day |
|
Weekend RN
| 27m per day | ▼ 19% State avg: 33m per day · National avg: 29m per day |
Illinois average 10.4
Last Health inspection on Apr 2025
Illinois average 36.8
Illinois average 3.68
Health citations are formal notices following inspections when they fail to comply with safety and care standards.
11 of 13 citations resulted from standard inspections; and 2 of 13 resulted from complaint investigations.
Illinois average: 0.7
Illinois average: 3.6
Reporting period: October 1 – December 31, 2025 (Q4 2025). Source: CMS Payroll-Based Journal report.
Manages medical care and health needs.
Assists with medical care and medications.
Helps with daily care and mobility.
Total hours from contractors
1,245 contractor hours this quarter
| Certified Nursing Assistant | 24 | 7 | 31 | 9,405 | 92 | 100% | 7.7 |
| Registered Nurse | 5 | 11 | 16 | 2,041 | 92 | 100% | 6.6 |
| Licensed Practical Nurse | 4 | 6 | 10 | 2,041 | 92 | 100% | 8.6 |
| Other Dietary Services Staff | 3 | 0 | 3 | 1,118 | 92 | 100% | 7.9 |
| Speech Language Pathologist | 0 | 1 | 1 | 454 | 64 | 70% | 7.1 |
| Dental Services Staff | 1 | 0 | 1 | 444 | 57 | 62% | 7.8 |
| RN Director of Nursing | 1 | 0 | 1 | 438 | 55 | 60% | 8 |
| Administrator | 1 | 0 | 1 | 432 | 54 | 59% | 8 |
| Clinical Nurse Specialist | 1 | 0 | 1 | 417 | 53 | 58% | 7.9 |
| Nurse Practitioner | 1 | 0 | 1 | 408 | 51 | 55% | 8 |
| Physical Therapy Aide | 0 | 1 | 1 | 145 | 31 | 34% | 4.7 |
| Physical Therapy Assistant | 0 | 1 | 1 | 123 | 34 | 37% | 3.6 |
| Respiratory Therapy Technician | 0 | 1 | 1 | 51 | 25 | 27% | 2 |
| Occupational Therapy Assistant | 0 | 1 | 1 | 25 | 4 | 4% | 6.3 |
Federal penalties imposed by CMS for regulatory violations, including civil money penalties (fines) and denials of payment for new Medicare/Medicaid admissions.
Source: CMS Penalties Database
No penalties in the past 3 years
No civil money penalties or payment denials were reported in the last 3 years.
These measures show how residents usually do over time at this home, based on health outcomes and preventive care.
Illinois average: 9.7
Illinois average: 18.6
Illinois average: 15.5%
Illinois average: 18.4%
Illinois average: 21.6%
Illinois average: 3.4%
Illinois average: 5.3%
Illinois average: 1.8%
Illinois average: 6.5%
Illinois average: 48.1%
Illinois average: 20.2%
Illinois average: 89.2%
Illinois average: 91.6%
Illinois average: 68.3%
Illinois average: 2.3%
Quality measures are calculated from Minimum Data Set (MDS) assessments. For most measures, lower percentages indicate better care quality.
58% of new residents, usually for short-term rehab.
31% of new residents, often for short stays.
11% of new residents, often for long-term daily care.
Source: CMS Long-Term Care Facility Characteristics (Data as of Jan 2026)
Residents meet regularly to discuss policies, care quality, and activities
Organized group of residents that meets regularly to discuss facility policies, quality of life, and activities.
Data sourced from CMS Long-Term Care Facility Characteristics quarterly report. Payer mix reflects the current resident census by primary payment source.
Historical financial and operational data for The Clare from 2013–2023, based on CMS SNF Cost Reports.
Key figures below are for fiscal year ending in 11/2023.
Based on CMS SNF Cost Report for fiscal year ending in 11/2023.
Pets Allowed
Room Sizes: 774 - 1183 / 1209 - 1387 / 1709 sq. ft.
Housing Options: 1 Bed / 2 Bed / 3 Bed
Building Type: High-rise
Beauty Services
Transportation Services
Housekeeping Services
Social and Recreational Activities
Exercise Programs

Wellness Programs

Parking Available
Most residents typically stay for a few weeks or months before returning home or moving on.
Most new residents arrive under Medicare (58% of admissions), and a typical Medicare stay runs around 1 - 2 months.
Coverage residents most often arrive under.
Coverage residents most often leave under.
![]() 1.6 miles from city center
1.6 miles from city center
![]() Estimated distance in miles from Chicago's city center to The Clare's address, calculated via Google Maps.
— 0.15 miles to nearest hospital (Global Life Rejuvenation)
Estimated distance in miles from Chicago's city center to The Clare's address, calculated via Google Maps.
— 0.15 miles to nearest hospital (Global Life Rejuvenation)
Add your location
The information below is reported by the Illinois Department of Public Health, Office of Health Care Regulation.
| Mercy Circle Senior Living | NH AL IL MC SNF | Chicago (Mount Greenwood) | 43
Facility
43
IL AVG
86
Rank
#335 / 424 | - | - | 4.57
Facility
4.57
IL AVG
3.10
Rank
#24 / 166 | -8% | +47% | $0
Facility
$0
IL AVG
$151.3k
Rank
#1 / 167 | 16
Facility
16
IL AVG
36.8
Rank
#24 / 167 | 4.0
Facility
4.0
IL AVG
3.7
Rank
#116 / 167 | - | 22 | - |
44
Facility
44
IL AVG
51
Rank
#392 / 648 | Sisters Of Mercy Of The Americas West Midwest Community Inc | $10.3MFiscal year ending 06/2024
Facility
$10.3MFiscal year ending 06/2024
IL AVG
$12.2M
Rank
#101 / 166 | $5.1MFiscal year ending 06/2024
Facility
$5.1MFiscal year ending 06/2024
IL AVG
$4.8M
Rank
#119 / 166 | 49.8%Fiscal year ending 06/2024
Facility
49.8%Fiscal year ending 06/2024
IL AVG
44.3%
Rank
#114 / 166 | 146174 | ||||
| The Selfhelp Home Senior Living Community | NH AL IL RC SNF | Chicago (Uptown) | 72
Facility
72
IL AVG
86
Rank
#208 / 424 |
81.9%
Facility
81.9%
IL AVG
73.1
Rank
#65 / 162 | +12% | 5.56
Facility
5.56
IL AVG
3.10
Rank
#8 / 166 | +44% | +79% | $0
Facility
$0
IL AVG
$151.3k
Rank
#1 / 167 | 21
Facility
21
IL AVG
36.8
Rank
#44 / 167 | 5.3
Facility
5.3
IL AVG
3.7
Rank
#150 / 167 | 1 | 59 | A+ |
92
Facility
92
IL AVG
51
Rank
#28 / 648 | Marvin Rubin | $9.3MFiscal year ending 09/2023
Facility
$9.3MFiscal year ending 09/2023
IL AVG
$12.2M
Rank
#82 / 166 | $7.0MFiscal year ending 09/2023
Facility
$7.0MFiscal year ending 09/2023
IL AVG
$4.8M
Rank
#78 / 166 | 75.3%Fiscal year ending 09/2023
Facility
75.3%Fiscal year ending 09/2023
IL AVG
44.3%
Rank
#67 / 166 | 146009 | ||||
| The Clare | NH AL IL MC SNF | Chicago (Rush & Division) | 49
Facility
49
IL AVG
86
Rank
#299 / 424 |
92.2%
Facility
92.2%
IL AVG
73.1
Rank
#24 / 162 | +26% | 3.69
Facility
3.69
IL AVG
3.10
Rank
#49 / 166 | +61% | +19% | $0
Facility
$0
IL AVG
$151.3k
Rank
#1 / 167 | 13
Facility
13
IL AVG
36.8
Rank
#19 / 167 | 2.6
Facility
2.6
IL AVG
3.7
Rank
#28 / 167 | 1 | 45 | A+ |
100
Facility
100
IL AVG
51
Rank
#1 / 648 | County Of Fulton | $4.4MFiscal year ending 11/2023
Facility
$4.4MFiscal year ending 11/2023
IL AVG
$12.2M
Rank
#159 / 166 | $3.6MFiscal year ending 11/2023
Facility
$3.6MFiscal year ending 11/2023
IL AVG
$4.8M
Rank
#157 / 166 | 81.8%Fiscal year ending 11/2023
Facility
81.8%Fiscal year ending 11/2023
IL AVG
44.3%
Rank
#14 / 166 | 146151 | ||||
| Encore Village of Schaumburg | NH AL IL MC SNF | Schaumburg | 109
Facility
109
IL AVG
86
Rank
#107 / 424 | - | - | 3.46
Facility
3.46
IL AVG
3.10
Rank
#53 / 166 | +8% | +12% | $25.5k
Facility
$25.5k
IL AVG
$151.3k
Rank
#92 / 167 | 28
Facility
28
IL AVG
36.8
Rank
#68 / 167 | 2.6
Facility
2.6
IL AVG
3.7
Rank
#28 / 167 | 2 | 105 | A+ |
58
Facility
58
IL AVG
51
Rank
#253 / 648 | Il Ccrc, LLC | $16.2MFiscal year ending 03/2024
Facility
$16.2MFiscal year ending 03/2024
IL AVG
$12.2M
Rank
#1 / 166 | $15.9MFiscal year ending 03/2024
Facility
$15.9MFiscal year ending 03/2024
IL AVG
$4.8M
Rank
#4 / 166 | 98.3%Fiscal year ending 03/2024
Facility
98.3%Fiscal year ending 03/2024
IL AVG
44.3%
Rank
#166 / 166 | 145341 | ||||
| Asbury Gardens | NH HOS MC PC SNF | North Aurora (Airport Road) | 75
Facility
75
IL AVG
86
Rank
#197 / 424 |
76.5%
Facility
76.5%
IL AVG
73.1
Rank
#80 / 162 | +5% | 4.00
Facility
4.00
IL AVG
3.10
Rank
#42 / 166 | +6% | +29% | $6.4k
Facility
$6.4k
IL AVG
$151.3k
Rank
#69 / 167 | 21
Facility
21
IL AVG
36.8
Rank
#44 / 167 | 3.5
Facility
3.5
IL AVG
3.7
Rank
#81 / 167 | - | 57 | A+ |
38
Facility
38
IL AVG
51
Rank
#434 / 648 | Abraham Diamond | $6.7MFiscal year ending 12/2023
Facility
$6.7MFiscal year ending 12/2023
IL AVG
$12.2M
Rank
#145 / 166 | $3.8MFiscal year ending 12/2023
Facility
$3.8MFiscal year ending 12/2023
IL AVG
$4.8M
Rank
#136 / 166 | 56.5%Fiscal year ending 12/2023
Facility
56.5%Fiscal year ending 12/2023
IL AVG
44.3%
Rank
#32 / 166 | 146170 |
The Clare is located in Chicago, Illinois.
Here are the financial assistance programs available to residents in Illinois.
The Clare is in the Rush & Division neighborhood of Chicago.
The Clare has a walk score of 100. Walker's paradise. Daily errands do not require a car, with many shops and services nearby.
The Clare's occupancy is 84.4%.
Yes, The Clare allows residents to bring their pets.
The Clare is a government-operated nursing facility in IL.
Yes — there are 8 photos of The Clare in the photo gallery on this page.
The Clare is located at 55 E Pearson St, Chicago, IL 60611.
Care Cost Calculator: See Prices in Your Area
Nursing Home Data Explorer
Don’t Wait Too Long: 7 Red Flag Signs Your Parent Needs Assisted Living Now
The True Cost of Assisted Living in 2025 – And How Families Are Paying For It
Understanding Senior Living Costs: Pricing Models, Discounts & Financial Assistance


