


Total health inspections
7
Florida average 4.3
Last Health inspection on Feb 2024

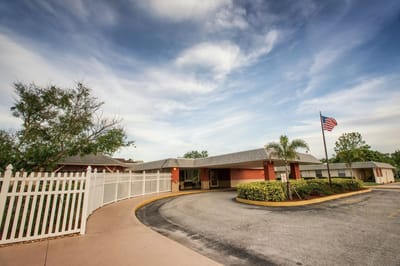
The West Melbourne Health and Rehabilitation Center is a pillar of care, serving the vibrant city of Melbourne, Brevard County, and the wider eastern Central Florida Region. It offers a distinguished and refreshing alternative to the conventional long-term care and rehabilitation facility. During meal times, residents are offered the choice of savoring their meals in the comfort of their room or within a restaurant-style dining area, ensuring that their dining experience is as enjoyable and varied as their overall stay.
At this facility, an unwavering commitment to quality is complemented by the presence of a professional and compassionate staff, setting the stage for a superior experience. Residents are invited to unwind in the outdoor courtyards and partake in diverse daily activities designed to keep them engaged and active. The environment is meticulously designed, with beautifully decorated common areas that evoke a sense of warmth and welcome.
| Staff type | Hours / Day / Resident | vs state avg |
|---|---|---|
|
Registered Nurse (RN)
|
36m per day | ▼ 18% State avg: 44m per day · National avg: 41m per day |
|
LPN / LVN
|
51m per day | ▲ 8% State avg: 47m per day · National avg: 52m per day |
|
Nurse Aide
|
2h 19m per day | ■ Avg State avg: 2h 20m per day · National avg: 2h 21m per day |
|
Weekend Total Nursing
|
3h 10m per day | ▼ 10% State avg: 3h 31m per day · National avg: 3h 26m per day |
|
Physical Therapist
|
2m per day | ▼ 60% State avg: 5m per day · National avg: 4m per day |
|
Weekend RN
|
24m per day | ▼ 26% State avg: 32m per day · National avg: 29m per day |
In Florida, the Agency for Health Care Administration (AHCA) is the primary authority that conducts unannounced inspections and completes official health quality reports for all healthcare facilities.
Inspection score unavailable
Not enough inspection history to generate a score.
Average score for Florida nursing homes: B 83/100
Citations
|
This Facility | FL Average | vs. FL Avg |
|---|---|---|---|
|
Total citations
|
39 | 33 | This facility has 18% more total citations than a typical Florida nursing home (39 vs. FL avg 33).↑ 18% worse Rank #1 / 919 Total citations — State benchmarked This home is ranked 1st out of 919 homes in Florida. Shows this facility's total citations compared to the Florida average among 919 comparable communities in the ranking pool. Rankings are based only on facilities in Florida that report data for that category. Facilities without available data are excluded from the ranking. |
|
Citations per year
|
9.8 | 8.3 | This facility has 18% more citations per year than a typical Florida nursing home (9.8 vs. FL avg 8.3).↑ 18% worse |
Florida average 4.3
Last Health inspection on Feb 2024
Florida average 19.7
Florida average 4.48
Health citations are formal notices following inspections when they fail to comply with safety and care standards.
26 of 34 citations resulted from standard inspections; and 8 of 34 resulted from complaint investigations.
Florida average: 0.8
Florida average: 0.4
Reporting period: October 1 – December 31, 2025 (Q4 2025). Source: CMS Payroll-Based Journal report.
Manages medical care and health needs.
Assists with medical care and medications.
Helps with daily care and mobility.
Total hours from contractors
4,372 contractor hours this quarter
| Certified Nursing Assistant | 87 | 0 | 87 | 32,047 | 92 | 100% | 7.8 |
| Licensed Practical Nurse | 28 | 0 | 28 | 9,338 | 92 | 100% | 7.7 |
| Registered Nurse | 19 | 0 | 19 | 6,838 | 92 | 100% | 7.7 |
| RN Director of Nursing | 6 | 0 | 6 | 2,329 | 80 | 87% | 7.5 |
| Qualified Social Worker | 0 | 9 | 9 | 1,098 | 81 | 88% | 6.4 |
| Speech Language Pathologist | 0 | 4 | 4 | 1,048 | 76 | 83% | 6 |
| Clinical Nurse Specialist | 2 | 0 | 2 | 992 | 64 | 70% | 8 |
| Physical Therapy Aide | 0 | 4 | 4 | 903 | 71 | 77% | 6.1 |
| Physical Therapy Assistant | 0 | 5 | 5 | 601 | 71 | 77% | 6.5 |
| Dietitian | 1 | 0 | 1 | 599 | 71 | 77% | 8.4 |
| Other Dietary Services Staff | 2 | 0 | 2 | 561 | 65 | 71% | 8 |
| Administrator | 1 | 0 | 1 | 512 | 64 | 70% | 8 |
| Nurse Practitioner | 1 | 0 | 1 | 496 | 62 | 67% | 8 |
| Dental Services Staff | 1 | 0 | 1 | 483 | 61 | 66% | 7.9 |
| Mental Health Service Worker | 1 | 0 | 1 | 480 | 60 | 65% | 8 |
| Respiratory Therapy Technician | 0 | 2 | 2 | 457 | 68 | 74% | 6.5 |
| Occupational Therapy Aide | 0 | 1 | 1 | 216 | 26 | 28% | 8.3 |
| Medical Director | 0 | 1 | 1 | 38 | 16 | 17% | 2.4 |
| Occupational Therapy Assistant | 0 | 1 | 1 | 12 | 3 | 3% | 4 |
Federal penalties imposed by CMS for regulatory violations, including civil money penalties (fines) and denials of payment for new Medicare/Medicaid admissions.
Source: CMS Penalties Database (Data as of Jan 2026)
Florida average: $72K
Florida average: 2.6
Florida average: 0.1
No penalties in the past 3 years
No civil money penalties or payment denials were reported in the last 3 years.
These measures show how residents usually do over time at this home, based on health outcomes and preventive care.
Florida average: 7.4
Florida average: 12.4
Florida average: 10.5%
Florida average: 12.9%
Florida average: 13.5%
Florida average: 2.6%
Florida average: 5.4%
Florida average: 0.9%
Florida average: 6.0%
Florida average: 3.3%
Florida average: 8.0%
Florida average: 97.7%
Florida average: 99.2%
Florida average: 2.10
Florida average: 1.18
Florida average: 94.0%
Florida average: 1.5%
Florida average: 94.7%
Florida average: 26.2%
Florida average: 9.3%
Florida average: 0.8%
Florida average: 53.7%
Florida average: 50.6%
Quality measures are calculated from Minimum Data Set (MDS) assessments. For most measures, lower percentages indicate better care quality.
22% of new residents, usually for short-term rehab.
67% of new residents, often for short stays.
11% of new residents, often for long-term daily care.
Source: CMS Long-Term Care Facility Characteristics (Data as of Jan 2026)
Residents meet regularly to discuss policies, care quality, and activities
Organized group of residents that meets regularly to discuss facility policies, quality of life, and activities.
Data sourced from CMS Long-Term Care Facility Characteristics quarterly report. Payer mix reflects the current resident census by primary payment source.
Historical financial and operational data for West Melbourne Health and Rehabilitation Center from 2012–2024, based on CMS SNF Cost Reports.
Based on CMS SNF Cost Report for fiscal year ending in 05/2024.
Residents typically stay for brief periods, with frequent admissions and discharges throughout the year.
Most new residents arrive under private pay (67% of admissions), and a typical private pay stay runs around 1 - 2 months.
Coverage residents most often arrive under.
Coverage residents most often leave under.
![]() 2125 W New Haven Ave, West Melbourne, FL 32904 — 1.81 miles to nearest hospital (Kindred Hospital Melbourne)
2125 W New Haven Ave, West Melbourne, FL 32904 — 1.81 miles to nearest hospital (Kindred Hospital Melbourne)
Add your location
The information below is reported by the Florida Agency for Health Care Administration (AHCA).
|
|
|
|
|
|
|
|
|
|
|
|
|
|
|
|
|
|
|
|
|
|
|
|
|
|
|
|---|---|---|---|---|---|---|---|---|---|---|---|---|---|---|---|---|---|---|---|---|---|---|---|---|---|
| Life Care Center of Melbourne |
NH
|
Melbourne |
120
Facility
120
FL AVG
89
Rank
#256 / 1074
|
95.6%
Facility
95.6%
FL AVG
84.3%
Rank
#19 / 258
| +13% |
3.81
Facility
3.81
FL AVG
4.04
Rank
#145 / 253
| -11% | -6% |
$0
Facility
$0
FL AVG
$78.9k
Rank
#1 / 258
| - |
12
Facility
12
FL AVG
19.7
Rank
#67 / 252
|
4.0
Facility
4.0
FL AVG
4.5
Rank
#112 / 252
| - | 116 | - |
39
Facility
39
FL AVG
40
Rank
#743 / 1486
| Dana Delena |
$15.4M
Facility
$15.4M
FL AVG
$15.7M
Rank
#68 / 257
|
$8.4M
Facility
$8.4M
FL AVG
$6.1M
Rank
#115 / 257
|
54.6%
Facility
54.6%
FL AVG
39.8%
Rank
#213 / 257
| 105291 | ||||
| West Melbourne Health and Rehabilitation Center |
NH
MC
PC
|
West Melbourne (New Haven Avenue) |
180
Facility
180
FL AVG
89
Rank
#56 / 1074
| - | - |
4.92
Facility
4.92
FL AVG
4.04
Rank
#32 / 253
| -11% | +22% |
$0
Facility
$0
FL AVG
$78.9k
Rank
#1 / 258
| - |
34
Facility
34
FL AVG
19.7
Rank
#225 / 252
|
4.9
Facility
4.9
FL AVG
4.5
Rank
#163 / 252
| 2 | 25 | C+ |
79
Facility
79
FL AVG
40
Rank
#114 / 1486
| Denise Caiati |
$17.0M
Facility
$17.0M
FL AVG
$15.7M
Rank
#118 / 257
|
$10.8M
Facility
$10.8M
FL AVG
$6.1M
Rank
#60 / 257
|
63.6%
Facility
63.6%
FL AVG
39.8%
Rank
#27 / 257
| 105376 | ||||
| Indian River Center |
NH
MC
PC
RC
|
Melbourne |
179
Facility
179
FL AVG
89
Rank
#78 / 1074
|
92.3%
Facility
92.3%
FL AVG
84.3%
Rank
#78 / 258
| +10% |
3.73
Facility
3.73
FL AVG
4.04
Rank
#175 / 253
| -19% | -8% |
$74.4k
Facility
$74.4k
FL AVG
$78.9k
Rank
#227 / 258
| - |
16
Facility
16
FL AVG
19.7
Rank
#107 / 252
|
3.2
Facility
3.2
FL AVG
4.5
Rank
#66 / 252
| 3 | 172 | - |
34
Facility
34
FL AVG
40
Rank
#850 / 1486
| Cazzie King |
$19.2M
Facility
$19.2M
FL AVG
$15.7M
Rank
#119 / 257
|
$8.8M
Facility
$8.8M
FL AVG
$6.1M
Rank
#81 / 257
|
45.6%
Facility
45.6%
FL AVG
39.8%
Rank
#63 / 257
| 105673 | ||||
| Market Street Viera |
NH
MC
RC
|
Melbourne |
64
Facility
64
FL AVG
89
Rank
#682 / 1074
|
93.1%
Facility
93.1%
FL AVG
84.3%
Rank
#63 / 258
| +10% |
3.72
Facility
3.72
FL AVG
4.04
Rank
#175 / 253
| -11% | -8% |
$43.8k
Facility
$43.8k
FL AVG
$78.9k
Rank
#215 / 258
|
61
Facility
61
FL AVG
83
Rank
#853 / 876
|
16
Facility
16
FL AVG
19.7
Rank
#107 / 252
|
3.2
Facility
3.2
FL AVG
4.5
Rank
#66 / 252
| 1 | 75 | - |
7
Facility
7
FL AVG
40
Rank
#1318 / 1486
| Sarasota Member LLC |
$8.1M
Facility
$8.1M
FL AVG
$15.7M
Rank
#229 / 257
|
$4.4M
Facility
$4.4M
FL AVG
$6.1M
Rank
#223 / 257
|
54.3%
Facility
54.3%
FL AVG
39.8%
Rank
#53 / 257
| 105983 |
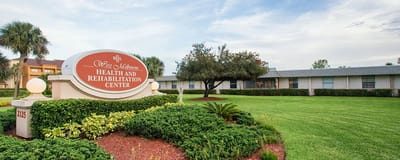
West Melbourne Health and Rehabilitation Center is located in West Melbourne, Florida.
Here are the financial assistance programs available to residents in Florida.
West Melbourne Health and Rehabilitation Center is in the New Haven Avenue neighborhood of West Melbourne.
West Melbourne Health and Rehabilitation Center has a walk score of 79. Very walkable. Most errands can be accomplished on foot, and many essentials are within a short walk.
West Melbourne Health and Rehabilitation Center's occupancy is 83.8%.
West Melbourne Health and Rehabilitation Center is registered as a for-profit in FL.
Yes — there are 3 photos of West Melbourne Health and Rehabilitation Center in the photo gallery on this page.
West Melbourne Health and Rehabilitation Center is located at 2125 W New Haven Ave, West Melbourne, FL 32904.
(321) 725-7360 will put you in contact with the team at West Melbourne Health and Rehabilitation Center.
Care Cost Calculator: See Prices in Your Area
Nursing Home Data Explorer
Don’t Wait Too Long: 7 Red Flag Signs Your Parent Needs Assisted Living Now
The True Cost of Assisted Living in 2025 – And How Families Are Paying For It
Understanding Senior Living Costs: Pricing Models, Discounts & Financial Assistance


