Westlake Lodge Health and Rehabilitation
Nursing Home & Nursing Care · Greeley, CO
CMS overall rating Info CMS (the Centers for Medicare & Medicaid Services) is the federal agency that rates nursing home quality. Its Overall Rating runs from 1 to 5 stars, combining health inspections, staffing, and quality measures, with inspections weighted most heavily.

Westlake Lodge Health and Rehabilitation

Nursing Home & Nursing Care · Greeley, CO
CMS overall rating Info CMS (the Centers for Medicare & Medicaid Services) is the federal agency that rates nursing home quality. Its Overall Rating runs from 1 to 5 stars, combining health inspections, staffing, and quality measures, with inspections weighted most heavily.
Calculator: See prices in your area
Westlake Lodge Health and Rehabilitation accepts Medicare, Medicaid, and private pay.

Overview of Westlake Lodge Health and Rehabilitation

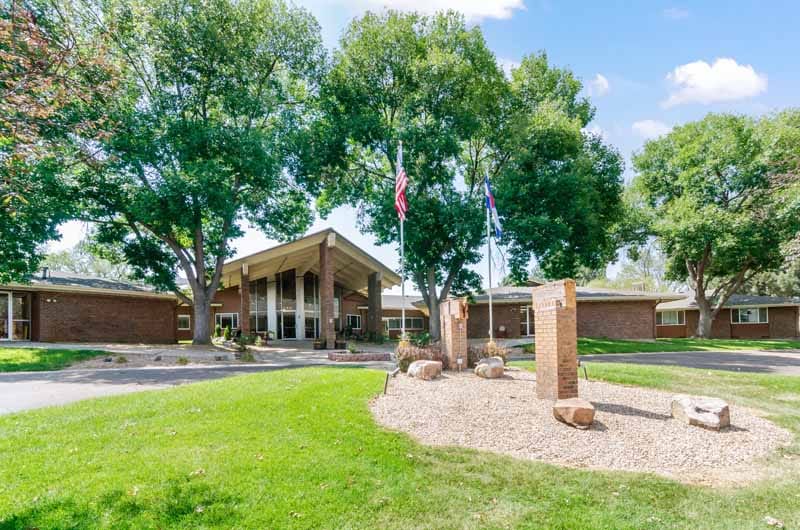
The Westlake Lodge Health & Rehabilitation Center stands as a sanctuary for seniors in need of both short-term and long-term support. With a highly skilled and knowledgeable staff specializing in nursing and medical care, this state-of-the-art facility caters to a wide range of needs. The center boasts attending physicians and registered nurses who excel at improving every resident’s situation. Their services include specialized short-stay and long-term care, comprehensive rehabilitation therapy, meticulous discharge planning, personalized medical and personal care, psychosocial support, as well as respite, palliative, and hospice care.

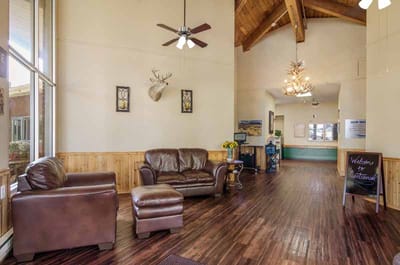
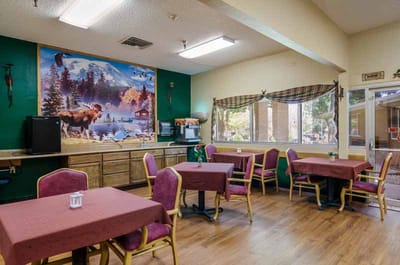
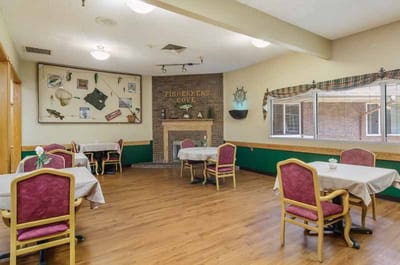
From convenient computer access with internet connectivity to comfortable communal and lounge areas, the facility prioritizes the residents’ well-being. Their offerings also include restaurant-style dining, on-site housekeeping and laundry services, a fully equipped hair salon, and pharmaceutical delivery services. With a focus on long-term care homes and top-notch nursing home facilities, the Westlake Lodge Health & Rehabilitation Center ensures a comfortable and enriching environment for seniors seeking supportive care.

(303) 268-7943

Quality ratings

Measured by Centers for Medicare & Medicaid Services (CMS)

Overall rating Info The Overall CMS Rating combines results from health inspections, staffing levels and quality measures. Health inspections carry the most weight. Staffing and quality scores can increase or decrease the final rating based on performance compared to state and national standards.
▲ 27.2% Above CO avg. ▲ 27.2% Above CO avg.CO average: 3.1Click the badge to see the full State ranking.Click here to see the full State ranking.
Health Inspection Info Based on the results of the facility's three most recent standard inspections and any complaint investigations. CMS reviews the number, scope, and severity of deficiencies, with more recent findings weighted more heavily.
▲ 44.4% Above CO avg. ▲ 44.4% Above CO avg.CO average: 2.8Click the badge to see the full State ranking.Click here to see the full State ranking.
Staffing Info Measures average nursing staff hours per resident per day, including Registered Nurses (RNs) and total nursing staff. Ratings are adjusted based on the level of care residents require and are compared to state and national benchmarks.
▼ 34.2% Below CO avg. ▼ 34.2% Below CO avg.CO average: 3.0Click the badge to see the full State ranking.Click here to see the full State ranking.
Quality Measures Info Based on clinical and physical health indicators reported to CMS, such as hospital readmissions, falls, pressure ulcers, and improvements in mobility. These measures reflect how well residents' health needs are being managed.
▼ 3.6% Below CO avg. ▼ 3.6% Below CO avg.CO average: 4.1Click the badge to see the full State ranking.Click here to see the full State ranking.

Staffing hours breakdown

Info Daily nursing hours per resident by staff type, reported to CMS. Higher is generally better — compare this facility to state and national averages to see where staffing stands.

Hours per resident per day — compared to Colorado state averages

Total nursing care / resident Info This home is ranked 171st out of 215 homes in Colorado for nurse hours. Total adjusted nursing hours per resident per day, combining RN, LPN, and aide time. CMS adjusts this for case-mix so facilities can be fairly compared.
3h 5m per day
Rank #171 / 215Nurse hours — State benchmarkedThis home is ranked 171st out of 215 homes in Colorado. Shows adjusted nurse hours per resident per day benchmarked to the Colorado average, with a ranking across 215 Colorado facilities. More hours mean more direct care. The national average is about 3.5 hrs; below 3.0 is a red flag.Rankings are based only on facilities in Colorado that report data for that category. Facilities without available data are excluded from the ranking.Click the rank badge to see the full State ranking.Click here to see the full State ranking.
This facility Colorado avg (3h 52m per day)
vs Colorado avg
-20%

5 of 6 metrics below state avg

Standout metric Weekend RN is +9% above state avg
Staff typeHours / Day / Residentvs state avg
Registered Nurse (RN) Info RNs hold the highest nursing license and can assess residents, interpret test results, and direct care plans. More RN hours per day often signals stronger clinical oversight and faster response to health changes. 43m per day ▼ 14% State avg: 50m per day · National avg: 41m per day
LPN / LVN Info Licensed Practical Nurses (LPNs) or Licensed Vocational Nurses (LVNs) deliver routine hands-on care — medication administration, wound dressing, and monitoring vital signs. They work under RN supervision and make up a large share of daily bedside care. 36m per day ▼ 11% State avg: 41m per day · National avg: 52m per day
Nurse Aide Info Certified Nurse Aides (CNAs) provide the most direct day-to-day assistance: bathing, dressing, feeding, and mobility. Nurse aide hours are typically the largest staffing category and directly affect residents' quality of life. 1h 45m per day ▼ 21% State avg: 2h 13m per day · National avg: 2h 21m per day
Weekend Total Nursing Info Combined nursing hours (RN + LPN + Nurse Aide) per resident per day on weekends. Staffing often drops on weekends — this figure reveals whether the facility maintains adequate coverage outside of weekday hours. 2h 42m per day ▼ 18% State avg: 3h 17m per day · National avg: 3h 26m per day
Physical Therapist Info Hours per resident per day provided by licensed Physical Therapists (PTs) or PT Assistants. PT services help residents recover mobility after injury or illness and are especially important for post-acute (short-stay) rehabilitation. 2m per day ▼ 70% State avg: 5m per day · National avg: 4m per day
Weekend RN Info Registered nurse hours specifically on weekends. Facilities sometimes reduce RN presence on Saturdays and Sundays — a low weekend RN figure compared to weekday hours can indicate reduced clinical oversight when most administrative staff are absent. 39m per day ▲ 9% State avg: 36m per day · National avg: 29m per day

Capacity and availability

This home usually has availability

Lower occupancy than the Colorado average: 76.5%
Occupancy rate
29.9% Rank #207 / 221Occupancy rate — State benchmarkedThis home is ranked 207th out of 221 homes in Colorado. Shows this facility's occupancy rate versus the Colorado average, with its Statewide rank out of 221. Higher occupancy signals strong local demand and financial stability.Rankings are based only on facilities in Colorado that report data for that category. Facilities without available data are excluded from the ranking.Click the rank badge to see the full State ranking.Click here to see the full State ranking.
Avg. Length of Stay
152 days
Bed community size
107-bed community Rank #131 / 533Bed count — State benchmarkedThis home is ranked 131st out of 533 homes in Colorado. Shows this facility's certified or reported bed count compared to other Colorado facilities. Larger communities may offer more amenities, programs, and on-site services for residents and families.Rankings are based only on facilities in Colorado that report data for that category. Facilities without available data are excluded from the ranking.Click the rank badge to see the full State ranking.Click here to see the full State ranking.
A larger shared setting that may offer more common spaces and organized community services.
Walk Score
Walk Score: 39 / 100 Rank #586 / 872Walk Score — State benchmarkedThis home is ranked 586th out of 872 homes in Colorado. Shows how walkable this facility's neighborhood is compared to the average Walk Score across Colorado facilities. Higher scores benefit residents, families, and staff.Rankings are based only on facilities in Colorado that report data for that category. Facilities without available data are excluded from the ranking.Click the rank badge to see the full State ranking.Click here to see the full State ranking.
Somewhat walkable. A few nearby services may be reachable on foot, but most trips require transportation.
BBB Rating
BBB Rating: A- (Not Accredited)
An independent rating from the Better Business Bureau based on factors such as complaint history, transparency, and business practices.
How BBB ratings work

About this community

License Details

CMS Certification Number65212

Staffing

Key information about the people who lead and staff this community.

Leadership

ContactMatthew Gordon, Administrator

Contact Westlake Lodge Health and Rehabilitation

Inspection History

In Colorado, the Department of Public Health and Environment, Health Facilities Division is the regulatory body that performs unannounced surveys and publishes facility inspection findings.

Since 2021 · 5 years of data 30 deficiencies

Inspection Scorecard Info This scorecard compares key inspection, citation, and complaint metrics at this facility against the Colorado state average. Metrics rated ≥15% worse than average are highlighted in red; those ≥15% better are highlighted in green.

Since 2021 vs. Colorado state average
Overall vs. CO average 0 Worse No metrics in this bucket. 2 At Avg Metrics at Colorado average:
• Total deficiencies (at CO avg)
• Deficiencies per year (at CO avg)
0 Better No metrics in this bucket.
Latest Inspection June 25, 2025 Complaint Investigation

Deficiencies Info Deficiencies are formal regulatory issues recorded during state inspections.

This FacilityCO Averagevs. CO Avg
Total deficiencies Info Formal regulatory issues recorded by inspectors across all inspection types. 3030 This facility has total deficiencies in line with the Colorado average (30 vs. CO avg 30).— At avg
Deficiencies per year Info Average deficiencies per year since 2021. 66 This facility has deficiencies per year in line with the Colorado average (6 vs. CO avg 6).— At avg

Inspection Reports Summary Info An editor-reviewed summary of the themes and findings across this facility's recent inspection reports.

  • June 25, 2025 complaint investigation found the facility gave Resident #4 another resident’s medications, causing dizziness and stomachache, with no immediate corrective action beyond staff education.
  • April 7, 2025 complaint investigation confirmed failure to transcribe warfarin orders for Resident #12, causing a blood clot and above-knee amputation after seven days without anticoagulant.
  • October 16, 2024 routine inspection cited three deficiencies for poor environmental cleanliness, including water leaks, debris, and black discoloration in vents, showers, and mechanical rooms.

Health Inspection History

Inspections since 2022
Total health inspections 5

Colorado average 4.8


Last Health inspection on Jun 2025

Total health citations
12 Rank #27 / 221Health citations — State benchmarkedThis home is ranked 27th out of 221 homes in Colorado. Shows this facility's total health deficiency citations benchmarked to the Colorado State average, with a ranking across all 221 CO facilities. Lower citation counts earn a better rank.Rankings are based only on facilities in Colorado that report data for that category. Facilities without available data are excluded from the ranking.Click the rank badge to see the full State ranking.Click here to see the full State ranking.

Colorado average 24.8

Citations per inspection
2.4 Rank #17 / 221Citations per inspection — State benchmarkedThis home is ranked 17th out of 221 homes in Colorado. Shows average deficiency citations per CMS inspection for this facility versus the Colorado mean across 221 facilities with citation data. Lower is better.Rankings are based only on facilities in Colorado that report data for that category. Facilities without available data are excluded from the ranking.Click the rank badge to see the full State ranking.Click here to see the full State ranking.

Colorado average 5.2


Health citations are formal notices following inspections when they fail to comply with safety and care standards.

9 of 12 citations resulted from standard inspections; and 3 of 12 resulted from complaint investigations.

Breakdown of citation severity (last 4 years)
Critical health citations
1
150% worse than Colorado average

Colorado average: 0.4


Serious health citations
0
100% better than Colorado average

Colorado average: 2.1

1 critical citation Colorado average: 0.4

0 serious citations Colorado average: 2.1

11 moderate citations Colorado average: 22.2

0 minor citations Colorado average: 0.2
Citations history (last 4 years)
Pharmacy moderate citation Jun 25, 2025
Corrected

Pharmacy critical citation Apr 07, 2025
Corrected

Environmental moderate citation Oct 16, 2024
Corrected

Infection Control moderate citation Apr 11, 2024
Corrected

Staffing Data

Reporting period: October 1 – December 31, 2025 (Q4 2025). Source: CMS Payroll-Based Journal report.

Total staff 176
Employees 129
Contractors 47
Staff to resident ratio 2.15 : 1
14% more staff per resident than Colorado average
Colorado average ratio: 1.88 : 1 Colorado average ratio: 1.88 : 1See full Colorado ranking
Avg staff/day 41
Average shift 8.6 hours
0% compared with Colorado average
Colorado average: 8.3 hours Colorado average shift: 8.3 hoursSee full Colorado ranking
Total staff hours (quarter) 32,421

Nursing staff breakdown

Q4 2025 · Oct 1 – Dec 31 More info This data comes from the CMS Payroll-Based Journal report covering October 1 – December 31, 2025.
Registered Nurse

Manages medical care and health needs.

RN Staff Info 16 total: 12 full-time employees and 4 contractors. 16
Average shift length Info Average shift length. Calculated as total hours divided by days worked and average staff per day. 9.9 hours
Licensed Practical Nurse

Assists with medical care and medications.

LPN Staff Info 23 total: 16 full-time employees and 7 contractors. 23
Average shift length Info Average shift length. Calculated as total hours divided by days worked and average staff per day. 9.6 hours
Certified Nursing Assistant

Helps with daily care and mobility.

CNA Staff Info 91 total: 56 full-time employees and 35 contractors. 91
Average shift length Info Average shift length. Calculated as total hours divided by days worked and average staff per day. 8.6 hours

Contractor staffing

Q4 2025 · Oct 1 – Dec 31 More info This data comes from the CMS Payroll-Based Journal report covering October 1 – December 31, 2025.

Total hours from contractors

3.3%

1,057 contractor hours this quarter

Certified Nursing Assistant: 35 Licensed Practical Nurse: 7 Registered Nurse: 4 RN Director of Nursing: 1

Staff by category

Q4 2025 · Oct 1 – Dec 31 More info This data comes from the CMS Payroll-Based Journal report covering October 1 – December 31, 2025.
Certified Nursing Assistant56359113,55992100%8.6
Registered Nurse124164,94192100%9.9
Licensed Practical Nurse167233,15092100%9.6
Other Dietary Services Staff100101,84392100%7.9
RN Director of Nursing3141,6816773%8.7
Dental Services Staff4041,6007076%8.1
Speech Language Pathologist3038196975%6.4
Qualified Social Worker5057907177%6.8
Nurse Practitioner1015946672%9
Physical Therapy Aide4045606368%6.7
Occupational Therapy Aide2025406874%7.4
Physical Therapy Assistant2025337177%7.2
Administrator1015286672%8
Dietitian1014986571%7.7
Medication Aide/Technician4044073740%9.2
Respiratory Therapy Technician1012024549%4.5
Clinical Nurse Specialist3031762022%8
Occupational Therapy Assistant101322%1.3
91 Certified Nursing Assistant
% of Days 100%
16 Registered Nurse
% of Days 100%
23 Licensed Practical Nurse
% of Days 100%
10 Other Dietary Services Staff
% of Days 100%
4 RN Director of Nursing
% of Days 73%
4 Dental Services Staff
% of Days 76%
3 Speech Language Pathologist
% of Days 75%
5 Qualified Social Worker
% of Days 77%
1 Nurse Practitioner
% of Days 72%
4 Physical Therapy Aide
% of Days 68%
2 Occupational Therapy Aide
% of Days 74%
2 Physical Therapy Assistant
% of Days 77%
1 Administrator
% of Days 72%
1 Dietitian
% of Days 71%
4 Medication Aide/Technician
% of Days 40%
1 Respiratory Therapy Technician
% of Days 49%
3 Clinical Nurse Specialist
% of Days 22%
1 Occupational Therapy Assistant
% of Days 2%

Penalties and fines

Includes penalties issued in 2025

Federal penalties imposed by CMS for regulatory violations, including civil money penalties (fines) and denials of payment for new Medicare/Medicaid admissions.

Source: CMS Penalties Database (Data as of Jan 2026)

Total fines amount $22K Rank #115 / 221Federal fines — State benchmarkedThis home is ranked 115th out of 221 homes in Colorado. Shows this facility's cumulative CMS federal fine dollars versus the Colorado average among facilities with fines, and where it ranks among 221 facilities in the pool. Lower total dollars mean a better rank.Rankings are based only on facilities in Colorado that report data for that category. Facilities without available data are excluded from the ranking.Click the rank badge to see the full State ranking.Click here to see the full State ranking.
45% lower than Colorado average

Colorado average: $40K

Number of fines 1
55% fewer fines than Colorado average

Colorado average: 2.2

Payment Denials Info Serious action where Medicare and/or Medicaid temporarily stops payments for new residents until issues are fixed. 0
100% fewer payment denials than Colorado average

Colorado average: 0.3

Fines amount comparison
This facility $22K
Colorado average $40K
Penalty History

Penalties are imposed by CMS for violations of federal nursing home regulations.

1 penalty in the past 3 years

Apr 7, 2025 · $22K

Civil Money Penalty Info Fines imposed for noncompliance, which can be assessed per day or per instance of violation. Apr 7, 2025
$22K

Last updated: Jan 2026

Quality of care over time

These measures show how residents usually do over time at this home, based on health outcomes and preventive care.

High-risk clinical events score Info A composite score based on pressure ulcers, falls with injury, weight loss, walking ability decline, and activities of daily living decline. 6.2
31% better than Colorado average

Colorado average: 9.0

Functional decline score Info A composite score based on activities of daily living decline, walking ability decline, and incontinence. 17.0
10% better than Colorado average

Colorado average: 18.8

Long-stay resident measures
Significantly above average Colorado avg: 3.9 Info CMS star rating based on long-stay quality measure performance. 5 stars = significantly above average, 1 star = significantly below average.
Need for Help with Daily Activities Increased Info Percent of long-stay residents whose need for help with daily activities has increased 9.9%
38% better than Colorado average

Colorado average: 16.0%

Walking Ability Worsened Info Percent of long-stay residents whose ability to move independently worsened 9.4%
45% better than Colorado average

Colorado average: 17.0%

Low Risk Residents with Bowel/Bladder Incontinence Info Percent of low risk long-stay residents who lose control of their bowels or bladder 31.6%
36% worse than Colorado average

Colorado average: 23.2%

Falls with Major Injury Info Percent of long-stay residents experiencing one or more falls with major injury 3.7%
11% worse than Colorado average

Colorado average: 3.3%

High Risk Residents with Pressure Ulcers Info Percent of long-stay high risk residents with pressure ulcers 2.3%
42% better than Colorado average

Colorado average: 3.9%

Urinary Tract Infection Info Percent of long-stay residents with a urinary tract infection 0.0%
100% better than Colorado average

Colorado average: 1.4%

Lost Too Much Weight Info Percent of long-stay residents who lose too much weight 5.9%
14% worse than Colorado average

Colorado average: 5.2%

Depressive Symptoms Info Percent of long-stay residents who have depressive symptoms 2.1%
70% better than Colorado average

Colorado average: 7.2%

Antipsychotic Use Info Percent of long-stay residents who received an antipsychotic medication 21.3%
14% worse than Colorado average

Colorado average: 18.8%

Pneumococcal Vaccine Info Percent of long-stay residents assessed and appropriately given the pneumococcal vaccine 87.0%
7% worse than Colorado average

Colorado average: 93.3%

Influenza Vaccine Info Percent of long-stay residents assessed and appropriately given the seasonal influenza vaccine 77.2%
18% worse than Colorado average

Colorado average: 94.7%

Hospitalizations per 1,000 days Info Number of hospitalizations per 1,000 long-stay resident days. 1.31
In line with Colorado average

Colorado average: 1.30

ED visits per 1,000 days Info Number of outpatient emergency department visits per 1,000 long-stay resident days. 1.43
14% better than Colorado average

Colorado average: 1.67

Short-stay resident measures
Average Colorado avg: 2.7 Info CMS star rating based on short-stay quality measure performance. 5 stars = much above average, 1 star = much below average.
Pneumococcal Vaccine Info Percent of short-stay residents assessed and appropriately given the pneumococcal vaccine 66.3%
14% worse than Colorado average

Colorado average: 76.6%

Antipsychotic medication increase Info Percent of short-stay residents who newly received an antipsychotic medication 1.6%
14% worse than Colorado average

Colorado average: 1.4%

Influenza Vaccine Info Percent of short-stay residents assessed and appropriately given the seasonal influenza vaccine 75.3%
In line with Colorado average

Colorado average: 75.6%

Falls with major injury Info Percentage of SNF residents who experience falls with major injury during their stay. 0.0%
100% better than Colorado average

Colorado average: 0.8%

Ability to care for self at discharge Info Percentage of residents at or above expected ability to care for themselves at discharge. 56.0%
In line with Colorado average

Colorado average: 53.7%

Successful return to home or community Info Rate of successful return to home or community from a skilled nursing facility. 46.2%
9% worse than Colorado average

Colorado average: 50.6%

Breakdown by payment type

Medicare

22% of new residents, usually for short-term rehab.

Typical stay 1 - 2 months

Private pay

63% of new residents, often for short stays.

Typical stay 2 months

Medicaid

15% of new residents, often for long-term daily care.

Typical stay 2 years

Facility Characteristics

Source: CMS Long-Term Care Facility Characteristics (Data as of Jan 2026)

Total residents 82
Medicare
4
4.9% of residents
Medicaid
46
56.1% of residents
Private pay or other
32
39% of residents
Programs & Services
Residents Group

Residents meet regularly to discuss policies, care quality, and activities

Active Resident Council

Organized group of residents that meets regularly to discuss facility policies, quality of life, and activities.

Finances and operations

Based on CMS SNF Cost Report for fiscal year ending in 12/2023.

Voluntary non-profit community
Operated by a church.
Net patient revenue Info Net patient revenue — what the home actually collects for resident care, after contractual allowances, bad debt and discounts are subtracted from its gross charges (CMS cost report, Worksheet G-3). It covers resident care only; money the home earns from other sources is shown separately as "Other income."
$8.7M
Net patient income Info Net patient income: net patient revenue minus the home's total operating expenses. A positive figure means it earns more from resident care than it spends to deliver it; a negative figure means the opposite. It excludes non-operating "other income."
-$1.8M
Voluntary non-profit community Operated by a church.
Net patient revenue Info Net patient revenue — what the home actually collects for resident care, after contractual allowances, bad debt and discounts are subtracted from its gross charges (CMS cost report, Worksheet G-3). It covers resident care only; money the home earns from other sources is shown separately as "Other income."
$8.7M Rank #122 / 221Revenue — State benchmarkedThis home is ranked 122nd out of 221 homes in Colorado. Shows this facility's annual revenue compared to the Colorado average. Higher revenue generally means more resources for staffing and capital — read alongside Payroll %.Rankings are based only on facilities in Colorado that report data for that category. Facilities without available data are excluded from the ranking.Click the rank badge to see the full State ranking.Click here to see the full State ranking.
Net patient income Info Net patient income: net patient revenue minus the home's total operating expenses. A positive figure means it earns more from resident care than it spends to deliver it; a negative figure means the opposite. It excludes non-operating "other income."
-$1.8M
Other income Info Money the home earns outside of resident care — such as investments, grants, rentals and other non-operating sources (CMS cost report, Worksheet G-3). It is tracked separately from net patient revenue: it is not part of that figure, and it is not included in net patient income.
$38.0K
Payroll costs Info Staff salaries plus wage-related costs — benefits such as payroll taxes, health insurance and retirement — from the home's own accounting records (CMS cost report, Worksheet A). Contract or agency labor is counted separately, under other operating costs. Rank #98 / 221Payroll — State benchmarkedThis home is ranked 98th out of 221 homes in Colorado. Shows total annual staff payroll benchmarked to the Colorado average. Higher payroll investment relative to peers often signals better staffing and less reliance on cheaper contract labor.Rankings are based only on facilities in Colorado that report data for that category. Facilities without available data are excluded from the ranking.Click the rank badge to see the full State ranking.Click here to see the full State ranking.
$4.2M 48.8% of net patient revenue Info Payroll as a share of revenue: staff salaries and wage-related benefits divided by net patient revenue. A higher figure means more of each revenue dollar goes to staff pay. Rank #85 / 221Payroll % — State benchmarkedThis home is ranked 85th out of 221 homes in Colorado. Shows payroll as a percentage of revenue versus the Colorado average. Well-run Colorado facilities typically land around 59–66% — the top third Statewide. Below 25% may signal understaffing or heavy agency use — read with Staffing ratings.Rankings are based only on facilities in Colorado that report data for that category. Facilities without available data are excluded from the ranking.Click the rank badge to see the full State ranking.Click here to see the full State ranking.
Other operating costs Info Everything it costs to run the home apart from payroll — food, utilities, supplies, maintenance, contract labor and administration. Calculated as total operating expense minus payroll (staff salaries and wage-related benefits).
$6.3M
Total costs Info The home's total operating expense for the year — all the costs of running it, salaries included (CMS cost report, Worksheet G-3).
$10.5M

What does this home offer?

Housing options icon

Housing Options: Private Rooms / Semi-Private Rooms

Building type icon
Building type icon

Building Type: Single-story

Transportation services icon

Transportation Services

Fitness and recreation icon

Fitness and Recreation

Who this home usually serves

TYPE OF STAY

Primarily short stays

Residents typically stay for brief periods, with frequent admissions and discharges throughout the year.

Most new residents arrive under private pay (63% of admissions), and a typical private pay stay runs around 2 months.

Admissions
172 total

Coverage residents most often arrive under.

Medicare 22%
Private pay 63%
Medicaid 15%
Discharges
181 total

Coverage residents most often leave under.

Medicare 15%
Private pay 58%
Medicaid 27%

Places of interest near Westlake Lodge Health and Rehabilitation

Address 1.7 miles from city center Info Estimated distance in miles from Greeley's city center to Westlake Lodge Health and Rehabilitation's address, calculated via Google Maps.

Calculate Travel Distance to Westlake Lodge Health and Rehabilitation

Add your location

Address

Compare Nursing Homes around Greeley

The information below is reported by the Colorado Department of Public Health and Environment, Health Facilities Division.

4 facilities compared · CMS & CO Dept. of Health data

Life Care Center of Greeley
NH
Greeley
124
Facility 124
CO AVG 76
Rank #75 / 533
75.4%
Facility 75.4%
CO AVG 76.5%
Rank #122 / 221
-1%
3.35
Facility 3.35
CO AVG 3.86
Rank #139 / 215
+2%-13%
$12.3k
Facility $12.3k
CO AVG $39.2k
Rank #110 / 221
6
Facility 6
CO AVG 24.8
Rank #8 / 221
2.0
Facility 2.0
CO AVG 5.2
Rank #6 / 221
369-
56
Facility 56
CO AVG 51
Rank #409 / 872
Daniel Gauger
$10.3M
Facility $10.3M
CO AVG $11.2M
Rank #84 / 221
$6.2M
Facility $6.2M
CO AVG $4.9M
Rank #104 / 221
60.1%
Facility 60.1%
CO AVG 46.6%
Rank #147 / 221
65368
Broadview Health and Rehabilitation
NH
NC
Greeley
100
Facility 100
CO AVG 76
Rank #161 / 533
80.6%
Facility 80.6%
CO AVG 76.5%
Rank #93 / 221
+5%
3.01
Facility 3.01
CO AVG 3.86
Rank #177 / 215
-37%-22%
$0
Facility $0
CO AVG $39.2k
Rank #1 / 221
16
Facility 16
CO AVG 24.8
Rank #54 / 221
2.3
Facility 2.3
CO AVG 5.2
Rank #10 / 221
192-
76
Facility 76
CO AVG 51
Rank #151 / 872
-
$8.8M
Facility $8.8M
CO AVG $11.2M
Rank #102 / 221
$4.0M
Facility $4.0M
CO AVG $4.9M
Rank #118 / 221
45.3%
Facility 45.3%
CO AVG 46.6%
Rank #147 / 221
65219
Fairacres Manor
NH
MC
NC
RC
Greeley (18Th Avenue)
116
Facility 116
CO AVG 76
Rank #97 / 533
89.4%
Facility 89.4%
CO AVG 76.5%
Rank #55 / 221
+17%
4.08
Facility 4.08
CO AVG 3.86
Rank #58 / 215
+27%+6%
$0
Facility $0
CO AVG $39.2k
Rank #1 / 221
17
Facility 17
CO AVG 24.8
Rank #68 / 221
5.7
Facility 5.7
CO AVG 5.2
Rank #142 / 221
1105-
57
Facility 57
CO AVG 51
Rank #392 / 872
Jill Nelson
$13.5M
Facility $13.5M
CO AVG $11.2M
Rank #50 / 221
$8.6M
Facility $8.6M
CO AVG $4.9M
Rank #49 / 221
63.4%
Facility 63.4%
CO AVG 46.6%
Rank #120 / 221
65211
Westlake Lodge Health and Rehabilitation
NH
NC
Greeley (29Th Avenue Place)
107
Facility 107
CO AVG 76
Rank #131 / 533
29.9%
Facility 29.9%
CO AVG 76.5%
Rank #207 / 221
-61%
3.08
Facility 3.08
CO AVG 3.86
Rank #171 / 215
-35%-20%
$14.1k
Facility $14.1k
CO AVG $39.2k
Rank #115 / 221
12
Facility 12
CO AVG 24.8
Rank #27 / 221
2.4
Facility 2.4
CO AVG 5.2
Rank #17 / 221
132A-
39
Facility 39
CO AVG 51
Rank #586 / 872
-
$8.7M
Facility $8.7M
CO AVG $11.2M
Rank #122 / 221
$4.2M
Facility $4.2M
CO AVG $4.9M
Rank #98 / 221
48.8%
Facility 48.8%
CO AVG 46.6%
Rank #85 / 221
65212

Financial Assistance for
Nursing Home in Colorado

Westlake Lodge Health and Rehabilitation is located in Greeley, Colorado.
Here are the financial assistance programs available to residents in Colorado.

Get Financial aid guidance

Elderly, Blind, and Disabled Waiver

Colorado Medicaid EBD Waiver

Age 65+ or disabled
General Colorado resident, Medicaid- eligible, nursing home-level care need.
Income Limits (2025) ~$2,829/month 300% FBR, individual
Asset Limits $2,000 (individual), $3,000 (couple).
CO

Requires level-of-care assessment by case manager.

Benefits
Personal care (5-7 hours/day) Respite care (up to 240 hours/year) Adult day care ($65/day) Home modifications ($1,500 avg.)

Old Age Pension (OAP) Health Care Program

Colorado OAP

Age 60+
General Colorado resident.
Income Limits ~$1,215/month individual
Asset Limits $2,000 individual
CO

Supplements SSI; limited medical coverage.

Benefits
Cash (~$100-$800/month) Limited in-home care (2-3 hours/week) Medical assistance

Program of All-Inclusive Care for the Elderly (PACE)

Colorado Medicaid PACE

Age 55+
General Colorado resident, nursing home-level care need, safe with PACE support.
Income Limits (2025) ~$2,829/month 300% FBR
Asset Limits $2,000 (individual), $3,000 (couple).
CO

Limited to specific regions (e.g., Denver, Pueblo).

Benefits
All-inclusive care—personal care (5-7 hours/day) Meals Transportation Therapy Medical visits

Home Care Allowance (HCA)

Colorado Home Care Allowance (HCA)

Age
General Seniors typically 65+, Age 5+ with disability, Colorado resident, financial/functional need.
Income Limits (2025) ~$1,004/month individual, stricter than waivers
Asset Limits $2,000 (individual), $3,000 (couple).
CO

Must need help with ADLs; not Medicaid-waiver eligible.

Benefits
Personal care (~4-6 hours/day, paid to provider) E.g. Bathing Dressing

Frequently Asked Questions about Westlake Lodge Health and Rehabilitation

What neighborhood is Westlake Lodge Health and Rehabilitation in?

Westlake Lodge Health and Rehabilitation is in the 29th Avenue Place neighborhood of Greeley.

Is Westlake Lodge Health and Rehabilitation in a walkable area?

Westlake Lodge Health and Rehabilitation has a walk score of 39. Somewhat walkable. A few nearby services may be reachable on foot, but most trips require transportation.

What is the occupancy rate at Westlake Lodge Health and Rehabilitation?

Westlake Lodge Health and Rehabilitation's occupancy is 70.4%.

Are there photos of Westlake Lodge Health and Rehabilitation?

Yes — there are 4 photos of Westlake Lodge Health and Rehabilitation in the photo gallery on this page.

What is the address of Westlake Lodge Health and Rehabilitation?

Westlake Lodge Health and Rehabilitation is located at 1637 29Th Ave Pl, Greeley, CO 80634.

What is the phone number of Westlake Lodge Health and Rehabilitation?

(303) 268-7943 will put you in contact with the team at Westlake Lodge Health and Rehabilitation.

Is Westlake Lodge Health and Rehabilitation Medicare or Medicaid certified?

Yes — Westlake Lodge Health and Rehabilitation is a CMS-certified provider of Medicare and Medicaid.

Guides for Better Senior Living

Care Cost Calculator: See Prices in Your Area

Nursing Home Data Explorer

Don’t Wait Too Long: 7 Red Flag Signs Your Parent Needs Assisted Living Now

The True Cost of Assisted Living in 2025 – And How Families Are Paying For It

Understanding Senior Living Costs: Pricing Models, Discounts & Financial Assistance