


Total health inspections
16
Texas average 7.4
Last Health inspection on Oct 2025
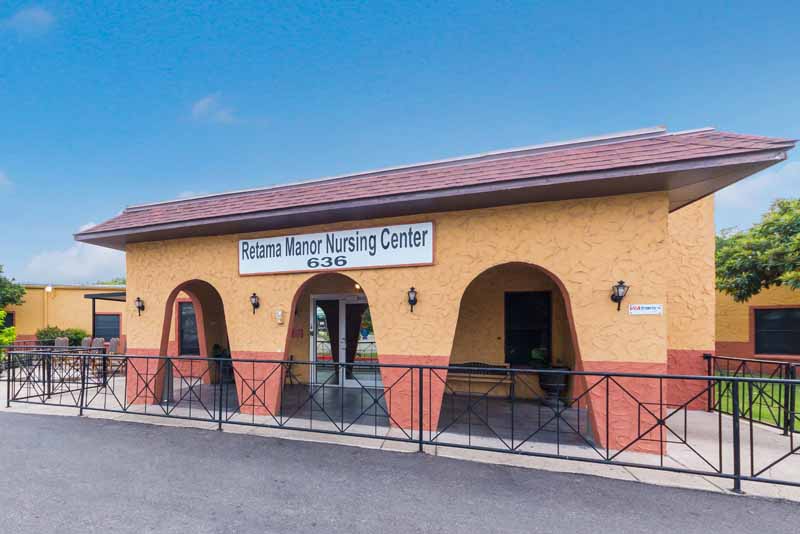
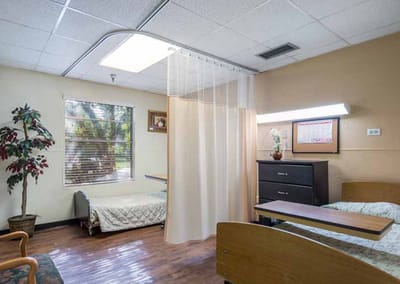
Nestled in San Antonio, Texas, San Antonio West Nursing and Rehab is a senior care community committed to providing the best possible care for aging adults. The facility’s prime location allows residents to easily access the local activities and entertainment that the vibrant city has to offer. San Antonio West Nursing and Rehab offers a range of services, including skilled nursing and short-term respite care, to ensure that seniors get the most out of their retirement years. The community’s roomy, well-designed units and comfortable, secure atmosphere are complemented by dedicated staff who work hard to maintain the dignity and independence of each resident.
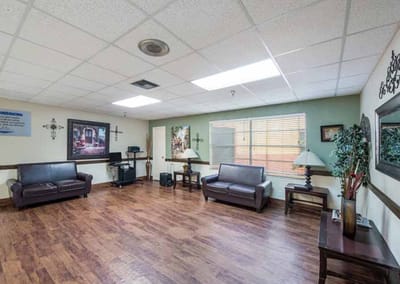
Residents enjoy a diverse array of amenities, including freshly prepared meals, private dining options, and a full schedule of social, educational, and entertaining activities. The facility’s structured program helps residents maintain a high quality of life, encouraging them to socialize and develop meaningful friendships with their peers.
| Staff type | Hours / Day / Resident | vs state avg |
|---|---|---|
|
Registered Nurse (RN)
| 21m per day | ▼ 18% State avg: 26m per day · National avg: 41m per day |
|
LPN / LVN
| 51m per day | ▼ 11% State avg: 57m per day · National avg: 52m per day |
|
Nurse Aide
| 1h 31m per day | ▼ 25% State avg: 2h 1m per day · National avg: 2h 21m per day |
|
Weekend Total Nursing
| 2h 21m per day | ▼ 21% State avg: 2h 59m per day · National avg: 3h 26m per day |
|
Physical Therapist
| 4m per day | ▼ 9% State avg: 4m per day · National avg: 4m per day |
|
Weekend RN
| 19m per day | ▼ 12% State avg: 21m per day · National avg: 29m per day |
San Antonio West Nursing and Rehab is administered by Denise C Rios.
Key information about the people who lead and staff this community.
In Texas, the Health and Human Services Commission (HHSC) is the primary regulatory body that conducts unannounced inspections and publishes quality reports for all long-term care homes.
Citations
| This Facility | TX Average | vs. TX Avg |
|---|---|---|---|
|
Total citations
| 2 | 6 | This facility has 67% fewer total citations than a typical Texas nursing home (2 vs. TX avg 6).↓ 67% better |
|
Health citations
| 1 | 2 | This facility has 50% fewer health citations than a typical Texas nursing home (1 vs. TX avg 2).↓ 50% better |
|
Life safety citations
| 1 | 6 | This facility has 83% fewer life safety citations than a typical Texas nursing home (1 vs. TX avg 6).↓ 83% better |
Texas average 7.4
Last Health inspection on Oct 2025
Texas average 25.9
Texas average 3.67
Health citations are formal notices following inspections when they fail to comply with safety and care standards.
23 of 49 citations resulted from standard inspections; 24 of 49 resulted from complaint investigations; and 2 of 49 came from combined inspections (standard and complaint).
Texas average: 2
Texas average: 0.4
Reporting period: October 1 – December 31, 2025 (Q4 2025). Source: CMS Payroll-Based Journal report.
Manages medical care and health needs.
Assists with medical care and medications.
Helps with daily care and mobility.
Total hours from contractors
1,011 contractor hours this quarter
| Certified Nursing Assistant | 44 | 7 | 51 | 12,053 | 92 | 100% | 7.6 |
| Licensed Practical Nurse | 23 | 34 | 57 | 6,172 | 92 | 100% | 8.1 |
| Registered Nurse | 12 | 2 | 14 | 2,789 | 92 | 100% | 7.2 |
| Medication Aide/Technician | 8 | 2 | 10 | 1,989 | 92 | 100% | 9.7 |
| Physical Therapy Aide | 4 | 0 | 4 | 1,683 | 77 | 84% | 7.1 |
| RN Director of Nursing | 4 | 0 | 4 | 1,635 | 65 | 71% | 7.5 |
| Speech Language Pathologist | 6 | 0 | 6 | 1,482 | 73 | 79% | 6.8 |
| Other Dietary Services Staff | 2 | 0 | 2 | 877 | 71 | 77% | 7.2 |
| Qualified Social Worker | 6 | 1 | 7 | 568 | 73 | 79% | 5.4 |
| Respiratory Therapy Technician | 2 | 0 | 2 | 564 | 66 | 72% | 7.8 |
| Administrator | 1 | 0 | 1 | 512 | 64 | 70% | 8 |
| Nurse Practitioner | 1 | 0 | 1 | 504 | 63 | 68% | 8 |
| Mental Health Service Worker | 1 | 0 | 1 | 504 | 63 | 68% | 8 |
| Occupational Therapy Aide | 0 | 1 | 1 | 120 | 14 | 15% | 8.6 |
| Feeding Assistant | 0 | 2 | 2 | 80 | 27 | 29% | 3 |
| Other Physician | 0 | 2 | 2 | 57 | 16 | 17% | 3 |
| Occupational Therapy Assistant | 0 | 1 | 1 | 44 | 6 | 7% | 7.3 |
Includes penalties issued in 2024-2025
Federal penalties imposed by CMS for regulatory violations, including civil money penalties (fines) and denials of payment for new Medicare/Medicaid admissions.
Source: CMS Penalties Database (Data as of Jan 2026)
Texas average: $80K
Texas average: 2.5
Texas average: 0.2
Penalties are imposed by CMS for violations of federal nursing home regulations.
6 penalties in the past 3 years
Multiple penalties were reported in the last 3 years.
Last updated: Jan 2026
These measures show how residents usually do over time at this home, based on health outcomes and preventive care.
Texas average: 8.6
Texas average: 16.0
Texas average: 16.2%
Texas average: 16.2%
Texas average: 15.7%
Texas average: 3.2%
Texas average: 4.4%
Texas average: 0.8%
Texas average: 3.5%
Texas average: 2.9%
Texas average: 7.9%
Texas average: 97.3%
Texas average: 97.9%
Texas average: 2.13
Texas average: 2.07
Texas average: 90.4%
Texas average: 1.4%
Texas average: 88.0%
Texas average: 25.9%
Texas average: 12.0%
Texas average: 0.8%
Texas average: 53.7%
Quality measures are calculated from Minimum Data Set (MDS) assessments. For most measures, lower percentages indicate better care quality.
35% of new residents, usually for short-term rehab.
3% of new residents, often for short stays.
63% of new residents, often for long-term daily care.
Source: CMS Long-Term Care Facility Characteristics (Data as of Jan 2026)
Residents meet regularly to discuss policies, care quality, and activities
Family members meet regularly to discuss policies, care quality, and activities
Organized group of family members that meets regularly to discuss facility policies, resident care, and activities.
Organized group of residents that meets regularly to discuss facility policies, quality of life, and activities.
Data sourced from CMS Long-Term Care Facility Characteristics quarterly report. Payer mix reflects the current resident census by primary payment source.
Historical financial and operational data for San Antonio West Nursing and Rehab from 2012–2023, based on CMS SNF Cost Reports.
Key figures below are for fiscal year ending in 12/2023.
Based on CMS SNF Cost Report for fiscal year ending in 12/2023.
No pets allowed
Building Type: Single-story
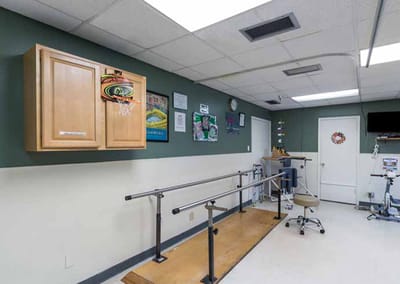
Fitness and Recreation
Most residents stay for extended periods and receive ongoing daily care.
Most new residents arrive under Medicaid (63% of admissions), and a typical Medicaid stay runs around 8 - 9 months.
Coverage residents most often arrive under.
Coverage residents most often leave under.
![]() 3.4 miles from city center
3.4 miles from city center
![]() Estimated distance in miles from San Antonio's city center to San Antonio West Nursing and Rehab's address, calculated via Google Maps.
Estimated distance in miles from San Antonio's city center to San Antonio West Nursing and Rehab's address, calculated via Google Maps.
Add your location
Info below is compiled from CMS reports & the TX Health & Human Services Commission (HHSC), senior community websites & trusted data sources such as Walk Score & BBB.
Communities are listed from highest to lowest based on our ranking methodology.
| The Army Residence Community Health Care Center | NH AL IL MC SNF | San Antonio (Northeast Side) | 30
Facility
30
TX AVG
79
Rank
#767 / 972 | - | - | 4.74
Facility
4.74
TX AVG
3.63
Rank
#32 / 239 | -10% | +31% | $0
Facility
$0
TX AVG
$81.8k
Rank
#1 / 244 | 18
Facility
18
TX AVG
25.9
Rank
#82 / 241 | 4.5
Facility
4.5
TX AVG
3.7
Rank
#200 / 241 | - | 59 | - |
6
Facility
6
TX AVG
41
Rank
#1284 / 1389 | Army Retirement Residence Foundation San Antonio | $33.5MFiscal year ending 06/2024
Facility
$33.5MFiscal year ending 06/2024
TX AVG
$8.4M
Rank
#5 / 245 | $16.5MFiscal year ending 06/2024
Facility
$16.5MFiscal year ending 06/2024
TX AVG
$3.5M
Rank
#5 / 245 | 49.4%Fiscal year ending 06/2024
Facility
49.4%Fiscal year ending 06/2024
TX AVG
47%
Rank
#217 / 245 | 675697 | ||||
| Blue Skies of Texas East | NH AL HOS IL MC SNF | San Antonio (Valley High North) | 24
Facility
24
TX AVG
79
Rank
#782 / 972 | - | - | 6.51
Facility
6.51
TX AVG
3.63
Rank
#2 / 239 | -7% | +79% | $17.3k
Facility
$17.3k
TX AVG
$81.8k
Rank
#104 / 244 | 31
Facility
31
TX AVG
25.9
Rank
#186 / 241 | 3.1
Facility
3.1
TX AVG
3.7
Rank
#111 / 241 | 2 | 53 | - |
47
Facility
47
TX AVG
41
Rank
#585 / 1389 | Air Force Village Inc | $10.3MFiscal year ending 06/2024
Facility
$10.3MFiscal year ending 06/2024
TX AVG
$8.4M
Rank
#51 / 245 | $5.4MFiscal year ending 06/2024
Facility
$5.4MFiscal year ending 06/2024
TX AVG
$3.5M
Rank
#38 / 245 | 52.2%Fiscal year ending 06/2024
Facility
52.2%Fiscal year ending 06/2024
TX AVG
47%
Rank
#66 / 245 | 676041 | ||||
| Lakeside Nursing and Rehabilitation Center | NH SNF | San Antonio (Far West Side) | 120
Facility
120
TX AVG
79
Rank
#204 / 972 |
93.5%
Facility
93.5%
TX AVG
67.3
Rank
#16 / 195 | +39% | 3.42
Facility
3.42
TX AVG
3.63
Rank
#144 / 239 | +35% | -6% | $14.6k
Facility
$14.6k
TX AVG
$81.8k
Rank
#91 / 244 | 24
Facility
24
TX AVG
25.9
Rank
#145 / 241 | 3.4
Facility
3.4
TX AVG
3.7
Rank
#138 / 241 | 3 | 110 | - |
19
Facility
19
TX AVG
41
Rank
#1111 / 1389 | Crystal Lake Healthcare, Inc | $11.7MFiscal year ending 03/2024
Facility
$11.7MFiscal year ending 03/2024
TX AVG
$8.4M
Rank
#63 / 245 | $7.0MFiscal year ending 03/2024
Facility
$7.0MFiscal year ending 03/2024
TX AVG
$3.5M
Rank
#55 / 245 | 60.2%Fiscal year ending 03/2024
Facility
60.2%Fiscal year ending 03/2024
TX AVG
47%
Rank
#116 / 245 | 676325 | ||||
| Saint Francis Nursing Home | NH AL IL | San Antonio (Midtown) | 116
Facility
116
TX AVG
79
Rank
#268 / 972 | - | - | 3.93
Facility
3.93
TX AVG
3.63
Rank
#68 / 239 | - | +8% | $0
Facility
$0
TX AVG
$81.8k
Rank
#1 / 244 | - | - | - | 92 | - |
71
Facility
71
TX AVG
41
Rank
#124 / 1389 | - | - | - | - | 45F410 | ||||
| San Antonio West Nursing and Rehab | NH SNF | San Antonio (Edgewood) | 135
Facility
135
TX AVG
79
Rank
#110 / 972 | - | - | 2.92
Facility
2.92
TX AVG
3.63
Rank
#218 / 239 | +10% | -20% | $373.4k
Facility
$373.4k
TX AVG
$81.8k
Rank
#243 / 244 | 49
Facility
49
TX AVG
25.9
Rank
#224 / 241 | 3.1
Facility
3.1
TX AVG
3.7
Rank
#111 / 241 | 6 | 13 | - |
53
Facility
53
TX AVG
41
Rank
#431 / 1389 | Maverick County Hospital Distict | $7.1MFiscal year ending 12/2023
Facility
$7.1MFiscal year ending 12/2023
TX AVG
$8.4M
Rank
#181 / 245 | $0.0kFiscal year ending 12/2023
Facility
$0.0kFiscal year ending 12/2023
TX AVG
$3.5M
Rank
#204 / 245 | 0%Fiscal year ending 12/2023
Facility
0%Fiscal year ending 12/2023
TX AVG
47%
Rank
#171 / 245 | 675002 |
San Antonio West Nursing and Rehab is located in San Antonio, Texas.
Here are the financial assistance programs available to residents in Texas.
San Antonio West Nursing and Rehab is in the Edgewood neighborhood of San Antonio.
San Antonio West Nursing and Rehab is legally operated by Maverick County Hospital District, and administered by Denise C Rios.
San Antonio West Nursing and Rehab has a walk score of 53. Moderately walkable. Some errands can be accomplished on foot, with a mix of nearby amenities.
According to TX state health department records, San Antonio West Nursing and Rehab's license number is 308716.
According to TX state health department records, San Antonio West Nursing and Rehab's license expires on January 8, 2028.
San Antonio West Nursing and Rehab's occupancy is 54.4%.
San Antonio West Nursing and Rehab has been operating for approximately 53 years, based on available licensing and registration records.
Care Cost Calculator: See Prices in Your Area
Nursing Home Data Explorer
Don’t Wait Too Long: 7 Red Flag Signs Your Parent Needs Assisted Living Now
The True Cost of Assisted Living in 2025 – And How Families Are Paying For It
Understanding Senior Living Costs: Pricing Models, Discounts & Financial Assistance


