Explore Open Rooms

1 Contact details
2 What type of senior care service are you looking for?
3 What budget do you have in mind for senior care?
4 How soon do you need to find care?
5 Additional details

Thank you for your interest!

Our team will be in touch shortly to help with next steps.

Nursing Home in Wichita

CMS overall rating Info The Overall CMS Rating combines results from health inspections, staffing levels and quality measures. Health inspections carry the most weight. Staffing and quality scores can increase or decrease the final rating based on performance compared to state and national standards.

Regent Park Rehabilitation and Healthcare

10604 E 13th St N, Wichita, KS 67206 View map
Overview of Regent Park Rehabilitation and Healthcare

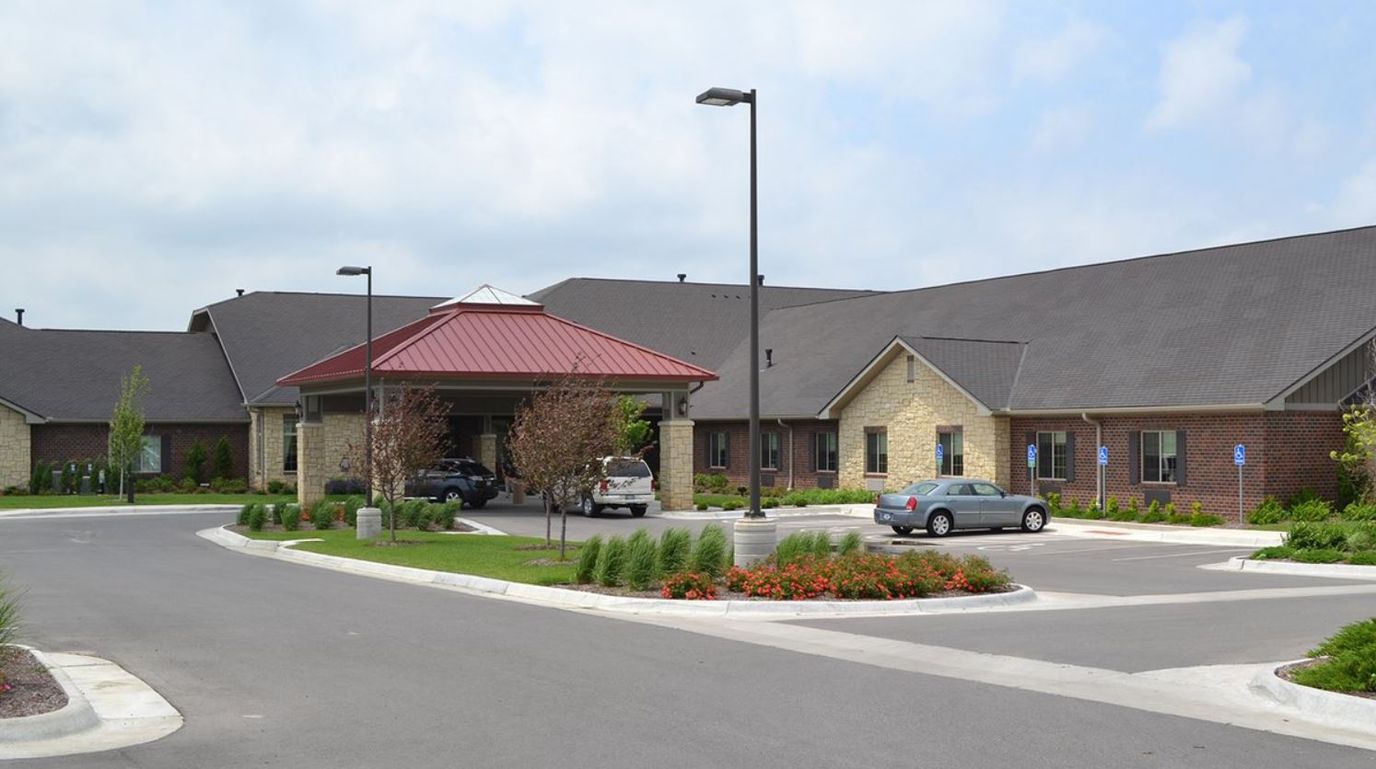
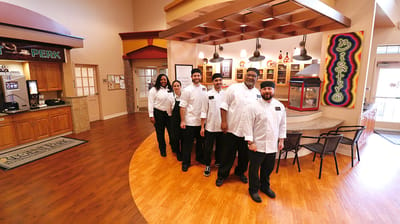
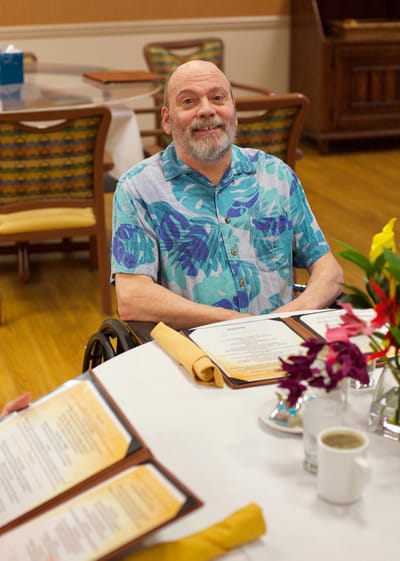
Based in the enchanting lands of Wichita, KS, Regent Park Rehabilitation and Healthcare is an astounding senior living community offering a wide array of care options including short-term and long-term, hospital care, rehabilitation, therapy, and nursing services. With cozy and welcoming private suites, residents enjoy a safe and relaxed retirement. A team of reliable and experienced professionals strives to provide the highest quality of care and assistance around the clock.

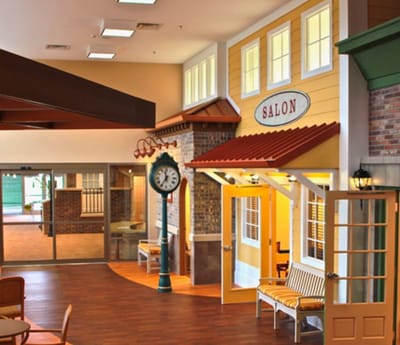
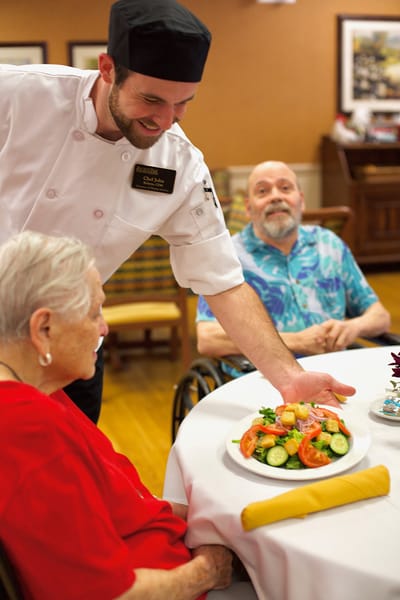
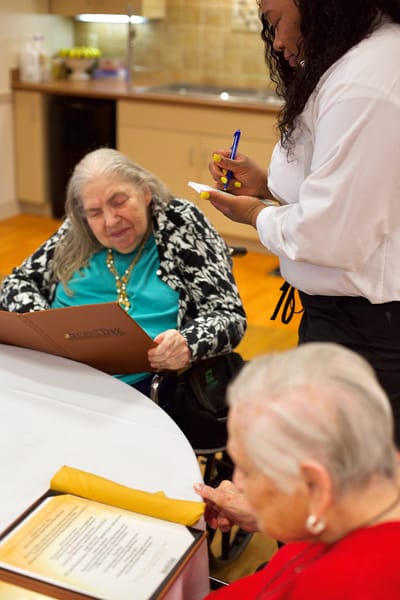
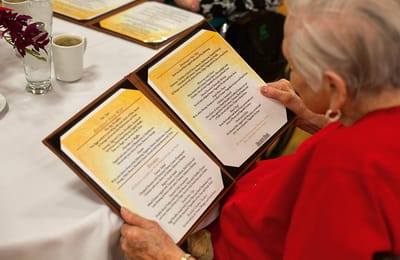
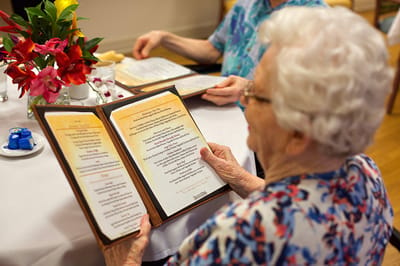
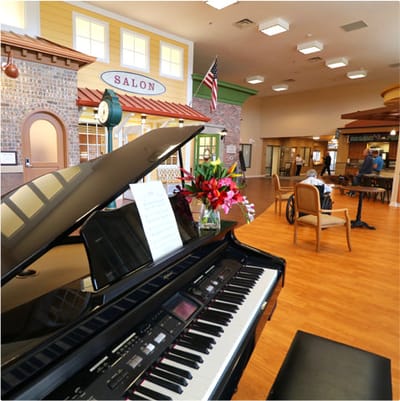
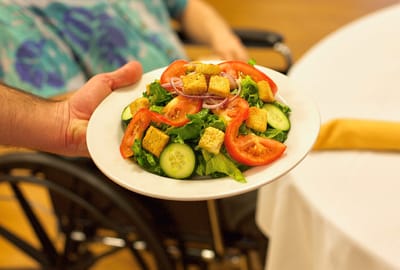
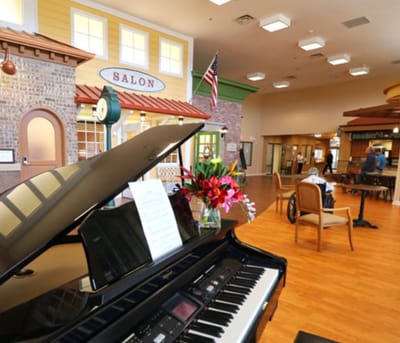
Regent Park Rehabilitation and Healthcare promotes a vibrant and welcoming environment, paving the way for seniors to flourish and experience new things. Fun activities and enjoyable events are conducted to maintain seniors’ wellness and happiness. Dining is something to anticipate with healthy and delicious meals prepared to cater to seniors’ nutritional requirements and tastes. The community’s peaceful grounds and convenient amenities ensure seniors are well-cared for.

(316) 337-5450

Quality ratings

Measured by Centers for Medicare & Medicaid Services (CMS)

Overall rating Info The Overall CMS Rating combines results from health inspections, staffing levels and quality measures. Health inspections carry the most weight. Staffing and quality scores can increase or decrease the final rating based on performance compared to state and national standards.
5/5
Kansas average: 2.9/5
Health Inspection Info Based on the results of the facility's three most recent standard inspections and any complaint investigations. CMS reviews the number, scope, and severity of deficiencies, with more recent findings weighted more heavily.
4/5
Kansas average: 2.8/5
Staffing Info Measures average nursing staff hours per resident per day, including Registered Nurses (RNs) and total nursing staff. Ratings are adjusted based on the level of care residents require and are compared to state and national benchmarks.
4/5
Kansas average: 3.5/5
Quality Measures Info Based on clinical and physical health indicators reported to CMS, such as hospital readmissions, falls, pressure ulcers, and improvements in mobility. These measures reflect how well residents' health needs are being managed.
5/5
Kansas average: 3.1/5

Nursing care per resident

Info This shows how many total hours of nursing staff time are available per resident each day. Higher numbers usually mean more staff support.
5h 10m per day

This home provides 12% more nursing time per resident than the Kansas average.

Kansas average: 4h 38m per day

Staffing hours breakdown

Info Hours of care per resident per day, broken down by staff type. Data from CMS Medicare.
Staff type Facility State avg National avg
Registered Nurse (RN) Info Registered nurse hours per resident per day. 56m per day 43m per day 41m per day
Nurse Aide Info Nurse aide hours per resident per day. 2h 45m per day 2h 42m per day 2h 21m per day
Total Nursing (Weekend) Info Total number of nurse staff hours per resident per day on weekends. 3h 55m per day 3h 35m per day 3h 26m per day
Physical Therapist Info Physical therapist staff hours per resident per day. 9m per day 2m per day 4m per day
RN (Weekend) Info Registered nurse hours per resident per day on weekends. 36m per day 29m per day 29m per day

Capacity and availability

Smaller home

May offer a more intimate, personalized care environment.

Total beds 84

This home usually has availability

Lower occupancy suggests more openings may be available.

Lower demand than the Kansas average
Occupancy rate 83.1%
Residents per day (avg) 71
Occupancy rate
83.1%
Residents per day (avg)
71

Who this home usually serves

TYPE OF STAY

Mostly short-term rehab stays

Most residents typically stay for a few weeks or months before returning home or moving on.

Might be optimal for
Short stays Recovery Medicare-covered care

Breakdown by payment type

Medicare

51% of new residents, usually for short-term rehab.

Typical stay 21 days

Private pay

48% of new residents, often for short stays.

Typical stay 1 - 2 months

Medicaid

1% of new residents, often for long-term daily care.

Typical stay 2 years

Finances and operations

Privately-owned community
Operated by a business corporation.
Home revenue
$15.9M
Profit
$1.7M
Privately-owned community Operated by a business corporation.
Home revenue
$15,946,120.00
Profit
$1,729,211.00
Payroll costs Info The portion of the home's budget spent on staff, including nurses, caregivers, and other employees who support care and operations.
$6.0M
37.7% of revenue
Other operating costs Info All remaining costs needed to run the home, such as food, utilities, building maintenance, supplies and administrative expenses.
$8.2M
Total costs $14.2M

What does this home offer?

Housing options icon

Housing Options: Private Rooms

Building type icon
Building type icon

Building Type: Single-story

Fitness and recreation icon

Fitness and Recreation

Types of Care at Regent Park Rehabilitation and Healthcare

Nursing Home
Contact Regent Park Rehabilitation and Healthcare

Health Inspection History

Inspections
Total health inspections 3

Kansas average 4.5


Last Health inspection on Jul 2025

Total health citations 14

Kansas average 26.9

Citations per inspection
4.67

Kansas average 6.07


Health citations are formal notices following inspections when they fail to comply with safety and care standards.

3 of 14 citations resulted from standard inspections; 1 of 14 resulted from complaint investigations; and 10 of 14 came from combined inspections (standard and complaint).

Breakdown of citation severity (last 3 years)
Critical Health citations More info 0
100% better than Kansas average

Kansas average: 0.9


Serious Health citations More info 0
100% better than Kansas average

Kansas average: 0.9

0 critical citations More info Kansas average: 0.9

0 serious citations More info Kansas average: 0.9

13 moderate citations More info Kansas average: 24.6

1 minor citation More info Kansas average: 0.5
Citations history (last 3 years)
Quality of Care moderate citation Info Issues related to how well residents receive appropriate treatment and support for their medical and daily care needs. Jul 07, 2025
Corrected

Administration moderate citation Info Issues related to how the facility is managed, including policies, procedures, and compliance with regulations. Apr 10, 2024
Corrected

Environmental moderate citation Info Issues related to building safety, cleanliness, maintenance, and overall living conditions. Apr 10, 2024
Corrected

Nursing Services minor citation Info Issues related to the availability and quality of nursing staff and the care they provide. Apr 10, 2024
Corrected

Compare Nursing Homes around Wichita The information below is reported by the Kansas Department for Aging and Disability Services.

3 facilities compared · CMS & KS Dept. of Health data · Updated Apr 2026

Filter by care type
Regent Park Rehabilitation and Healthcare
NH

Nursing Home Licensed facility providing 24/7 skilled nursing care for residents with complex, ongoing medical needs. Staffed by RNs, LPNs, and CNAs. Inspected and star-rated annually by CMS. Accepts Medicare (short-term rehab) and Medicaid (long-term care).

Wichita
84
83.1%
+5%
5.17
-30%
+12%
0
14
4.7
0
71
28
Legend Senior Properties
$13.8M
$6.0M
43.5%
175527
Private Rooms
Legacy at College Hill
AL

Assisted Living A licensed, long-term care setting for seniors or individuals with disabilities who need help with daily activities — like bathing, dressing, and medication management — but not 24-hour skilled nursing. Offers housing, meals, and around-the-clock support while aiming to maximize resident independence.

IL

Independent Living Lifestyle-focused communities for older adults offering dining, activities, and transportation with minimal personal care. Best for active, independent seniors who want community without medical support.

MC

Memory Care Secured, specialized care for people living with Alzheimer's or dementia. Staff trained in cognitive impairment, with higher staff-to-resident ratios and an environment designed to reduce confusion and wandering risk.

NH

Nursing Home Licensed facility providing 24/7 skilled nursing care for residents with complex, ongoing medical needs. Staffed by RNs, LPNs, and CNAs. Inspected and star-rated annually by CMS. Accepts Medicare (short-term rehab) and Medicaid (long-term care).

Wichita (Chisholm Creek)
75
88.3%
+11%
4.44
-66%
-4%
4
71
11.8
8
68
43
Ks Portfolio Master Snf Holdco, Llc
$6.4M
$3.0M
46.1%
175078
Private Rooms
The Manor Skilled Nursing
-
NH

Nursing Home Licensed facility providing 24/7 skilled nursing care for residents with complex, ongoing medical needs. Staffed by RNs, LPNs, and CNAs. Inspected and star-rated annually by CMS. Accepts Medicare (short-term rehab) and Medicaid (long-term care).

Wichita
-
-
-
-
-
-
-
-
-
0
0
0.0
0
-
58
-
-
-
-
-
Private Rooms

Places of interest near Regent Park Rehabilitation and Healthcare

Address 9.5 miles from city center — 1.28 miles to nearest hospital (Love Deborah S)

Address 10604 E 13th St N, Wichita, KS 67206

Calculate Travel Distance to Regent Park Rehabilitation and Healthcare

Add your location

Address

Staffing Data (Q2 2025)

This data corresponds to Q2 2025 and is based on CMS Payroll-Based Journal.

Total staff 169
Employees 166
Contractors 3
Staff to resident ratio 2.49:1
10% better than Kansas average

Kansas average ratio: 2.27:1

Avg staff/day 53
Average shift 8.1 hours
5% better than Kansas average

Kansas average: 7.7 hours

Total staff hours (quarter) 39,038
Nursing staff breakdown
Registered Nurse

Manages medical care and health needs.

Total count 12
Average shift length Info Average shift length. Calculated as total hours divided by days worked and average staff per day. 8.9 hours

No contractors work on this role.

Licensed Practical Nurse

Assists with medical care and medications.

Total count 23
Average shift length Info Average shift length. Calculated as total hours divided by days worked and average staff per day. 9.9 hours

No contractors work on this role.

Certified Nursing Assistant

Helps with daily care and mobility.

Total count 53
Average shift length Info Average shift length. Calculated as total hours divided by days worked and average staff per day. 8.9 hours

No contractors work on this role.

Contractor staffing

Total hours from contractors

0.5%

197 contractor hours this quarter

Medical Director: 1 Occupational Therapy Aide: 1 Occupational Therapy Assistant: 1
Staff by category
Certified Nursing Assistant5305315,97791100%8.9
Licensed Practical Nurse230235,74591100%9.9
Registered Nurse120123,28691100%8.9
Medication Aide/Technician160162,2279099%9.2
Clinical Nurse Specialist8082,0167279%6.9
RN Director of Nursing6061,5057077%7.3
Physical Therapy Assistant6061,1288088%5.8
Physical Therapy Aide8081,1177987%6.1
Respiratory Therapy Technician7071,0888189%5.7
Other Dietary Services Staff6061,0479099%6.5
Speech Language Pathologist7079868189%6.5
Qualified Social Worker100109097684%5.4
Nurse Practitioner1015126470%8
Mental Health Service Worker1015126470%8
Dietitian1014806066%8
Administrator1013085257%5.9
Occupational Therapy Aide0111601314%12.3
Occupational Therapy Assistant0112278%3.1
Medical Director011151213%1.3
53 Certified Nursing Assistant
% of Days 100%
23 Licensed Practical Nurse
% of Days 100%
12 Registered Nurse
% of Days 100%
16 Medication Aide/Technician
% of Days 99%
8 Clinical Nurse Specialist
% of Days 79%
6 RN Director of Nursing
% of Days 77%
6 Physical Therapy Assistant
% of Days 88%
8 Physical Therapy Aide
% of Days 87%
7 Respiratory Therapy Technician
% of Days 89%
6 Other Dietary Services Staff
% of Days 99%
7 Speech Language Pathologist
% of Days 89%
10 Qualified Social Worker
% of Days 84%
1 Nurse Practitioner
% of Days 70%
1 Mental Health Service Worker
% of Days 70%
1 Dietitian
% of Days 66%
1 Administrator
% of Days 57%
1 Occupational Therapy Aide
% of Days 14%
1 Occupational Therapy Assistant
% of Days 8%
1 Medical Director
% of Days 13%

Facility Characteristics

Source: CMS Long-Term Care Facility Characteristics (Data as of Jan 2026)

Total census
68 residents
Residents by payment source
Medicare
32 residents (47.1%)
Medicaid
15 residents (22.1%)
Private pay or other
21 residents (30.9%)
Programs & Services
Residents' Group

Residents meet regularly to discuss policies, care quality, and activities

CCRC

Part of a Continuing Care Retirement Community offering multiple care levels

Active Resident Council

Organized group of residents that meets regularly to discuss facility policies, quality of life, and activities.

Quality of care over time

These measures show how residents usually do over time at this home, based on health outcomes and preventive care.

High-risk clinical events score Info A composite score based on pressure ulcers, falls with injury, weight loss, walking ability decline, and activities of daily living decline. 6.9
34% better than Kansas average

Kansas average: 10.5

Functional decline score Info A composite score based on activities of daily living decline, walking ability decline, and incontinence. 15.9
23% better than Kansas average

Kansas average: 20.7

Long-stay resident measures
Significantly above average Kansas avg: 2.6 Info CMS star rating based on long-stay quality measure performance. 5 stars = significantly above average, 1 star = significantly below average.
Need for Help with Daily Activities Increased Info Percent of long-stay residents whose need for help with daily activities has increased 14.7%
23% better than Kansas average

Kansas average: 19.0%

Walking Ability Worsened Info Percent of long-stay residents whose ability to move independently worsened 9.1%
53% better than Kansas average

Kansas average: 19.4%

Low Risk Residents with Bowel/Bladder Incontinence Info Percent of low risk long-stay residents who lose control of their bowels or bladder 23.7%
In line with Kansas average

Kansas average: 23.8%

Falls with Major Injury Info Percent of long-stay residents experiencing one or more falls with major injury 3.0%
31% better than Kansas average

Kansas average: 4.4%

High Risk Residents with Pressure Ulcers Info Percent of long-stay high risk residents with pressure ulcers 3.0%
36% better than Kansas average

Kansas average: 4.6%

Urinary Tract Infection Info Percent of long-stay residents with a urinary tract infection 3.1%
In line with Kansas average

Kansas average: 3.1%

Lost Too Much Weight Info Percent of long-stay residents who lose too much weight 4.7%
8% better than Kansas average

Kansas average: 5.1%

Depressive Symptoms Info Percent of long-stay residents who have depressive symptoms 6.4%
24% worse than Kansas average

Kansas average: 5.2%

Antipsychotic Use Info Percent of long-stay residents who received an antipsychotic medication 6.4%
62% better than Kansas average

Kansas average: 16.9%

Pneumococcal Vaccine Info Percent of long-stay residents assessed and appropriately given the pneumococcal vaccine 100.0%
9% better than Kansas average

Kansas average: 91.9%

Influenza Vaccine Info Percent of long-stay residents assessed and appropriately given the seasonal influenza vaccine 100.0%
5% better than Kansas average

Kansas average: 95.5%

Hospitalizations per 1,000 days Info Number of hospitalizations per 1,000 long-stay resident days. 1.57
15% better than Kansas average

Kansas average: 1.84

ED visits per 1,000 days Info Number of outpatient emergency department visits per 1,000 long-stay resident days. 0.71
67% better than Kansas average

Kansas average: 2.16

Short-stay resident measures
Above average Kansas avg: 3.1 Info CMS star rating based on short-stay quality measure performance. 5 stars = much above average, 1 star = much below average.
Pneumococcal Vaccine Info Percent of short-stay residents assessed and appropriately given the pneumococcal vaccine 99.4%
31% better than Kansas average

Kansas average: 75.6%

Antipsychotic medication increase Info Percent of short-stay residents who newly received an antipsychotic medication 0.5%
78% better than Kansas average

Kansas average: 2.2%

Influenza Vaccine Info Percent of short-stay residents assessed and appropriately given the seasonal influenza vaccine 91.5%
24% better than Kansas average

Kansas average: 73.5%

Re-hospitalized after SNF stay Info Percentage of short-stay residents who were re-hospitalized after their nursing home admission. 21.0%
9% better than Kansas average

Kansas average: 23.0%

Emergency department visits Info Percentage of short-stay residents who had an outpatient emergency department visit. 7.3%
38% better than Kansas average

Kansas average: 11.7%

Falls with major injury Info Percentage of SNF residents who experience falls with major injury during their stay. 0.2%
70% better than Kansas average

Kansas average: 0.8%

Ability to care for self at discharge Info Percentage of residents at or above expected ability to care for themselves at discharge. 59.9%
12% better than Kansas average

Kansas average: 53.7%

Successful return to home or community Info Rate of successful return to home or community from a skilled nursing facility. 58.0%
15% better than Kansas average

Kansas average: 50.6%

Guides for Better Senior Living

Care Cost Calculator: See Prices in Your Area

Nursing Home Data Explorer

Don’t Wait Too Long: 7 Red Flag Signs Your Parent Needs Assisted Living Now

The True Cost of Assisted Living in 2025 – And How Families Are Paying For It

Understanding Senior Living Costs: Pricing Models, Discounts & Financial Assistance

Financial Aid for Kansas Seniors

Get financial aid guidance

Frail Elderly Waiver

Kansas Medicaid FE Waiver

Age 65+, Kansas resident, Medicaid-eligible, nursing home- level care need.

~$2,829/month (300% FBR, individual).

$2,000 (individual), $3,000 (couple).

Requires care level assessment.

Senior Care Act

Kansas SCA

Age 60+, Kansas resident, at risk of nursing home.

~$1,800/month (individual, varies).

$2,000 (individual).

Limited funding; waitlists common.

Medicare Savings Program (MSP)

Kansas Medicare Savings Program

Age 65+ or disabled, Kansas resident, Medicare Part A/B.

~$2,510/month (QMB), ~$3,380/month (SLMB), ~$3,598/month (QI)—individual.

$9,430 (individual), $14,130 (couple).

Three tiers; no waitlist.

National Family Caregiver Support Program (NFCSP) Respite

Kansas NFCSP Respite Care

Caregivers of 60+ needing care or 55+ caregivers of others; Kansas resident; functional needs (2+ ADLs).

Prioritizes ~$24,980/year (individual); no strict cap.

Not assessed; need-based.

11 AAAs; prioritizes low-income, rural caregivers.

Senior Community Service Employment Program (SCSEP)

Kansas SCSEP

Age 55+, unemployed, low-income, Kansas resident.

~$1,983/month (125% FPL).

Not specified; income-focused.

Priority for veterans, rural residents.

VA Aid and Attendance (A&A) and Housebound Benefits

Kansas VA Aid and Attendance/Housebound

Age 65+ or disabled veteran/spouse, Kansas resident, wartime service, need for ADL help (A&A) or homebound.

Net income < ~$1,984/month (veteran with dependent, A&A); pension offsets income.

~$155,356 (net worth limit).

High veteran demand in rural/urban areas.