

Total health inspections
12
California average 12.5
Last Health inspection on Sep 2025

We arrange tours, appointments, and even moving support so you don’t have to
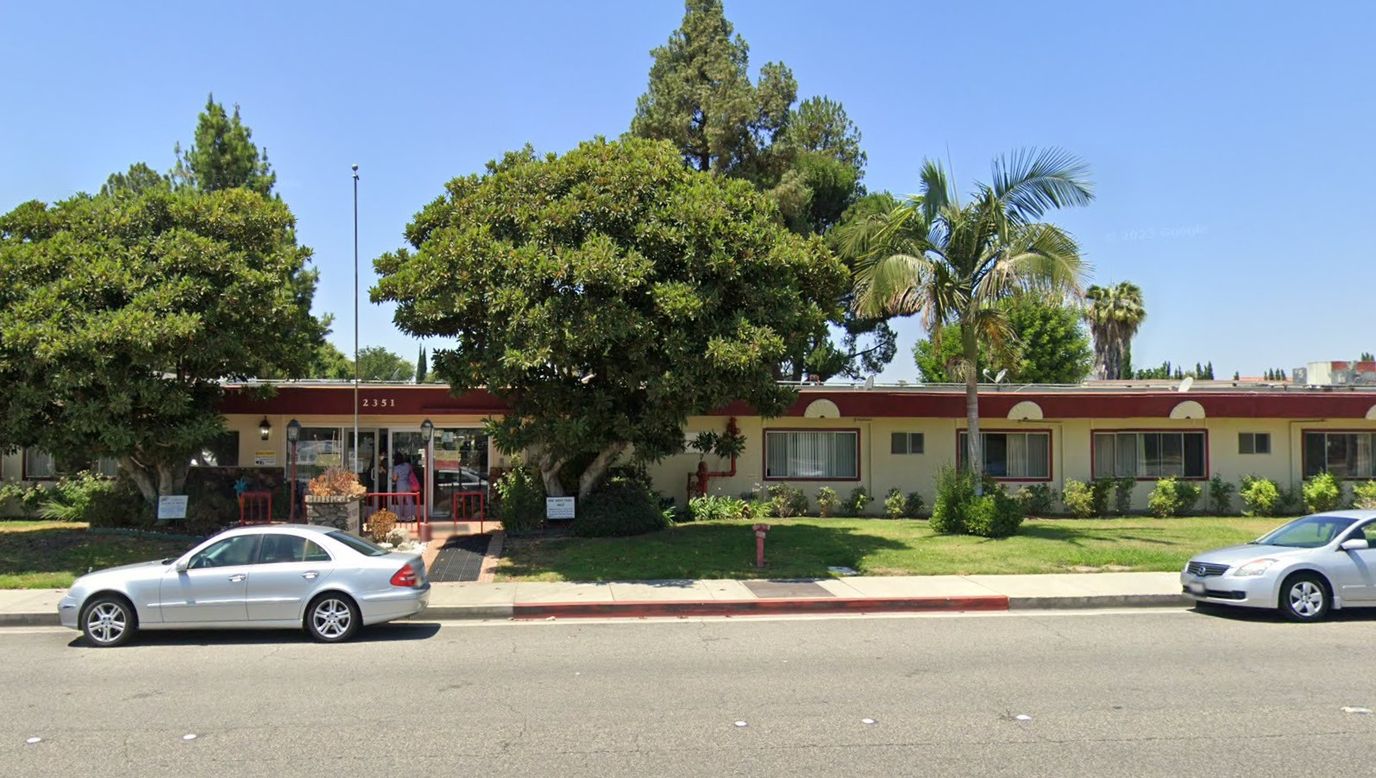
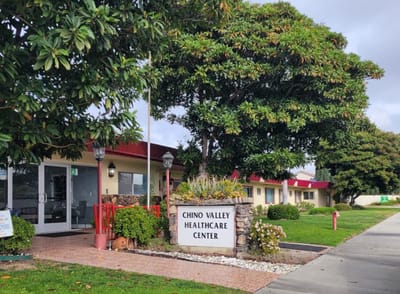
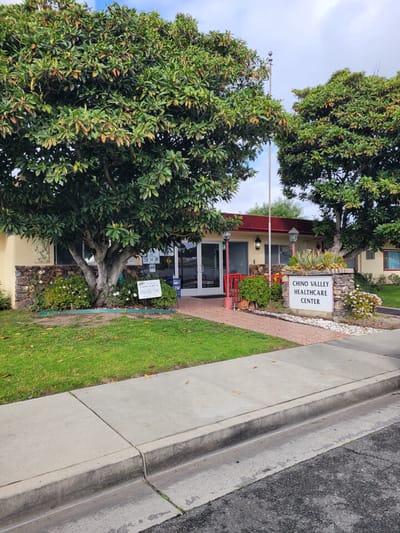
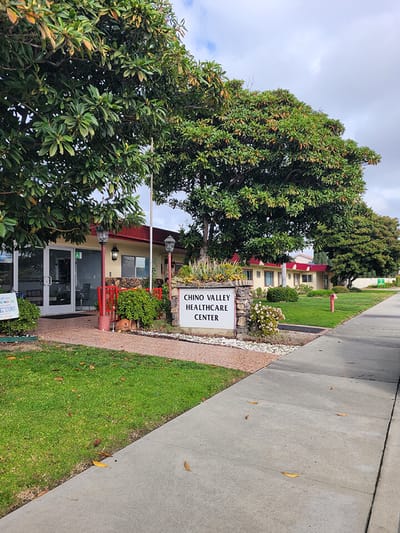
Chino Valley Healthcare Center, located in Pomona, CA, is a healthcare facility that offers quality skilled nursing services and rehabilitative services. As part of those services, they provide 24/7 skilled nursing care, diabetic care management, wound care, and assistance with daily activities. They also have specialized programs for psychological care and Alzheimer’s.
Chino Valley Healthcare Center also offers Complex Care which includes a variety of services that helps improve the residents’ overall well being such as physical, respiratory, and speech therapy. Additionally, fall management and IV therapy are also offered.
| Staff type | Hours / Day / Resident | vs state avg |
|---|---|---|
|
Registered Nurse (RN)
| 24m per day | ▼ 39% State avg: 39m per day · National avg: 41m per day |
|
LPN / LVN
| 47m per day | ▼ 36% State avg: 1h 13m per day · National avg: 52m per day |
|
Nurse Aide
| 2h 34m per day | ▼ 3% State avg: 2h 39m per day · National avg: 2h 21m per day |
|
Weekend Total Nursing
| 3h 34m per day | ▼ 13% State avg: 4h 5m per day · National avg: 3h 26m per day |
|
Physical Therapist
| 4m per day | ▼ 17% State avg: 5m per day · National avg: 4m per day |
|
Weekend RN
| 18m per day | ▼ 40% State avg: 30m per day · National avg: 29m per day |
In California, the Department of Social Services (for assisted living facilities) and the Department of Public Health (for nursing homes) conduct inspections to ensure resident safety and regulatory compliance.
California average 12.5
Last Health inspection on Sep 2025
California average 50.2
California average 4.65
Health citations are formal notices following inspections when they fail to comply with safety and care standards.
26 of 42 citations resulted from standard inspections; 13 of 42 resulted from complaint investigations; and 3 of 42 came from combined inspections (standard and complaint).
California average: 0.4
California average: 1
Reporting period: October 1 – December 31, 2025 (Q4 2025). Source: CMS Payroll-Based Journal report.
Manages medical care and health needs.
Assists with medical care and medications.
Helps with daily care and mobility.
Total hours from contractors
3,695 contractor hours this quarter
| Certified Nursing Assistant | 77 | 0 | 77 | 23,220 | 92 | 100% | 7.1 |
| Licensed Practical Nurse | 13 | 0 | 13 | 5,723 | 92 | 100% | 7.8 |
| Registered Nurse | 11 | 0 | 11 | 3,091 | 92 | 100% | 7 |
| RN Director of Nursing | 3 | 0 | 3 | 1,356 | 71 | 77% | 7.8 |
| Other Dietary Services Staff | 5 | 0 | 5 | 1,043 | 88 | 96% | 6.4 |
| Speech Language Pathologist | 0 | 2 | 2 | 1,034 | 72 | 78% | 8.9 |
| Physical Therapy Aide | 0 | 3 | 3 | 926 | 72 | 78% | 8.2 |
| Dental Services Staff | 2 | 0 | 2 | 823 | 66 | 72% | 8 |
| Physical Therapy Assistant | 0 | 3 | 3 | 635 | 75 | 82% | 6 |
| Respiratory Therapy Technician | 0 | 2 | 2 | 623 | 68 | 74% | 6.8 |
| Administrator | 1 | 0 | 1 | 512 | 64 | 70% | 8 |
| Nurse Practitioner | 1 | 0 | 1 | 488 | 61 | 66% | 8 |
| Mental Health Service Worker | 1 | 0 | 1 | 481 | 60 | 65% | 8 |
| Qualified Social Worker | 0 | 1 | 1 | 477 | 61 | 66% | 7.8 |
| Dietitian | 1 | 0 | 1 | 467 | 58 | 63% | 8 |
Includes penalties issued in 2025
Federal penalties imposed by CMS for regulatory violations, including civil money penalties (fines) and denials of payment for new Medicare/Medicaid admissions.
Source: CMS Penalties Database (Data as of Jan 2026)
California average: $55K
California average: 2.4
California average: 0.5
Penalties are imposed by CMS for violations of federal nursing home regulations.
1 penalty in the past 3 years
May 1, 2025 · $10K
Last updated: Jan 2026
These measures show how residents usually do over time at this home, based on health outcomes and preventive care.
California average: 6.6
California average: 11.3
California average: 11.1%
California average: 12.0%
California average: 11.3%
California average: 1.7%
California average: 5.0%
California average: 1.2%
California average: 4.2%
California average: 6.7%
California average: 10.1%
California average: 98.5%
California average: 98.2%
California average: 2.25
California average: 1.59
California average: 94.0%
California average: 1.5%
California average: 93.2%
California average: 23.2%
California average: 11.2%
California average: 0.8%
California average: 53.7%
Quality measures are calculated from Minimum Data Set (MDS) assessments. For most measures, lower percentages indicate better care quality.
15% of new residents, usually for short-term rehab.
16% of new residents, often for short stays.
69% of new residents, often for long-term daily care.
Source: CMS Long-Term Care Facility Characteristics (Data as of Jan 2026)
Residents meet regularly to discuss policies, care quality, and activities
Family members meet regularly to discuss policies, care quality, and activities
Organized group of family members that meets regularly to discuss facility policies, resident care, and activities.
Organized group of residents that meets regularly to discuss facility policies, quality of life, and activities.
Data sourced from CMS Long-Term Care Facility Characteristics quarterly report. Payer mix reflects the current resident census by primary payment source.
Historical financial and operational data for Chino Valley Healthcare Center based on CMS SNF Cost Reports.
Most residents stay for extended periods and receive ongoing daily care.
![]() 2.3 miles from city center
2.3 miles from city center
![]() Estimated distance in miles from Pomona's city center to Chino Valley Healthcare Center's address, calculated via Google Maps.
— 3.43 miles to nearest hospital (Pomona Valley Hospital Medical Center)
Estimated distance in miles from Pomona's city center to Chino Valley Healthcare Center's address, calculated via Google Maps.
— 3.43 miles to nearest hospital (Pomona Valley Hospital Medical Center)
Add your location
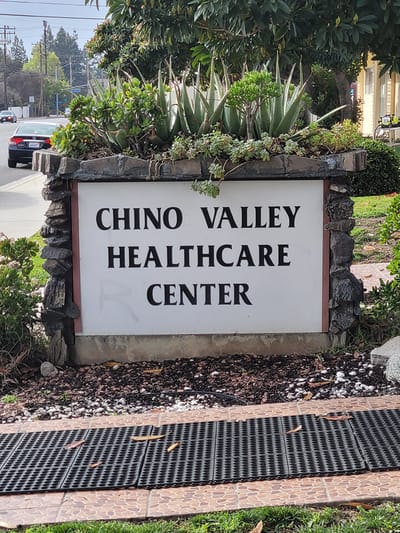
Chino Valley Healthcare Center is located in Pomona, California.
Here are the financial assistance programs available to residents in California.
The information below is reported by the California Department of Social Services and Department of Public Health.
| Claremont Care Center |
NH Nursing Home Licensed facility providing 24/7 skilled nursing care for residents with complex, ongoing medical needs. Staffed by RNs, LPNs, and CNAs. Inspected and star-rated annually by CMS. Accepts Medicare (short-term rehab) and Medicaid (long-term care). | Pomona (East Foothill Boulevard) | 99
Facility
99
CA AVG
103
Rank
#725 / 1657 |
85.9%
Facility
85.9%
CA AVG
84.7%
Rank
#436 / 1530 | +1% | 3.93
Facility
3.93
CA AVG
4.22
Rank
#202 / 345 | -23% | -7% | $0
Facility
$0
CA AVG
$56.5k
Rank
#1 / 352 | - | 50
Facility
50
CA AVG
50.2
Rank
#220 / 352 | 5.0
Facility
5.0
CA AVG
4.6
Rank
#234 / 352 | - | 89 | - |
72
Facility
72
CA AVG
57
Rank
#674 / 2092 | Carla Arellano | $15.9M
Facility
$15.9M
CA AVG
$17.0M
Rank
#186 / 346 | $8.3M
Facility
$8.3M
CA AVG
$7.0M
Rank
#184 / 346 | 52.2%
Facility
52.2%
CA AVG
45.2%
Rank
#141 / 346 | 55394 | ||||
| Chino Valley Healthcare Center |
NH Nursing Home Licensed facility providing 24/7 skilled nursing care for residents with complex, ongoing medical needs. Staffed by RNs, LPNs, and CNAs. Inspected and star-rated annually by CMS. Accepts Medicare (short-term rehab) and Medicaid (long-term care). | Pomona | 102
Facility
102
CA AVG
103
Rank
#691 / 1657 |
70.6%
Facility
70.6%
CA AVG
84.7%
Rank
#934 / 1530 | -17% | 4.99
Facility
4.99
CA AVG
4.22
Rank
#44 / 345 | -2% | +18% | $10.4k
Facility
$10.4k
CA AVG
$56.5k
Rank
#237 / 352 | - | 42
Facility
42
CA AVG
50.2
Rank
#179 / 352 | 3.5
Facility
3.5
CA AVG
4.6
Rank
#110 / 352 | 1 | 72 | A+ |
45
Facility
45
CA AVG
57
Rank
#1474 / 2092 | Friedman Family Trust | $16.7M
Facility
$16.7M
CA AVG
$17.0M
Rank
#171 / 346 | $7.1M
Facility
$7.1M
CA AVG
$7.0M
Rank
#218 / 346 | 42.7%
Facility
42.7%
CA AVG
45.2%
Rank
#239 / 346 | 55126 | ||||
| Pomona Vista Care Center |
NH Nursing Home Licensed facility providing 24/7 skilled nursing care for residents with complex, ongoing medical needs. Staffed by RNs, LPNs, and CNAs. Inspected and star-rated annually by CMS. Accepts Medicare (short-term rehab) and Medicaid (long-term care). | Pomona (North Main Street) | 59
Facility
59
CA AVG
103
Rank
#1092 / 1657 |
88.1%
Facility
88.1%
CA AVG
84.7%
Rank
#374 / 1530 | +4% | 3.84
Facility
3.84
CA AVG
4.22
Rank
#224 / 345 | -3% | -9% | $0
Facility
$0
CA AVG
$56.5k
Rank
#349 / 352 | - | 74
Facility
74
CA AVG
50.2
Rank
#293 / 352 | 4.6
Facility
4.6
CA AVG
4.6
Rank
#208 / 352 | 2 | 52 | A+ |
91
Facility
91
CA AVG
57
Rank
#155 / 2092 | Mjb Partners LLC | $17.2M
Facility
$17.2M
CA AVG
$17.0M
Rank
#164 / 346 | $5.5M
Facility
$5.5M
CA AVG
$7.0M
Rank
#272 / 346 | 31.9%
Facility
31.9%
CA AVG
45.2%
Rank
#325 / 346 | 55282 | ||||
| Country Oaks Care Center |
NH Nursing Home Licensed facility providing 24/7 skilled nursing care for residents with complex, ongoing medical needs. Staffed by RNs, LPNs, and CNAs. Inspected and star-rated annually by CMS. Accepts Medicare (short-term rehab) and Medicaid (long-term care). | Pomona (West Pearl Street) | 81
Facility
81
CA AVG
103
Rank
#913 / 1657 |
86.4%
Facility
86.4%
CA AVG
84.7%
Rank
#426 / 1530 | +2% | 4.17
Facility
4.17
CA AVG
4.22
Rank
#136 / 345 | -42% | -1% | $0
Facility
$0
CA AVG
$56.5k
Rank
#266 / 352 | - | 94
Facility
94
CA AVG
50.2
Rank
#324 / 352 | 3.6
Facility
3.6
CA AVG
4.6
Rank
#118 / 352 | 1 | 72 | A+ |
87
Facility
87
CA AVG
57
Rank
#249 / 2092 | Country Oaks Partners LLC | $20.2M
Facility
$20.2M
CA AVG
$17.0M
Rank
#135 / 346 | $8.8M
Facility
$8.8M
CA AVG
$7.0M
Rank
#161 / 346 | 43.7%
Facility
43.7%
CA AVG
45.2%
Rank
#231 / 346 | 55247 | ||||
| Park Avenue Healthcare & Wellness Centre |
NH Nursing Home Licensed facility providing 24/7 skilled nursing care for residents with complex, ongoing medical needs. Staffed by RNs, LPNs, and CNAs. Inspected and star-rated annually by CMS. Accepts Medicare (short-term rehab) and Medicaid (long-term care). | Pomona | 231
Facility
231
CA AVG
103
Rank
#107 / 1657 |
93.5%
Facility
93.5%
CA AVG
84.7%
Rank
#228 / 1530 | +10% | 3.61
Facility
3.61
CA AVG
4.22
Rank
#262 / 345 | -14% | -14% | $151.5k
Facility
$151.5k
CA AVG
$56.5k
Rank
#350 / 352 | - | 154
Facility
154
CA AVG
50.2
Rank
#350 / 352 | 3.9
Facility
3.9
CA AVG
4.6
Rank
#155 / 352 | 4 | 216 | A+ |
73
Facility
73
CA AVG
57
Rank
#642 / 2092 | Pomona Nursing & Healthcare Centre, LLC | $44.6M
Facility
$44.6M
CA AVG
$17.0M
Rank
#17 / 346 | $18.8M
Facility
$18.8M
CA AVG
$7.0M
Rank
#11 / 346 | 42.2%
Facility
42.2%
CA AVG
45.2%
Rank
#245 / 346 | 555852 |
Chino Valley Healthcare Center has a walk score of 45. Somewhat walkable. A few nearby services may be reachable on foot, but most trips require transportation.
Yes — there are 7 photos of Chino Valley Healthcare Center in the photo gallery on this page.
(909) 464-8600 will put you in contact with the team at Chino Valley Healthcare Center.
Yes — Chino Valley Healthcare Center is a CMS-certified provider of Medicare and Medicaid.
Care Cost Calculator: See Prices in Your Area
Nursing Home Data Explorer
Don’t Wait Too Long: 7 Red Flag Signs Your Parent Needs Assisted Living Now
The True Cost of Assisted Living in 2025 – And How Families Are Paying For It
Understanding Senior Living Costs: Pricing Models, Discounts & Financial Assistance


Thank you for your interest!
Our team will be in touch shortly to help with next steps.
