Prestige Post-Acute and Rehab Center – Centralia
Nursing Home, Assisted Living, Independent Living & Memory Care · Centralia, WA
CMS overall rating Info CMS (the Centers for Medicare & Medicaid Services) is the federal agency that rates nursing home quality. Its Overall Rating runs from 1 to 5 stars, combining health inspections, staffing, and quality measures, with inspections weighted most heavily.

Prestige Post-Acute and Rehab Center – Centralia

Nursing Home, Assisted Living, Independent Living & Memory Care · Centralia, WA
CMS overall rating Info CMS (the Centers for Medicare & Medicaid Services) is the federal agency that rates nursing home quality. Its Overall Rating runs from 1 to 5 stars, combining health inspections, staffing, and quality measures, with inspections weighted most heavily.
Calculator: See prices in your area
Prestige Post-Acute and Rehab Center – Centralia accepts Medicare, Medicaid, and private pay.

Overview of Prestige Post-Acute and Rehab Center – Centralia

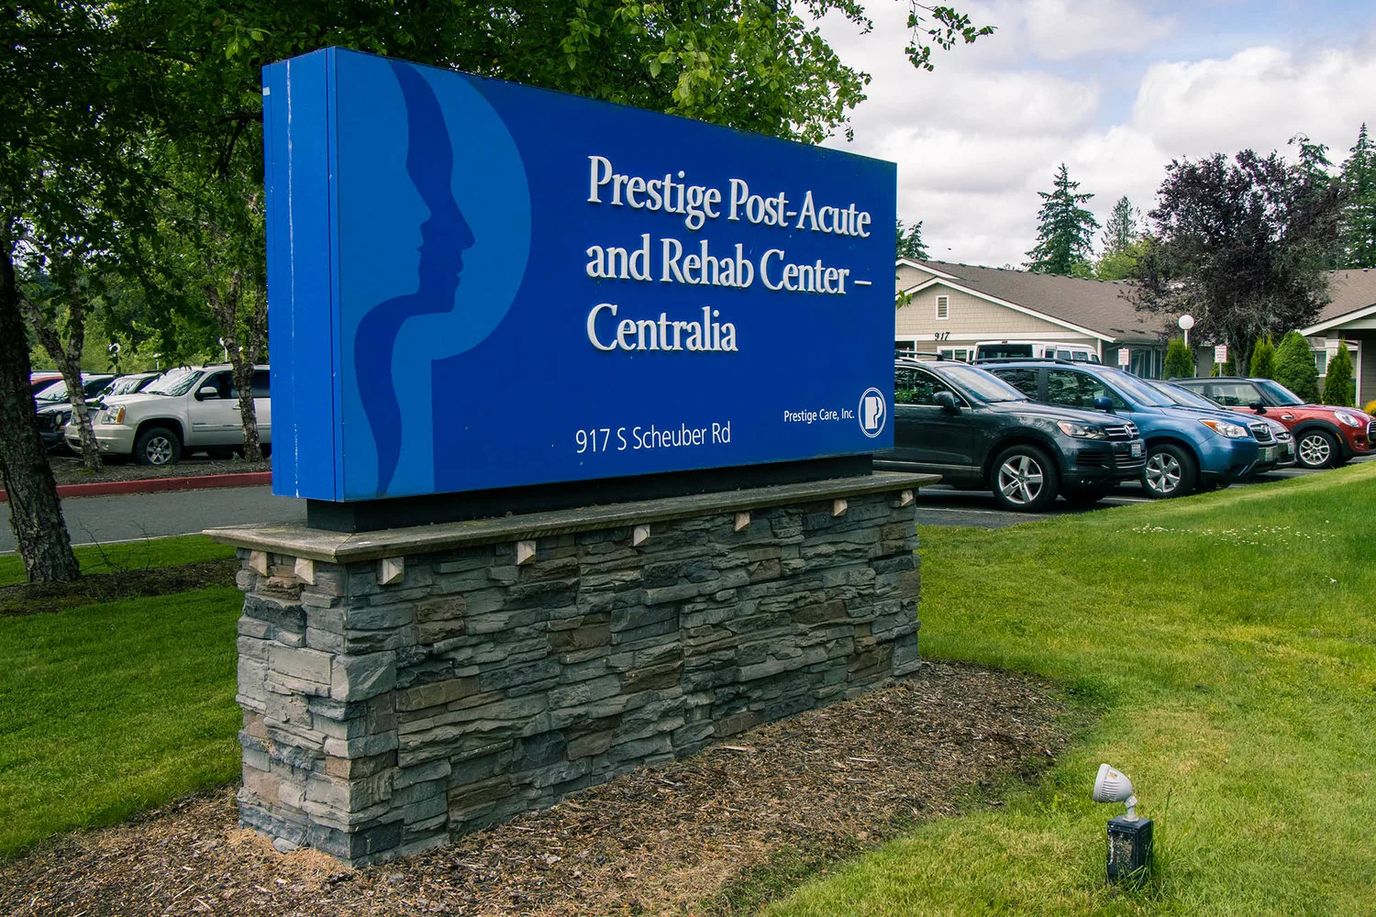
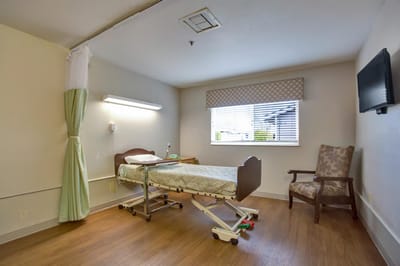
Prestige Post-Acute and Rehab Center, tucked in Centralia, Washington, boasts a team of highly competent and credible healthcare professionals, including physicians, registered nurses, dietitians, certified nursing assistants, and more. Patients find comfort in the ideal recovery environment created by professionals who prioritize their needs and preferences.

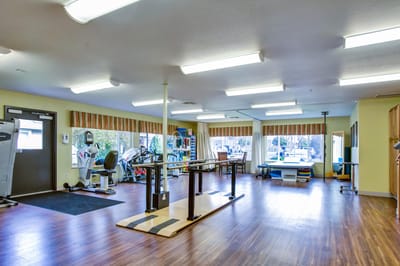
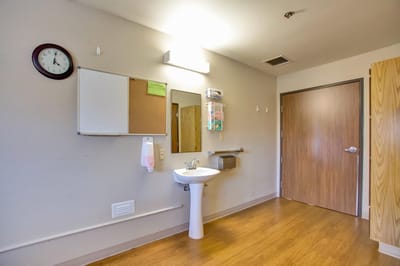
At Prestige, nursing home care and skilled nursing facility services are seamlessly integrated into their offerings. Beyond their skilled therapy teams, this center provides a spectrum of services ranging from pain management and pulmonary care to balance programs, cancer recovery, and tracheostomy recovery. Notably, the facility houses a pharmacy, laboratory, and x-ray services, showcasing a comprehensive approach to healthcare. With a dedication to excellence, Prestige Post-Acute and Rehab Center emerges as a trusted haven for those seeking superior senior living.

Quality ratings

Measured by Centers for Medicare & Medicaid Services (CMS)

Overall rating Info The Overall CMS Rating combines results from health inspections, staffing levels and quality measures. Health inspections carry the most weight. Staffing and quality scores can increase or decrease the final rating based on performance compared to state and national standards.
▲ 24.0% Above WA avg. ▲ 24.0% Above WA avg.WA average: 3.2Click the badge to see the full State ranking.Click here to see the full State ranking.
Health Inspection Info Based on the results of the facility's three most recent standard inspections and any complaint investigations. CMS reviews the number, scope, and severity of deficiencies, with more recent findings weighted more heavily.
▲ 6.5% Above WA avg. ▲ 6.5% Above WA avg.WA average: 2.8Click the badge to see the full State ranking.Click here to see the full State ranking.
Staffing Info Measures average nursing staff hours per resident per day, including Registered Nurses (RNs) and total nursing staff. Ratings are adjusted based on the level of care residents require and are compared to state and national benchmarks.
▼ 12.4% Below WA avg. ▼ 12.4% Below WA avg.WA average: 3.4Click the badge to see the full State ranking.Click here to see the full State ranking.
Quality Measures Info Based on clinical and physical health indicators reported to CMS, such as hospital readmissions, falls, pressure ulcers, and improvements in mobility. These measures reflect how well residents' health needs are being managed.
▲ 27.2% Above WA avg. ▲ 27.2% Above WA avg.WA average: 3.9Click the badge to see the full State ranking.Click here to see the full State ranking.

Staffing hours breakdown

Info Daily nursing hours per resident by staff type, reported to CMS. Higher is generally better — compare this facility to state and national averages to see where staffing stands.

Hours per resident per day — compared to Washington state averages

Total nursing care / resident Info This home is ranked 70th out of 90 homes in Washington for nurse hours. Total adjusted nursing hours per resident per day, combining RN, LPN, and aide time. CMS adjusts this for case-mix so facilities can be fairly compared.
3h 33m per day
Rank #70 / 90Nurse hours — State benchmarkedThis home is ranked 70th out of 90 homes in Washington. Shows adjusted nurse hours per resident per day benchmarked to the Washington average, with a ranking across 90 Washington facilities. More hours mean more direct care. The national average is about 3.5 hrs; below 3.0 is a red flag.Rankings are based only on facilities in Washington that report data for that category. Facilities without available data are excluded from the ranking.Click the rank badge to see the full State ranking.Click here to see the full State ranking.
This facility Washington avg (4h 13m per day)
vs Washington avg
-16%

4 of 6 metrics below state avg

Standout metric LPN / LVN is +24% above state avg
Staff type Hours / Day / Resident vs state avg
Registered Nurse (RN) Info RNs hold the highest nursing license and can assess residents, interpret test results, and direct care plans. More RN hours per day often signals stronger clinical oversight and faster response to health changes. 36m per day ▼ 32% State avg: 53m per day · National avg: 41m per day
LPN / LVN Info Licensed Practical Nurses (LPNs) or Licensed Vocational Nurses (LVNs) deliver routine hands-on care — medication administration, wound dressing, and monitoring vital signs. They work under RN supervision and make up a large share of daily bedside care. 1h 1m per day ▲ 24% State avg: 49m per day · National avg: 52m per day
Nurse Aide Info Certified Nurse Aides (CNAs) provide the most direct day-to-day assistance: bathing, dressing, feeding, and mobility. Nurse aide hours are typically the largest staffing category and directly affect residents' quality of life. 2h 30m per day ▼ 7% State avg: 2h 41m per day · National avg: 2h 21m per day
Weekend Total Nursing Info Combined nursing hours (RN + LPN + Nurse Aide) per resident per day on weekends. Staffing often drops on weekends — this figure reveals whether the facility maintains adequate coverage outside of weekday hours. 3h 37m per day ▼ 4% State avg: 3h 47m per day · National avg: 3h 26m per day
Physical Therapist Info Hours per resident per day provided by licensed Physical Therapists (PTs) or PT Assistants. PT services help residents recover mobility after injury or illness and are especially important for post-acute (short-stay) rehabilitation. 6m per day ▲ 15% State avg: 5m per day · National avg: 4m per day
Weekend RN Info Registered nurse hours specifically on weekends. Facilities sometimes reduce RN presence on Saturdays and Sundays — a low weekend RN figure compared to weekday hours can indicate reduced clinical oversight when most administrative staff are absent. 18m per day ▼ 52% State avg: 38m per day · National avg: 29m per day

Capacity and availability

This home usually has availability

Lower occupancy than the Washington average: 72.5%
Occupancy rate
66.8% Rank #220 / 310Occupancy rate — State benchmarkedThis home is ranked 220th out of 310 homes in Washington. Shows this facility's occupancy rate versus the Washington average, with its Statewide rank out of 310. Higher occupancy signals strong local demand and financial stability.Rankings are based only on facilities in Washington that report data for that category. Facilities without available data are excluded from the ranking.Click the rank badge to see the full State ranking.Click here to see the full State ranking.
Avg. Length of Stay Info Average number of days residents stay at this facility, based on CMS cost report data. Shorter stays often reflect post-acute or rehab care; longer stays reflect long-term care.
67 days
Bed community size
128-bed community Rank #32 / 366Bed count — State benchmarkedThis home is ranked 32nd out of 366 homes in Washington. Shows this facility's certified or reported bed count compared to other Washington facilities. Larger communities may offer more amenities, programs, and on-site services for residents and families.Rankings are based only on facilities in Washington that report data for that category. Facilities without available data are excluded from the ranking.Click the rank badge to see the full State ranking.Click here to see the full State ranking.
A larger shared setting that may offer more common spaces and organized community services.
Years in operation
29 years in operation
A longer operating history, which may indicate experience navigating regulations and delivering ongoing care.
Walk Score
Walk Score: 9 / 100 Rank #593 / 628Walk Score — State benchmarkedThis home is ranked 593rd out of 628 homes in Washington. Shows how walkable this facility's neighborhood is compared to the average Walk Score across Washington facilities. Higher scores benefit residents, families, and staff.Rankings are based only on facilities in Washington that report data for that category. Facilities without available data are excluded from the ranking.Click the rank badge to see the full State ranking.Click here to see the full State ranking.
Car-dependent. Most errands require a car, with limited nearby walkable options.
BBB Rating
BBB Rating: A+ (Not Accredited)
An independent rating from the Better Business Bureau based on factors such as complaint history, transparency, and business practices.
How BBB ratings work

Staffing

Key information about the people who lead and staff this community.

Leadership

ContactMrs. Winnie Welker, Manager

Contact Prestige Post-Acute and Rehab Center – Centralia

Inspection History

In Washington, the Department of Social and Health Services, Residential Care Services conducts unannounced inspections and issues reports on the quality of care in all licensed settings.

Since 2023 · 3 years of data 45 deficiencies

Inspection Scorecard Info This scorecard compares key inspection, deficiency, and complaint metrics at this facility against the Washington state average. Metrics rated ≥15% worse than average are highlighted in red; those ≥15% better are highlighted in green.

Since 2023 vs. Washington state average
Overall vs. WA average 2 Worse Metrics worse than Washington average:
• Total deficiencies (45% above)
• Deficiencies per year (46% above)
0 Better No metrics in this bucket.
Latest Inspection December 29, 2025 Other An inspection that falls outside standard annual surveys and formal complaint investigations. May include administrative compliance checks, documentation reviews, focused surveys on specific concerns, or revisit surveys to verify prior corrections.

Deficiencies Info Deficiencies are formal regulatory issues recorded during state inspections.

This Facility WA Average vs. WA Avg
Total deficiencies Info Formal regulatory issues recorded by inspectors across all inspection types. 45 31 This facility has 45% more total deficiencies than a typical Washington nursing home (45 vs. WA avg 31).↑ 45% worse
Deficiencies per year Info Average deficiencies per year since 2023. 15 10.3 This facility has 46% more deficiencies per year than a typical Washington nursing home (15 vs. WA avg 10.3).↑ 46% worse

Inspection Reports Summary Info An editor-reviewed summary of the themes and findings across this facility's recent inspection reports.

  • December 29, 2025 inspection found failure to obtain ordered laboratory tests causing actual harm and hospital transfer for one resident.
  • Multiple complaint investigations in 2025 substantiated failures including unattended falls, unauthorized medication administration by unlicensed staff, and denial of resident readmission after hospitalization.
  • December 2, 2025 annual inspection found failure to administer ordered antibiotic medication due to communication errors, placing residents at risk of delayed healing.

Health Inspection History

Inspections since 2023
Total health inspections 13

Washington average 7.8


Last Health inspection on Sep 2025

Total health citations
47 Rank #43 / 92Health citations — State benchmarkedThis home is ranked 43rd out of 92 homes in Washington. Shows this facility's total health deficiency citations benchmarked to the Washington State average, with a ranking across all 92 WA facilities. Lower citation counts earn a better rank.Rankings are based only on facilities in Washington that report data for that category. Facilities without available data are excluded from the ranking.Click the rank badge to see the full State ranking.Click here to see the full State ranking.

Washington average 48.9

Citations per inspection
3.62 Rank #7 / 92Citations per inspection — State benchmarkedThis home is ranked 7th out of 92 homes in Washington. Shows average deficiency citations per CMS inspection for this facility versus the Washington mean across 92 facilities with citation data. Lower is better.Rankings are based only on facilities in Washington that report data for that category. Facilities without available data are excluded from the ranking.Click the rank badge to see the full State ranking.Click here to see the full State ranking.

Washington average 6.92


Health citations are formal notices following inspections when they fail to comply with safety and care standards.

34 of 47 citations resulted from standard inspections; and 13 of 47 resulted from complaint investigations.

Breakdown of citation severity (last 3 years)
Critical health citations
0
100% better than Washington average

Washington average: 0.3


Serious health citations
0
100% better than Washington average

Washington average: 1.7

0 critical citations Washington average: 0.3

0 serious citations Washington average: 1.7

45 moderate citations Washington average: 46.3

2 minor citations Washington average: 0.5
Citations history (last 3 years)
Abuse/Neglect moderate citation Sep 09, 2025
Corrected

Quality of Care moderate citation Jul 24, 2025
Corrected

Administration moderate citation Jul 01, 2025
Corrected

Nutrition minor citation Apr 17, 2025
Corrected

Staffing Data

Reporting period: October 1 – December 31, 2025 (Q4 2025). Source: CMS Payroll-Based Journal report.

Total staff 190
Employees 154
Contractors 36
Staff to resident ratio 1.62 : 1
13% fewer staff per resident than Washington average
Washington average ratio: 1.86 : 1 Washington average ratio: 1.86 : 1See full Washington ranking
Avg staff/day 63
Average shift 8.1 hours
0% compared with Washington average
Washington average: 8.1 hours Washington average shift: 8.1 hoursSee full Washington ranking
Total staff hours (quarter) 47,217

Nursing staff breakdown

Q4 2025 · Oct 1 – Dec 31 More info This data comes from the CMS Payroll-Based Journal report covering October 1 – December 31, 2025.
Registered Nurse

Manages medical care and health needs.

RN Staff Info 20 total: 15 full-time employees and 5 contractors. 20
Average shift length Info Average shift length. Calculated as total hours divided by days worked and average staff per day. 9.1 hours
Licensed Practical Nurse

Assists with medical care and medications.

LPN Staff Info 31 total: 22 full-time employees and 9 contractors. 31
Average shift length Info Average shift length. Calculated as total hours divided by days worked and average staff per day. 9.8 hours
Certified Nursing Assistant

Helps with daily care and mobility.

CNA Staff Info 101 total: 81 full-time employees and 20 contractors. 101
Average shift length Info Average shift length. Calculated as total hours divided by days worked and average staff per day. 7.7 hours

Contractor staffing

Q4 2025 · Oct 1 – Dec 31 More info This data comes from the CMS Payroll-Based Journal report covering October 1 – December 31, 2025.

Total hours from contractors

3.1%

1,443 contractor hours this quarter

Certified Nursing Assistant: 20 Licensed Practical Nurse: 9 Registered Nurse: 5 Medical Director: 1 Occupational Therapy Aide: 1

Staff by category

Q4 2025 · Oct 1 – Dec 31 More info This data comes from the CMS Payroll-Based Journal report covering October 1 – December 31, 2025.
Certified Nursing Assistant 81 20 101 21,909 92 100% 7.7
Licensed Practical Nurse 22 9 31 8,251 92 100% 9.8
Registered Nurse 15 5 20 5,152 92 100% 9.1
Medication Aide/Technician 4 0 4 1,608 87 95% 10.1
Other Dietary Services Staff 4 0 4 1,496 88 96% 7.1
RN Director of Nursing 3 0 3 1,369 72 78% 7.8
Speech Language Pathologist 4 0 4 1,348 71 77% 7.8
Dental Services Staff 4 0 4 1,332 64 70% 7.7
Physical Therapy Aide 4 0 4 1,296 80 87% 7.1
Respiratory Therapy Technician 3 0 3 910 89 97% 6.9
Physical Therapy Assistant 3 0 3 516 68 74% 6.6
Nurse Practitioner 1 0 1 512 64 70% 8
Administrator 1 0 1 472 64 70% 7.4
Dietitian 1 0 1 426 60 65% 7.1
Qualified Social Worker 2 0 2 328 61 66% 5
Nurse Aide in Training 1 0 1 134 23 25% 5.8
Occupational Therapy Aide 0 1 1 103 14 15% 7.3
Medical Director 0 1 1 48 12 13% 4
Therapeutic Recreation Specialist 1 0 1 8 1 1% 8
101 Certified Nursing Assistant
% of Days 100%
31 Licensed Practical Nurse
% of Days 100%
20 Registered Nurse
% of Days 100%
4 Medication Aide/Technician
% of Days 95%
4 Other Dietary Services Staff
% of Days 96%
3 RN Director of Nursing
% of Days 78%
4 Speech Language Pathologist
% of Days 77%
4 Dental Services Staff
% of Days 70%
4 Physical Therapy Aide
% of Days 87%
3 Respiratory Therapy Technician
% of Days 97%
3 Physical Therapy Assistant
% of Days 74%
1 Nurse Practitioner
% of Days 70%
1 Administrator
% of Days 70%
1 Dietitian
% of Days 65%
2 Qualified Social Worker
% of Days 66%
1 Nurse Aide in Training
% of Days 25%
1 Occupational Therapy Aide
% of Days 15%
1 Medical Director
% of Days 13%
1 Therapeutic Recreation Specialist
% of Days 1%

Penalties and fines

Federal penalties imposed by CMS for regulatory violations, including civil money penalties (fines) and denials of payment for new Medicare/Medicaid admissions.

Source: CMS Penalties Database

No penalties in the past 3 years

No civil money penalties or payment denials were reported in the last 3 years.

Quality of care over time

These measures show how residents usually do over time at this home, based on health outcomes and preventive care.

High-risk clinical events score Info A composite score based on pressure ulcers, falls with injury, weight loss, walking ability decline, and activities of daily living decline. 13.3
33% worse than Washington average

Washington average: 10.0

Functional decline score Info A composite score based on activities of daily living decline, walking ability decline, and incontinence. 27.9
34% worse than Washington average

Washington average: 20.9

Long-stay resident measures
Above average Washington avg: 3.6 Info CMS star rating based on long-stay quality measure performance. 5 stars = significantly above average, 1 star = significantly below average.
Need for Help with Daily Activities Increased Info Percent of long-stay residents whose need for help with daily activities has increased 18.6%
14% worse than Washington average

Washington average: 16.4%

Walking Ability Worsened Info Percent of long-stay residents whose ability to move independently worsened 39.1%
79% worse than Washington average

Washington average: 21.8%

Low Risk Residents with Bowel/Bladder Incontinence Info Percent of low risk long-stay residents who lose control of their bowels or bladder 26.0%
7% worse than Washington average

Washington average: 24.3%

Falls with Major Injury Info Percent of long-stay residents experiencing one or more falls with major injury 0.0%
100% better than Washington average

Washington average: 2.6%

High Risk Residents with Pressure Ulcers Info Percent of long-stay high risk residents with pressure ulcers 6.0%
23% worse than Washington average

Washington average: 4.9%

Urinary Tract Infection Info Percent of long-stay residents with a urinary tract infection 0.9%
48% better than Washington average

Washington average: 1.7%

Lost Too Much Weight Info Percent of long-stay residents who lose too much weight 2.9%
50% better than Washington average

Washington average: 5.8%

Depressive Symptoms Info Percent of long-stay residents who have depressive symptoms 1.1%
93% better than Washington average

Washington average: 16.2%

Antipsychotic Use Info Percent of long-stay residents who received an antipsychotic medication 12.6%
13% better than Washington average

Washington average: 14.5%

Pneumococcal Vaccine Info Percent of long-stay residents assessed and appropriately given the pneumococcal vaccine 99.6%
In line with Washington average

Washington average: 96.2%

Influenza Vaccine Info Percent of long-stay residents assessed and appropriately given the seasonal influenza vaccine 95.7%
In line with Washington average

Washington average: 93.8%

Hospitalizations per 1,000 days Info Number of hospitalizations per 1,000 long-stay resident days. 0.50
64% better than Washington average

Washington average: 1.38

ED visits per 1,000 days Info Number of outpatient emergency department visits per 1,000 long-stay resident days. 1.95
29% worse than Washington average

Washington average: 1.51

Short-stay resident measures
Significantly above average Washington avg: 3.6 Info CMS star rating based on short-stay quality measure performance. 5 stars = much above average, 1 star = much below average.
Pneumococcal Vaccine Info Percent of short-stay residents assessed and appropriately given the pneumococcal vaccine 95.9%
9% better than Washington average

Washington average: 88.1%

Antipsychotic medication increase Info Percent of short-stay residents who newly received an antipsychotic medication 0.3%
80% better than Washington average

Washington average: 1.4%

Influenza Vaccine Info Percent of short-stay residents assessed and appropriately given the seasonal influenza vaccine 84.9%
In line with Washington average

Washington average: 82.0%

Re-hospitalized after SNF stay Info Percentage of short-stay residents who were re-hospitalized after their nursing home admission. 18.4%
8% better than Washington average

Washington average: 19.9%

Emergency department visits Info Percentage of short-stay residents who had an outpatient emergency department visit. 13.7%
In line with Washington average

Washington average: 13.2%

Falls with major injury Info Percentage of SNF residents who experience falls with major injury during their stay. 0.5%
38% better than Washington average

Washington average: 0.8%

Ability to care for self at discharge Info Percentage of residents at or above expected ability to care for themselves at discharge. 44.4%
17% worse than Washington average

Washington average: 53.7%

Successful return to home or community Info Rate of successful return to home or community from a skilled nursing facility. 61.2%
21% better than Washington average

Washington average: 50.6%

Breakdown by payment type

Medicare

49% of new residents, usually for short-term rehab.

Typical stay 25 days

Private pay

48% of new residents, often for short stays.

Typical stay 1 months

Medicaid

4% of new residents, often for long-term daily care.

Typical stay 2 - 3 years

Facility Characteristics

Source: CMS Long-Term Care Facility Characteristics (Data as of Jan 2026)

Total residents 117
Medicare
62
53% of residents
Medicaid
52
44.4% of residents
Private pay or other
3
2.6% of residents
Programs & Services
Residents Group

Residents meet regularly to discuss policies, care quality, and activities

Active Resident Council

Organized group of residents that meets regularly to discuss facility policies, quality of life, and activities.

Finances and operations

Based on CMS SNF Cost Report for fiscal year ending in 12/2023.

For-profit
Operated by a single business entity.
Net patient revenue Info Net patient revenue — what the home actually collects for resident care, after contractual allowances, bad debt and discounts are subtracted from its gross charges (CMS cost report, Worksheet G-3). It covers resident care only; money the home earns from other sources is shown separately as "Other income."
$13.1M
Net patient income Info Net patient income: net patient revenue minus the home's total operating expenses. A positive figure means it earns more from resident care than it spends to deliver it; a negative figure means the opposite. It excludes non-operating "other income."
-$721.0K
For-profit Operated by a single business entity.
Net patient revenue Info Net patient revenue — what the home actually collects for resident care, after contractual allowances, bad debt and discounts are subtracted from its gross charges (CMS cost report, Worksheet G-3). It covers resident care only; money the home earns from other sources is shown separately as "Other income."
$13.1M Rank #23 / 94Revenue — State benchmarkedThis home is ranked 23rd out of 94 homes in Washington. Shows this facility's annual revenue compared to the Washington average. Higher revenue generally means more resources for staffing and capital — read alongside Payroll %.Rankings are based only on facilities in Washington that report data for that category. Facilities without available data are excluded from the ranking.Click the rank badge to see the full State ranking.Click here to see the full State ranking.
Net patient income Info Net patient income: net patient revenue minus the home's total operating expenses. A positive figure means it earns more from resident care than it spends to deliver it; a negative figure means the opposite. It excludes non-operating "other income."
-$721.0K
Other income Info Money the home earns outside of resident care — such as investments, grants, rentals and other non-operating sources (CMS cost report, Worksheet G-3). It is tracked separately from net patient revenue: it is not part of that figure, and it is not included in net patient income.
$1.5M
Payroll costs Info Staff salaries plus wage-related costs — benefits such as payroll taxes, health insurance and retirement — from the home's own accounting records (CMS cost report, Worksheet A). Contract or agency labor is counted separately, under other operating costs. Rank #41 / 94Payroll — State benchmarkedThis home is ranked 41st out of 94 homes in Washington. Shows total annual staff payroll benchmarked to the Washington average. Higher payroll investment relative to peers often signals better staffing and less reliance on cheaper contract labor.Rankings are based only on facilities in Washington that report data for that category. Facilities without available data are excluded from the ranking.Click the rank badge to see the full State ranking.Click here to see the full State ranking.
$7.3M 55.6% of net patient revenue Info Payroll as a share of revenue: staff salaries and wage-related benefits divided by net patient revenue. A higher figure means more of each revenue dollar goes to staff pay. Rank #83 / 94Payroll % — State benchmarkedThis home is ranked 83rd out of 94 homes in Washington. Shows payroll as a percentage of revenue versus the Washington average. Well-run Washington facilities typically land around 53–61% — the top third Statewide. Below 25% may signal understaffing or heavy agency use — read with Staffing ratings.Rankings are based only on facilities in Washington that report data for that category. Facilities without available data are excluded from the ranking.Click the rank badge to see the full State ranking.Click here to see the full State ranking.
Other operating costs Info Everything it costs to run the home apart from payroll — food, utilities, supplies, maintenance, contract labor and administration. Calculated as total operating expense minus payroll (staff salaries and wage-related benefits).
$6.5M
Total costs Info The home's total operating expense for the year — all the costs of running it, salaries included (CMS cost report, Worksheet G-3).
$13.8M

Who this home usually serves

TYPE OF STAY

Mostly short-term rehab stays

Most residents typically stay for a few weeks or months before returning home or moving on.

New residents most often arrive under Medicare (49% of admissions), and a typical Medicare stay runs around 25 days.

Admissions
461 total

Coverage residents most often arrive under.

Medicare 49%
Private pay 48%
Medicaid 4%
Discharges
468 total

Coverage residents most often leave under.

Medicare 40%
Private pay 42%
Medicaid 17%

Places of interest near Prestige Post-Acute and Rehab Center – Centralia

Address 2.1 miles from city center Info Estimated distance in miles from Centralia's city center to Prestige Post-Acute and Rehab Center – Centralia's address, calculated via Google Maps. — 0.11 miles to nearest hospital (Providence Centralia Hospital)

Calculate Travel Distance to Prestige Post-Acute and Rehab Center – Centralia

Add your location

Address

Compare Nursing Homes around Centralia

The information below is reported by the Washington Department of Social and Health Services, Residential Care Services.

2 facilities compared · CMS & WA Dept. of Health data

Prestige Post-Acute and Rehab Center – Centralia
NH
AL
IL
MC
Centralia
128
Facility 128
WA AVG 82
Rank #32 / 366
66.8%
Facility 66.8%
WA AVG 72.5%
Rank #220 / 310
-8%
3.55
Facility 3.55
WA AVG 4.22
Rank #70 / 90
-27% -16%
$12.7k
Facility $12.7k
WA AVG $87.7k
Rank #39 / 92
47
Facility 47
WA AVG 48.9
Rank #43 / 92
3.6
Facility 3.6
WA AVG 6.9
Rank #7 / 92
- 103 A+
9
Facility 9
WA AVG 51
Rank #593 / 628
-
$13.1MFiscal year ending 12/2023
Facility $13.1MFiscal year ending 12/2023
WA AVG $13.2M
Rank #23 / 94
$7.3MFiscal year ending 12/2023
Facility $7.3MFiscal year ending 12/2023
WA AVG $5.7M
Rank #41 / 94
55.6%Fiscal year ending 12/2023
Facility 55.6%Fiscal year ending 12/2023
WA AVG 45.5%
Rank #83 / 94
505373
Sharon Care Center
NH
AL
MC
SNF
Centralia
72
Facility 72
WA AVG 82
Rank #202 / 366
86.1%
Facility 86.1%
WA AVG 72.5%
Rank #67 / 310
+19%
4.21
Facility 4.21
WA AVG 4.22
Rank #38 / 90
+25% 0%
$0
Facility $0
WA AVG $87.7k
Rank #1 / 92
35
Facility 35
WA AVG 48.9
Rank #29 / 92
11.7
Facility 11.7
WA AVG 6.9
Rank #82 / 92
- 62 -
49
Facility 49
WA AVG 51
Rank #334 / 628
Summit Care LLC
$10.0MFiscal year ending 12/2023
Facility $10.0MFiscal year ending 12/2023
WA AVG $13.2M
Rank #59 / 94
$6.3MFiscal year ending 12/2023
Facility $6.3MFiscal year ending 12/2023
WA AVG $5.7M
Rank #54 / 94
63.6%Fiscal year ending 12/2023
Facility 63.6%Fiscal year ending 12/2023
WA AVG 45.5%
Rank #43 / 94
505429

Financial Assistance for
Nursing Home in Washington

Prestige Post-Acute and Rehab Center – Centralia is located in Centralia, Washington.
Here are the financial assistance programs available to residents in Washington.

Get Financial aid guidance

Community Options Program Entry System (COPES)

WA Medicaid COPES

Age 65+ or disabled
General Washington resident, Medicaid-eligible, nursing home-level care need.
Income Limits (2025) ~$2,829/month 300% FBR, individual
Asset Limits $2,000 (individual), $3,000 (couple).
WA

High demand in urban areas (e.g., Seattle).

Benefits
Personal care (5-7 hours/day) Respite (240 hours/year) Adult day care ($70/day) Home modifications ($1,500 avg.)

Washington Family Caregiver Support Program

WA NFCSP

Age Caregiver of someone 60+ (or with dementia)
General Washington resident.
Income Limits No strict limit; prioritizes low-income.
Asset Limits Not applicable.
WA

High urban demand; rural outreach.

Benefits
In-home respite (4-6 hours/day) Adult day care (~$70/day) Short-term facility care (up to 5 days)

Community First Choice (CFC)

Washington Community First Choice

Age 65+ (or disabled 18+)
General WA resident, Medicaid-eligible, need help with 2+ ADLs/IADLs.
Income Limits (2025) ~$2,829/month; QIT optional.
Asset Limits $2,000 (individual), $3,000 (couple).
WA

Broader than COPES; serves ~20,000; self-directed option.

Benefits
Personal care (4-6 hours/day) Respite (~240 hours/year) Assistive devices Training Transportation

Older Americans Act (OAA) Services

Washington OAA Services

Age 60+
General WA resident; no income/asset limits.
Income Limits (2025) None; donations encouraged.
Asset Limits Not assessed.
WA

13 AAAs; includes Meals on Wheels; rural focus.

Benefits
Meals (~$5-$7/meal) Transportation Homemaker services (~4 hours/week) Respite (~5 days/year) Legal aid

Medicare Savings Program (MSP)

Washington Medicare Savings Program

Age 65+ or disabled
General WA resident, Medicare Part A/B.
Income Limits (2025) ~$2,510/month (QMB), ~$3,380/month (SLMB), ~$3,598/month (QI)—individual.
Asset Limits $9,430 (individual), $14,130 (couple).
WA

Includes Extra Help for Part D; no waitlist.

Benefits
Covers Part B premiums ($174.70/month) Deductibles ($240/year) Copays (~20%)

VA Aid and Attendance (A&A) and Housebound Benefits

Washington VA Aid and Attendance/Housebound

Age 65+ or disabled veteran/spouse
General WA resident, wartime service, ADL help (A&A) or homebound.
Income Limits (2025) Net income < ~$1,984/month (veteran with dependent, A&A); pension offsets income.
Asset Limits ~$155,356 net worth
WA

High veteran use; supports rural/urban needs.

Benefits
Cash (~$1,433-$2,642/month veteran, ~$951-$1,318 spouse) for care costs

Senior Citizens Property Tax Exemption

Washington Senior Property Tax Exemption

Age 61+ or disabled retiree
General WA resident, homeowner, income-based.
Income Limits (2025) ~$45,000-$70,000/year varies by county, e.g., King: $70,000
Asset Limits Not assessed; home value cap varies ~$250,000-$400,000
WA

Saves ~$500-$1,500/year; offered statewide.

Benefits
Tax exemption (~$500-$1,500/year depending on county)

Senior Farmers’ Market Nutrition Program (SFMNP)

Washington SFMNP

Age 60+
General WA resident, low-income.
Income Limits (2025) ~$2,322/month 185% FPL
Asset Limits Not assessed.
WA

Vouchers (~$80/season); serves ~20,000 via AAAs.

Benefits
Vouchers (~$80/season) for produce at farmers’ markets

Frequently Asked Questions about Prestige Post-Acute and Rehab Center – Centralia

Is Prestige Post-Acute and Rehab Center – Centralia in a walkable area?

Prestige Post-Acute and Rehab Center – Centralia has a walk score of 9. Car-dependent. Most errands require a car, with limited nearby walkable options.

What is the occupancy rate at Prestige Post-Acute and Rehab Center – Centralia?

Prestige Post-Acute and Rehab Center – Centralia's occupancy is 66.8%.

Does Prestige Post-Acute and Rehab Center – Centralia operate as a for-profit or non-profit?

Prestige Post-Acute and Rehab Center – Centralia is registered as a for-profit in WA.

Are there photos of Prestige Post-Acute and Rehab Center – Centralia?

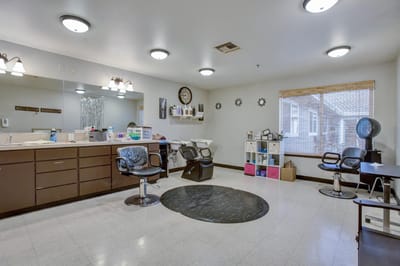
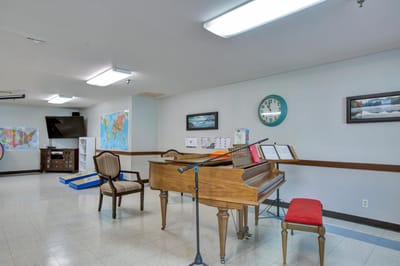
Yes — there are 6 photos of Prestige Post-Acute and Rehab Center – Centralia in the photo gallery on this page.

What is the address of Prestige Post-Acute and Rehab Center – Centralia?

Prestige Post-Acute and Rehab Center – Centralia is located at 917 S Scheuber Rd, Centralia, WA 98531.

What is the phone number of Prestige Post-Acute and Rehab Center – Centralia?

(360) 736-9384 will put you in contact with the team at Prestige Post-Acute and Rehab Center – Centralia.

Is Prestige Post-Acute and Rehab Center – Centralia Medicare or Medicaid certified?

Yes — Prestige Post-Acute and Rehab Center – Centralia is a CMS-certified provider of Medicare and Medicaid.

Guides for Better Senior Living

Care Cost Calculator: See Prices in Your Area

Nursing Home Data Explorer

Don’t Wait Too Long: 7 Red Flag Signs Your Parent Needs Assisted Living Now

The True Cost of Assisted Living in 2025 – And How Families Are Paying For It

Understanding Senior Living Costs: Pricing Models, Discounts & Financial Assistance