


Total staff
138
Employees
89
Contractors
49
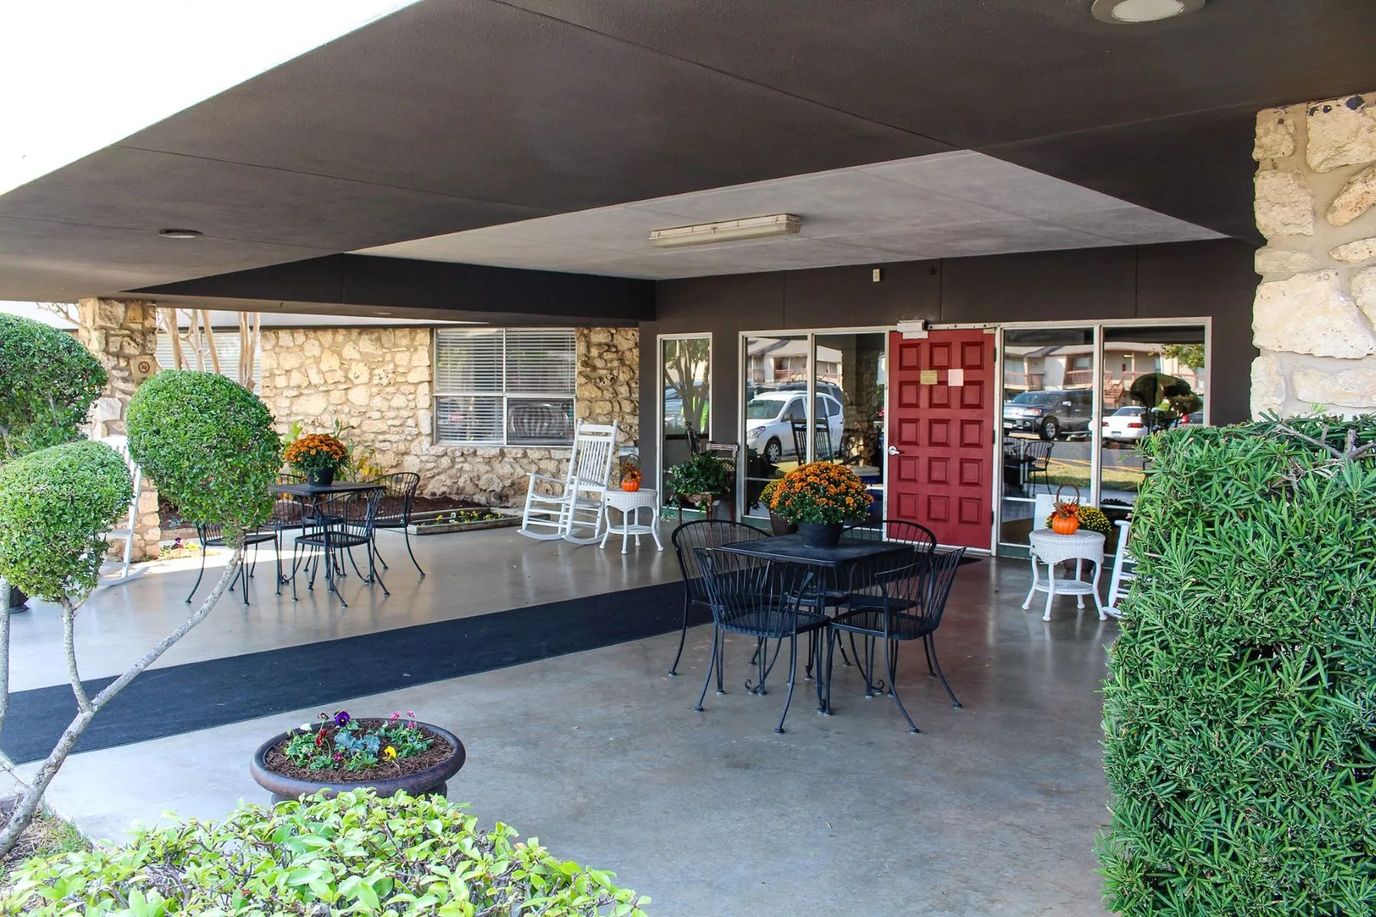
Owned by Maci Alexander, Jeffrey Place Healthcare Center is a skilled nursing home in Waco, Texas. The community offers skilled nursing, long-term nursing care, hospice care, palliative care, and memory care, giving families several care options in one location. Families can choose from Medicare, Medicaid, and private pay to cover both short-term and long-term care.
The community is certified for 95 beds and currently has an occupancy rate of about 68.6%. Residents stay an average of about 302 days, showing that the home mainly serves people who need long-term care rather than short rehabilitation stays. Nursing staff provide an average of about 3 hours and 47 minutes of care per resident daily. Residents get support from registered nurses, licensed practical nurses, and nurse aides.
Residents can join in an active resident council that meets regularly to discuss community policies, quality of care, and activities. Residents and families can share their opinions and stay involved in how the community is run.
The area has a Walk Score of 72. Family members and caregivers can easily visit and run errands here. Families considering Jeffrey Place Healthcare Center should ask which care programs, including memory care, hospice care, and palliative care, are available for their loved one’s specific needs.
| Staff type | Hours / Day / Resident | vs state avg |
|---|---|---|
|
Registered Nurse (RN)
| 18m per day | ▼ 30% State avg: 26m per day · National avg: 41m per day |
|
LPN / LVN
| 47m per day | ▼ 17% State avg: 57m per day · National avg: 52m per day |
|
Nurse Aide
| 2h 26m per day | ▲ 20% State avg: 2h 1m per day · National avg: 2h 21m per day |
|
Weekend Total Nursing
| 3h 14m per day | ▲ 9% State avg: 2h 59m per day · National avg: 3h 26m per day |
|
Physical Therapist
| 2m per day | ▼ 49% State avg: 4m per day · National avg: 4m per day |
|
Weekend RN
| 14m per day | ▼ 33% State avg: 21m per day · National avg: 29m per day |
Reporting period: October 1 – December 31, 2025 (Q4 2025). Source: CMS Payroll-Based Journal report.
Manages medical care and health needs.
Assists with medical care and medications.
Helps with daily care and mobility.
Total hours from contractors
1,721 contractor hours this quarter
| Certified Nursing Assistant | 35 | 0 | 35 | 10,742 | 92 | 100% | 7.1 |
| Medication Aide/Technician | 11 | 0 | 11 | 3,813 | 92 | 100% | 8.3 |
| Licensed Practical Nurse | 12 | 46 | 58 | 3,233 | 92 | 100% | 6.5 |
| Physical Therapy Aide | 4 | 0 | 4 | 1,598 | 75 | 82% | 7.9 |
| Speech Language Pathologist | 6 | 0 | 6 | 1,498 | 82 | 89% | 7.6 |
| RN Director of Nursing | 4 | 0 | 4 | 1,474 | 75 | 82% | 7.7 |
| Registered Nurse | 5 | 0 | 5 | 1,287 | 86 | 93% | 8 |
| Dietitian | 2 | 0 | 2 | 747 | 66 | 72% | 7.8 |
| Mental Health Service Worker | 1 | 0 | 1 | 534 | 67 | 73% | 8 |
| Nurse Practitioner | 1 | 0 | 1 | 520 | 65 | 71% | 8 |
| Qualified Social Worker | 3 | 0 | 3 | 418 | 69 | 75% | 4.7 |
| Administrator | 2 | 0 | 2 | 376 | 47 | 51% | 8 |
| Respiratory Therapy Technician | 2 | 0 | 2 | 202 | 71 | 77% | 2.7 |
| Physical Therapy Assistant | 1 | 0 | 1 | 202 | 42 | 46% | 4.8 |
| Medical Director | 0 | 1 | 1 | 42 | 6 | 7% | 7 |
| Occupational Therapy Aide | 0 | 1 | 1 | 23 | 3 | 3% | 7.5 |
| Occupational Therapy Assistant | 0 | 1 | 1 | 9 | 3 | 3% | 3 |
Includes penalties issued in 2024-2025
Federal penalties imposed by CMS for regulatory violations, including civil money penalties (fines) and denials of payment for new Medicare/Medicaid admissions.
Source: CMS Penalties Database (Data as of Jan 2026)
Texas average: $80K
Texas average: 2.5
Texas average: 0.2
Penalties are imposed by CMS for violations of federal nursing home regulations.
3 penalties in the past 3 years
Multiple penalties were reported in the last 3 years.
Last updated: Jan 2026
These measures show how residents usually do over time at this home, based on health outcomes and preventive care.
Texas average: 8.6
Texas average: 16.0
Texas average: 16.2%
Texas average: 16.2%
Texas average: 15.7%
Texas average: 3.2%
Texas average: 4.4%
Texas average: 0.8%
Texas average: 3.5%
Texas average: 2.9%
Texas average: 7.9%
Texas average: 97.3%
Texas average: 97.9%
Texas average: 2.13
Texas average: 2.07
Texas average: 90.4%
Texas average: 1.4%
Texas average: 88.0%
Texas average: 25.9%
Texas average: 12.0%
Quality measures are calculated from Minimum Data Set (MDS) assessments. For most measures, lower percentages indicate better care quality.
15% of new residents, usually for short-term rehab.
59% of new residents, often for short stays.
26% of new residents, often for long-term daily care.
Source: CMS Long-Term Care Facility Characteristics (Data as of Jan 2026)
Residents meet regularly to discuss policies, care quality, and activities
Organized group of residents that meets regularly to discuss facility policies, quality of life, and activities.
Data sourced from CMS Long-Term Care Facility Characteristics quarterly report. Payer mix reflects the current resident census by primary payment source.
Historical financial and operational data for Jeffrey Place Healthcare Center from 2011–2023, based on CMS SNF Cost Reports.
Key figures below are for fiscal year ending in 12/2023.
Based on CMS SNF Cost Report for fiscal year ending in 12/2023.
Most residents stay for extended periods and receive ongoing daily care.
Most new residents arrive under private pay (59% of admissions), and a typical private pay stay runs around 2 - 3 months.
Coverage residents most often arrive under.
Coverage residents most often leave under.
![]() 3.4 miles from city center
3.4 miles from city center
![]() Estimated distance in miles from Waco's city center to Jeffrey Place Healthcare Center's address, calculated via Google Maps.
Estimated distance in miles from Waco's city center to Jeffrey Place Healthcare Center's address, calculated via Google Maps.
Add your location
Info below is compiled from CMS reports & the TX Health & Human Services Commission (HHSC), senior community websites & trusted data sources such as Walk Score & BBB.
Communities are listed from highest to lowest based on our ranking methodology.
| St. Anthony‘s Care Center | NH MC SNF | Waco | 120
Facility
120
TX AVG
79
Rank
#204 / 972 |
90.8%
Facility
90.8%
TX AVG
67.3
Rank
#24 / 195 | +35% | 4.38
Facility
4.38
TX AVG
3.63
Rank
#47 / 239 | -67% | +21% | $3.3k
Facility
$3.3k
TX AVG
$81.8k
Rank
#63 / 244 | 14
Facility
14
TX AVG
25.9
Rank
#47 / 241 | 2.8
Facility
2.8
TX AVG
3.7
Rank
#79 / 241 | 2 | 109 | - |
7
Facility
7
TX AVG
41
Rank
#1272 / 1389 | St. Anthony's Care Center LLC | $10.0M*Fiscal year ending 12/2022These figures are from this home's most recent complete cost report — an older period than most facilities report. Compare with that in mind.
Facility
$10.0M*Fiscal year ending 12/2022These figures are from this home's most recent complete cost report — an older period than most facilities report. Compare with that in mind.
TX AVG
$8.4M
Rank
#148 / 245 | $3.2M*Fiscal year ending 12/2022These figures are from this home's most recent complete cost report — an older period than most facilities report. Compare with that in mind.
Facility
$3.2M*Fiscal year ending 12/2022These figures are from this home's most recent complete cost report — an older period than most facilities report. Compare with that in mind.
TX AVG
$3.5M
Rank
#184 / 245 | 31.5%*Fiscal year ending 12/2022These figures are from this home's most recent complete cost report — an older period than most facilities report. Compare with that in mind.
Facility
31.5%*Fiscal year ending 12/2022These figures are from this home's most recent complete cost report — an older period than most facilities report. Compare with that in mind.
TX AVG
47%
Rank
#179 / 245 | 676462 | ||||
| Quality Care of Waco | NH | Waco (Dean Highland) | 162
Facility
162
TX AVG
79
Rank
#43 / 972 |
41.0%
Facility
41.0%
TX AVG
67.3
Rank
#174 / 195 | -39% | 3.23
Facility
3.23
TX AVG
3.63
Rank
#181 / 239 | +18% | -11% | $147.7k
Facility
$147.7k
TX AVG
$81.8k
Rank
#219 / 244 | 19
Facility
19
TX AVG
25.9
Rank
#102 / 241 | 3.2
Facility
3.2
TX AVG
3.7
Rank
#119 / 241 | 5 | 67 | - |
29
Facility
29
TX AVG
41
Rank
#940 / 1389 | Waco Opco LLC | $3.5MFiscal year ending 07/2024
Facility
$3.5MFiscal year ending 07/2024
TX AVG
$8.4M
Rank
#242 / 245 | $2.8MFiscal year ending 07/2024
Facility
$2.8MFiscal year ending 07/2024
TX AVG
$3.5M
Rank
#225 / 245 | 81.1%Fiscal year ending 07/2024
Facility
81.1%Fiscal year ending 07/2024
TX AVG
47%
Rank
#11 / 245 | 455478 | ||||
| Wesley Woods Rehabilitation and Healthcare | NH MC RC SNF | Waco (West Waco) | 120
Facility
120
TX AVG
79
Rank
#204 / 972 |
72.5%
Facility
72.5%
TX AVG
67.3
Rank
#93 / 195 | +8% | 3.83
Facility
3.83
TX AVG
3.63
Rank
#77 / 239 | -31% | +5% | $17.6k
Facility
$17.6k
TX AVG
$81.8k
Rank
#105 / 244 | 30
Facility
30
TX AVG
25.9
Rank
#180 / 241 | 1.9
Facility
1.9
TX AVG
3.7
Rank
#19 / 241 | 4 | 87 | A+ |
39
Facility
39
TX AVG
41
Rank
#752 / 1389 | - | $10.6MFiscal year ending 08/2024
Facility
$10.6MFiscal year ending 08/2024
TX AVG
$8.4M
Rank
#115 / 245 | $5.3MFiscal year ending 08/2024
Facility
$5.3MFiscal year ending 08/2024
TX AVG
$3.5M
Rank
#48 / 245 | 50.2%Fiscal year ending 08/2024
Facility
50.2%Fiscal year ending 08/2024
TX AVG
47%
Rank
#17 / 245 | 676211 | ||||
| Jeffrey Place Healthcare Center | NH HOS MC PC SNF | Waco (Richland Hills) | 95
Facility
95
TX AVG
79
Rank
#386 / 972 |
68.6%
Facility
68.6%
TX AVG
67.3
Rank
#105 / 195 | +2% | 3.78
Facility
3.78
TX AVG
3.63
Rank
#77 / 239 | -53% | +4% | $22.1k
Facility
$22.1k
TX AVG
$81.8k
Rank
#116 / 244 | 39
Facility
39
TX AVG
25.9
Rank
#205 / 241 | 3.0
Facility
3.0
TX AVG
3.7
Rank
#100 / 241 | 2 | 65 | - |
72
Facility
72
TX AVG
41
Rank
#108 / 1389 | Maci Alexander | $6.0MFiscal year ending 12/2023
Facility
$6.0MFiscal year ending 12/2023
TX AVG
$8.4M
Rank
#185 / 245 | $3.2MFiscal year ending 12/2023
Facility
$3.2MFiscal year ending 12/2023
TX AVG
$3.5M
Rank
#210 / 245 | 52.7%Fiscal year ending 12/2023
Facility
52.7%Fiscal year ending 12/2023
TX AVG
47%
Rank
#184 / 245 | 455489 | ||||
| Lakeshore Village Nursing and Rehab | NH SNF | Waco (Cedar Ridge) | 151
Facility
151
TX AVG
79
Rank
#62 / 972 |
77.9%
Facility
77.9%
TX AVG
67.3
Rank
#69 / 195 | +16% | 3.79
Facility
3.79
TX AVG
3.63
Rank
#77 / 239 | -15% | +4% | $136.0k
Facility
$136.0k
TX AVG
$81.8k
Rank
#214 / 244 | 49
Facility
49
TX AVG
25.9
Rank
#224 / 241 | 4.9
Facility
4.9
TX AVG
3.7
Rank
#213 / 241 | 8 | 118 | - |
38
Facility
38
TX AVG
41
Rank
#782 / 1389 | Waco Nursing And Rehab Center LLC | $12.6MFiscal year ending 08/2024
Facility
$12.6MFiscal year ending 08/2024
TX AVG
$8.4M
Rank
#55 / 245 | $0.0kFiscal year ending 08/2024
Facility
$0.0kFiscal year ending 08/2024
TX AVG
$3.5M
Rank
#51 / 245 | 0%Fiscal year ending 08/2024
Facility
0%Fiscal year ending 08/2024
TX AVG
47%
Rank
#111 / 245 | 675438 |
Jeffrey Place Healthcare Center is located in Waco, Texas.
Here are the financial assistance programs available to residents in Texas.
Jeffrey Place Healthcare Center is in the Richland Hills neighborhood.
Jeffrey Place Healthcare Center has a walk score of 72. Very walkable. Most errands can be accomplished on foot, and many essentials are within a short walk.
Jeffrey Place Healthcare Center's occupancy is 77.4%.
No, Jeffrey Place Healthcare Center has a no-pet policy.
Jeffrey Place Healthcare Center is registered as a for-profit.
Yes — there is 1 photo of Jeffrey Place Healthcare Center in the photo gallery on this page.
Jeffrey Place Healthcare Center is located at 820 Jeffrey St, Waco, TX 76710.
Care Cost Calculator: See Prices in Your Area
Nursing Home Data Explorer
Don’t Wait Too Long: 7 Red Flag Signs Your Parent Needs Assisted Living Now
The True Cost of Assisted Living in 2025 – And How Families Are Paying For It
Understanding Senior Living Costs: Pricing Models, Discounts & Financial Assistance


