


Total health inspections
4
Texas average 7.4
Last Health inspection on Dec 2024
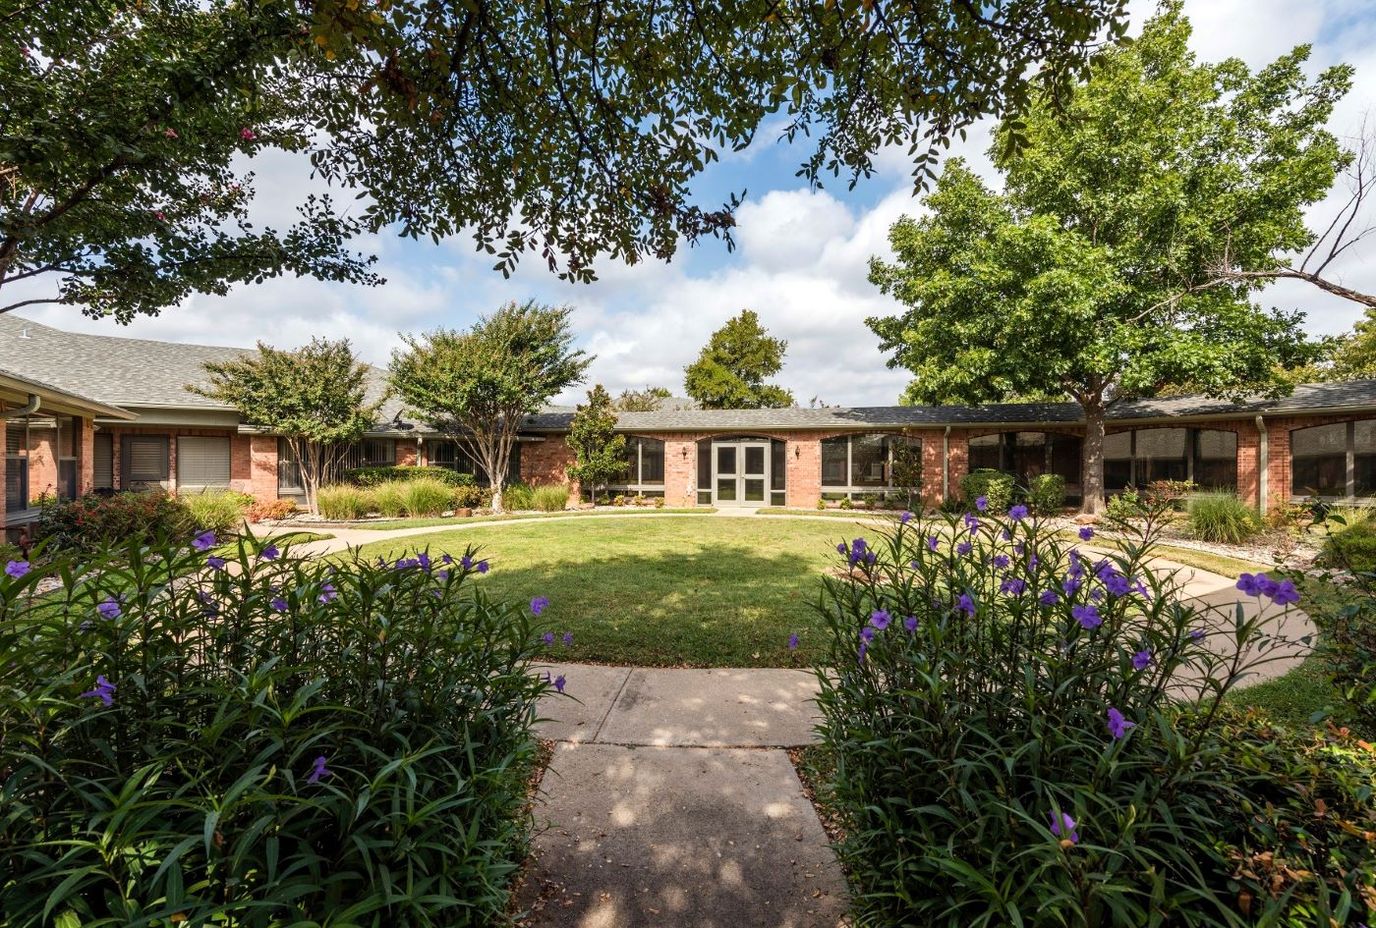
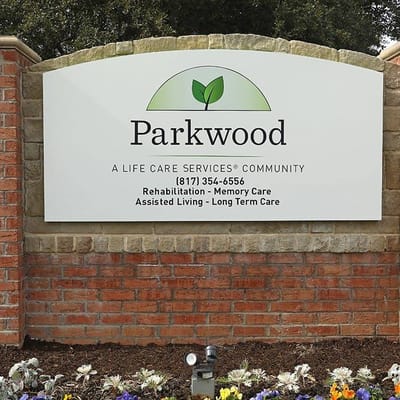


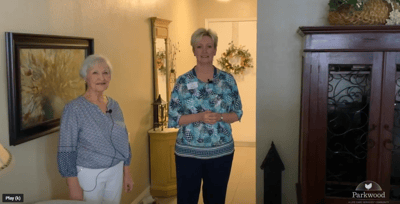

Parkwood Assisted Living in Bedford, Texas, provides independent living, assisted living, memory care, and nursing care services within a single community. This range of support can make it easier for older adults to remain in the same setting as their care needs change over time. The community is operated by LCS-PHC LLC and owned by LCS PHC Operator MM LLC.
The community has 84 licensed beds, with 53 currently occupied, and accepts Medicare, Medicaid, and private-pay residents. An average stay of about 63 days indicates a mix of short-term rehabilitation and longer-term care needs among residents.
Care is supported by a combination of registered nurses, licensed practical or vocational nurses, and nurse aides, totaling nearly five hours of nursing attention per resident each day. Alzheimer’s certification also allows the community to provide specialized support for individuals living with memory-related conditions.
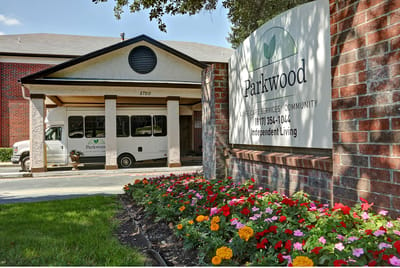
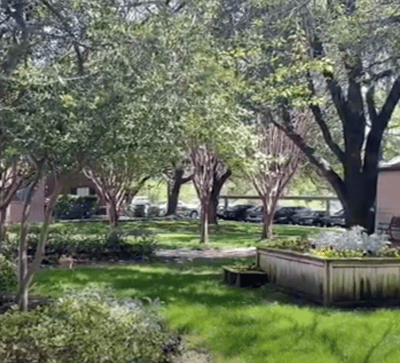
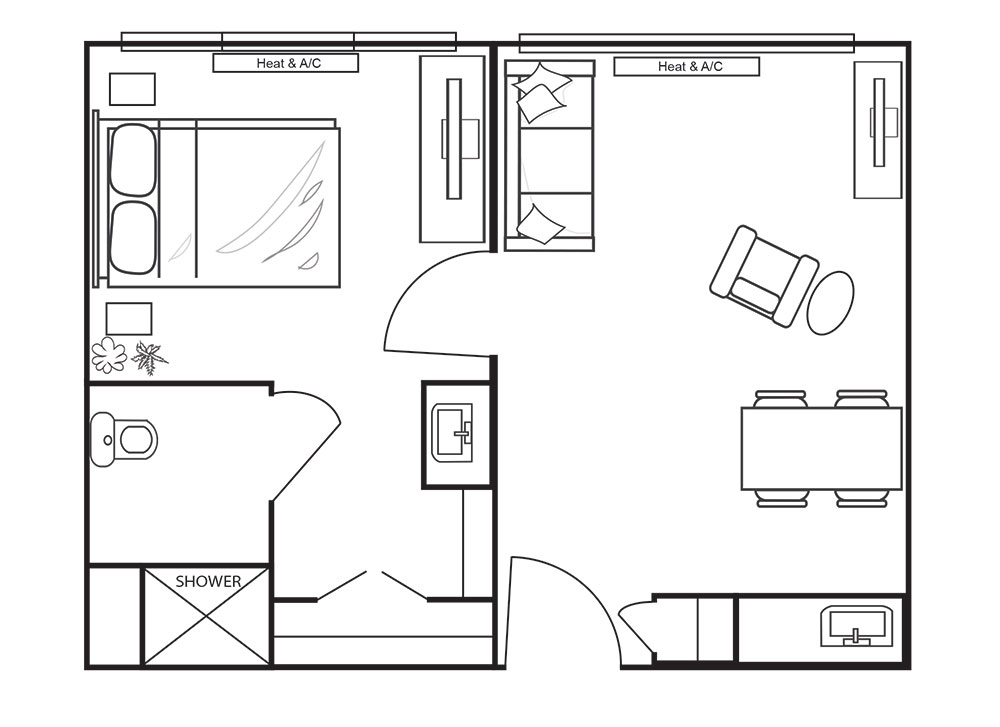
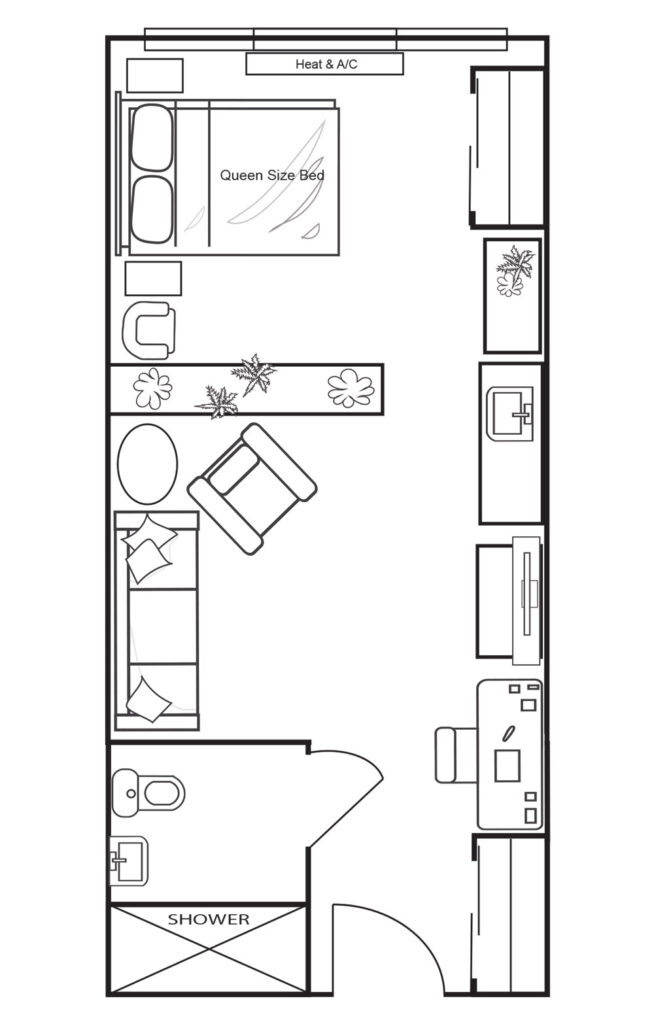
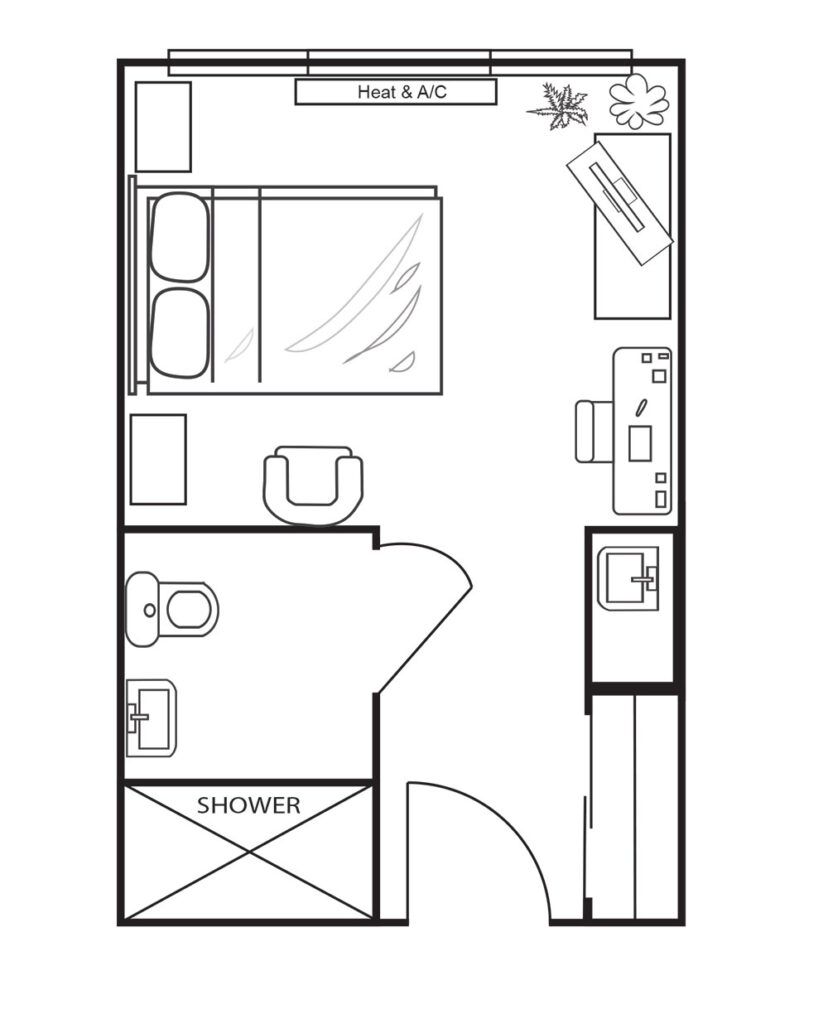
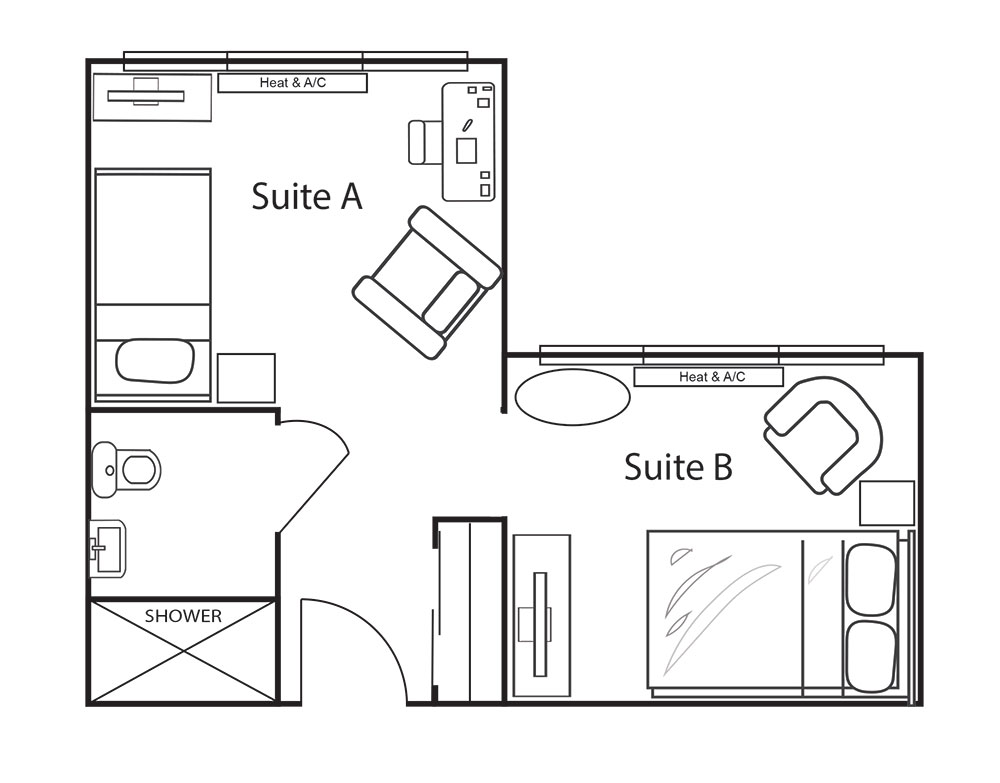
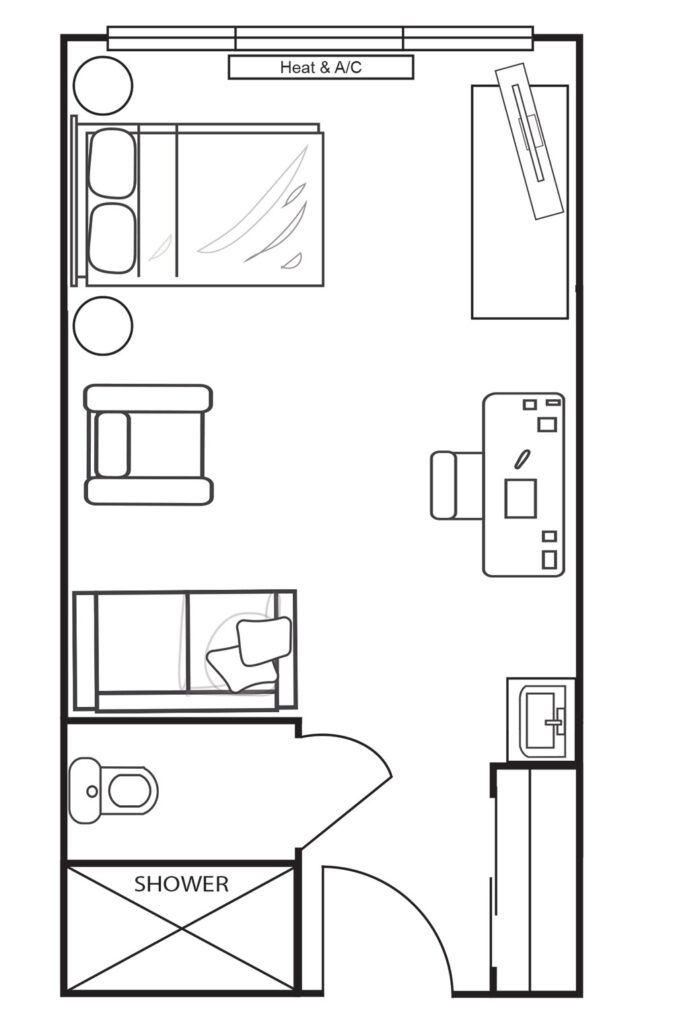
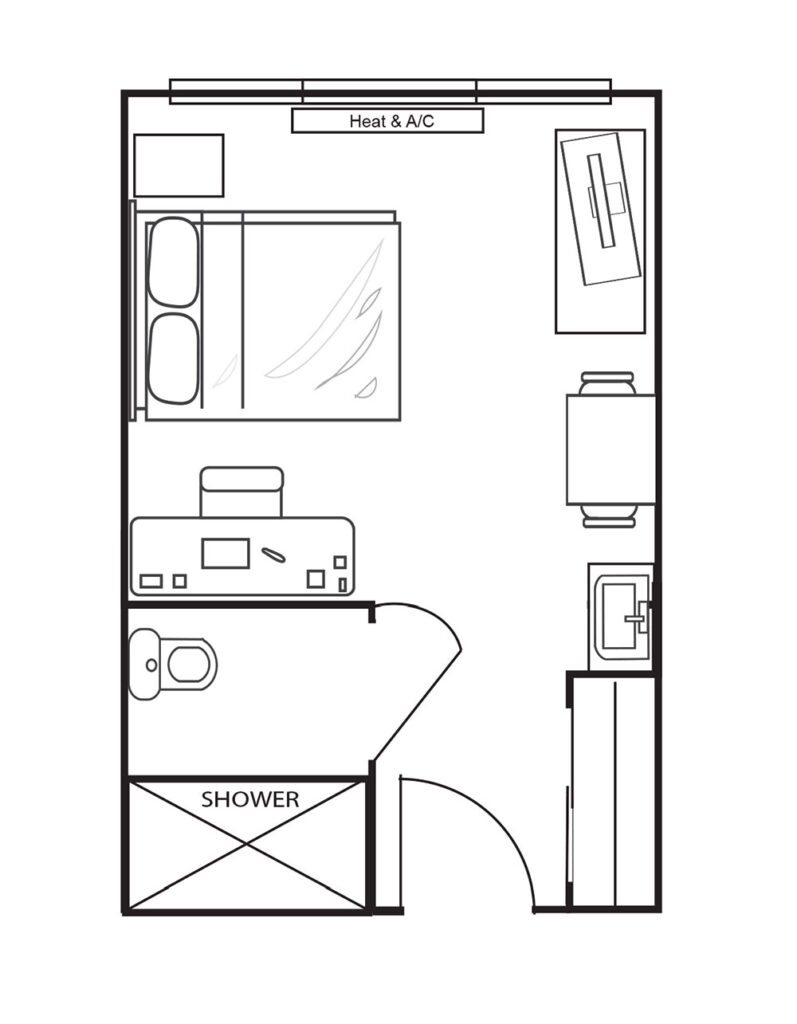
Residents have access to daily meals, housekeeping, transportation to medical appointments, social and recreational activities, emergency call systems, and 24-hour assistance. Housing options include studio, suite, and one-bedroom accommodations within a single-story building, and pets are welcome. Located in an area with a Walk Score of 34, most errands and outings require transportation by car rather than walking.
Inspection reports have identified recurring concerns in areas such as medication management, resident-transfer supervision, and infection-control practices. Previous reviews also noted issues involving care planning and food storage. Families considering the community may want to discuss the steps taken to address these findings and improve oversight.
| Staff type | Hours / Day / Resident | vs state avg |
|---|---|---|
|
Registered Nurse (RN)
| 28m per day | ▲ 7% State avg: 26m per day · National avg: 41m per day |
|
LPN / LVN
| 46m per day | ▼ 19% State avg: 57m per day · National avg: 52m per day |
|
Nurse Aide
| 2h 0m per day | ■ Avg State avg: 2h 1m per day · National avg: 2h 21m per day |
|
Weekend Total Nursing
| 2h 55m per day | ■ Avg State avg: 2h 59m per day · National avg: 3h 26m per day |
|
Physical Therapist
| 6m per day | ▲ 40% State avg: 4m per day · National avg: 4m per day |
|
Weekend RN
| 21m per day | ■ Avg State avg: 21m per day · National avg: 29m per day |
Parkwood Assisted Living is legally operated by Lcs-Phc LLC.
In Texas, the Health and Human Services Commission (HHSC) is the primary regulatory body that conducts unannounced inspections and publishes quality reports for all long-term care homes.
Citations
| This Facility | TX Average | vs. TX Avg |
|---|---|---|---|
|
Total citations
| 3 | 6 | This facility has 50% fewer total citations than a typical Texas nursing home (3 vs. TX avg 6).↓ 50% better |
|
Health citations
| 2 | 2 | This facility has health citations in line with the Texas average (2 vs. TX avg 2).— At avg |
|
Life safety citations
| 1 | 6 | This facility has 83% fewer life safety citations than a typical Texas nursing home (1 vs. TX avg 6).↓ 83% better |
|
Citations per year
| 0.8 | 1.5 | This facility has 47% fewer citations per year than a typical Texas nursing home (0.8 vs. TX avg 1.5).↓ 47% better |
Inspections
| This Facility | TX Average | vs. TX Avg |
|---|---|---|---|
|
Inspections with citations
| 2 | 1 | This facility has 100% more inspections with citations than a typical Texas nursing home (2 vs. TX avg 1).↑ 100% worse |
Texas average 7.4
Last Health inspection on Dec 2024
Texas average 25.9
Texas average 3.67
Health citations are formal notices following inspections when they fail to comply with safety and care standards.
12 of 15 citations resulted from standard inspections; and 3 of 15 resulted from complaint investigations.
Texas average: 2
Texas average: 0.4
Reporting period: October 1 – December 31, 2025 (Q4 2025). Source: CMS Payroll-Based Journal report.
Manages medical care and health needs.
Assists with medical care and medications.
Helps with daily care and mobility.
Total hours from contractors
3,118 contractor hours this quarter
| Certified Nursing Assistant | 32 | 52 | 84 | 16,599 | 92 | 100% | 9.7 |
| Licensed Practical Nurse | 10 | 22 | 32 | 5,932 | 92 | 100% | 11.1 |
| Registered Nurse | 8 | 0 | 8 | 3,923 | 92 | 100% | 10 |
| Medication Aide/Technician | 4 | 0 | 4 | 2,283 | 92 | 100% | 10.9 |
| RN Director of Nursing | 4 | 0 | 4 | 1,326 | 70 | 76% | 8.2 |
| Speech Language Pathologist | 7 | 0 | 7 | 1,026 | 68 | 74% | 7 |
| Respiratory Therapy Technician | 4 | 0 | 4 | 880 | 79 | 86% | 5.2 |
| Physical Therapy Aide | 3 | 0 | 3 | 719 | 66 | 72% | 6.5 |
| Physical Therapy Assistant | 4 | 0 | 4 | 583 | 76 | 83% | 6.1 |
| Qualified Social Worker | 5 | 0 | 5 | 552 | 65 | 71% | 5.6 |
| Administrator | 1 | 0 | 1 | 512 | 64 | 70% | 8 |
| Mental Health Service Worker | 1 | 0 | 1 | 512 | 64 | 70% | 8 |
| Other Dietary Services Staff | 1 | 0 | 1 | 501 | 65 | 71% | 7.7 |
| Dietitian | 1 | 0 | 1 | 480 | 60 | 65% | 8 |
| Nurse Practitioner | 1 | 0 | 1 | 472 | 59 | 64% | 8 |
| Dental Services Staff | 1 | 0 | 1 | 318 | 36 | 39% | 8.8 |
| Occupational Therapy Aide | 0 | 1 | 1 | 60 | 12 | 13% | 5 |
| Occupational Therapy Assistant | 0 | 1 | 1 | 58 | 8 | 9% | 7.2 |
| Medical Director | 0 | 1 | 1 | 29 | 15 | 16% | 1.9 |
Federal penalties imposed by CMS for regulatory violations, including civil money penalties (fines) and denials of payment for new Medicare/Medicaid admissions.
Source: CMS Penalties Database
No penalties in the past 3 years
No civil money penalties or payment denials were reported in the last 3 years.
These measures show how residents usually do over time at this home, based on health outcomes and preventive care.
Texas average: 8.6
Texas average: 16.0
Texas average: 16.2%
Texas average: 15.7%
Texas average: 3.2%
Texas average: 4.4%
Texas average: 0.8%
Texas average: 3.5%
Texas average: 2.9%
Texas average: 7.9%
Texas average: 97.3%
Texas average: 97.9%
Texas average: 2.13
Texas average: 2.07
Texas average: 90.4%
Texas average: 1.4%
Texas average: 88.0%
Texas average: 25.9%
Texas average: 12.0%
Texas average: 0.8%
Texas average: 53.7%
Texas average: 50.6%
Quality measures are calculated from Minimum Data Set (MDS) assessments. For most measures, lower percentages indicate better care quality.
25% of new residents, usually for short-term rehab.
71% of new residents, often for short stays.
4% of new residents, often for long-term daily care.
Source: CMS Long-Term Care Facility Characteristics (Data as of Jan 2026)
Residents meet regularly to discuss policies, care quality, and activities
Organized group of residents that meets regularly to discuss facility policies, quality of life, and activities.
Data sourced from CMS Long-Term Care Facility Characteristics quarterly report. Payer mix reflects the current resident census by primary payment source.
Historical financial and operational data for Parkwood Assisted Living from 2011–2023, based on CMS SNF Cost Reports.
Key figures below are for fiscal year ending in 12/2023.
Based on CMS SNF Cost Report for fiscal year ending in 12/2023.
Minimum Age: 55 Years Old
Pets Allowed
Housing Options: Studio / Suite / 1 Bed
Building Type: Single-story
Transportation Services
Fitness and Recreation
Residents typically stay for brief periods, with frequent admissions and discharges throughout the year.
Most new residents arrive under private pay (71% of admissions), and a typical private pay stay runs around 4 - 5 months.
Coverage residents most often arrive under.
Coverage residents most often leave under.
![]() 2.0 miles from city center
2.0 miles from city center
![]() Estimated distance in miles from Bedford's city center to Parkwood Assisted Living's address, calculated via Google Maps.
— 5.65 miles to nearest hospital (Texas Health Arlington Memorial Hospital)
Estimated distance in miles from Bedford's city center to Parkwood Assisted Living's address, calculated via Google Maps.
— 5.65 miles to nearest hospital (Texas Health Arlington Memorial Hospital)
Add your location
The information below is reported by the Texas Health and Human Services Commission.
| Parkwood Assisted Living | NH AL IL MC | Bedford | 84 | - | - | 4.87
Facility
4.87
TX AVG
3.63
Rank
#21 / 273 | -36% | +34% | $0
Facility
$0
TX AVG
$81.8k
Rank
#1 / 278 | 15
Facility
15
TX AVG
25.9
Rank
#61 / 274 | 3.8
Facility
3.8
TX AVG
3.7
Rank
#190 / 274 | - | 103 | - | 34 | Lcs Phc Operator Mm LLC | $8.2MFiscal year ending 12/2023
Facility
$8.2MFiscal year ending 12/2023
TX AVG
$8.4M
Rank
#143 / 280 | $5.8MFiscal year ending 12/2023
Facility
$5.8MFiscal year ending 12/2023
TX AVG
$3.5M
Rank
#91 / 280 | 70.3%Fiscal year ending 12/2023
Facility
70.3%Fiscal year ending 12/2023
TX AVG
47%
Rank
#55 / 280 | 675565 | ||||
| Hurst Plaza Nursing and Rehab | NH HOS SNF | Hurst | 106 |
70.5%
Facility
70.5%
TX AVG
68.2
Rank
#112 / 220 | +3% | 3.47
Facility
3.47
TX AVG
3.63
Rank
#137 / 273 | -22% | -4% | $6.5k
Facility
$6.5k
TX AVG
$81.8k
Rank
#75 / 278 | 13
Facility
13
TX AVG
25.9
Rank
#44 / 274 | 4.3
Facility
4.3
TX AVG
3.7
Rank
#219 / 274 | - | 75 | - | 73 | Hurst Nursing And Rehab Center LLC | $6.9MFiscal year ending 12/2023
Facility
$6.9MFiscal year ending 12/2023
TX AVG
$8.4M
Rank
#192 / 280 | $0.0kFiscal year ending 12/2023
Facility
$0.0kFiscal year ending 12/2023
TX AVG
$3.5M
Rank
#223 / 280 | 0%Fiscal year ending 12/2023
Facility
0%Fiscal year ending 12/2023
TX AVG
47%
Rank
#195 / 280 | 455850 |
Parkwood Assisted Living is located in Bedford, Texas.
Here are the financial assistance programs available to residents in Texas.
Parkwood Assisted Living is legally operated by Lcs-Phc LLC.
Parkwood Assisted Living has a walk score of 34. Somewhat walkable. A few nearby services may be reachable on foot, but most trips require transportation.
Parkwood Assisted Living's occupancy is 62.6%.
Parkwood Assisted Living is registered as a for-profit in TX.
Parkwood Assisted Living has 84 beds.
Parkwood Assisted Living has had 3 reported citations since 2022 according to records from Texas Health and Human Services (HHSC).
Yes — there are 20 photos of Parkwood Assisted Living in the photo gallery on this page.
Care Cost Calculator: See Prices in Your Area
Nursing Home Data Explorer
Don’t Wait Too Long: 7 Red Flag Signs Your Parent Needs Assisted Living Now
The True Cost of Assisted Living in 2025 – And How Families Are Paying For It
Understanding Senior Living Costs: Pricing Models, Discounts & Financial Assistance


