


Total staff
98
Employees
80
Contractors
18
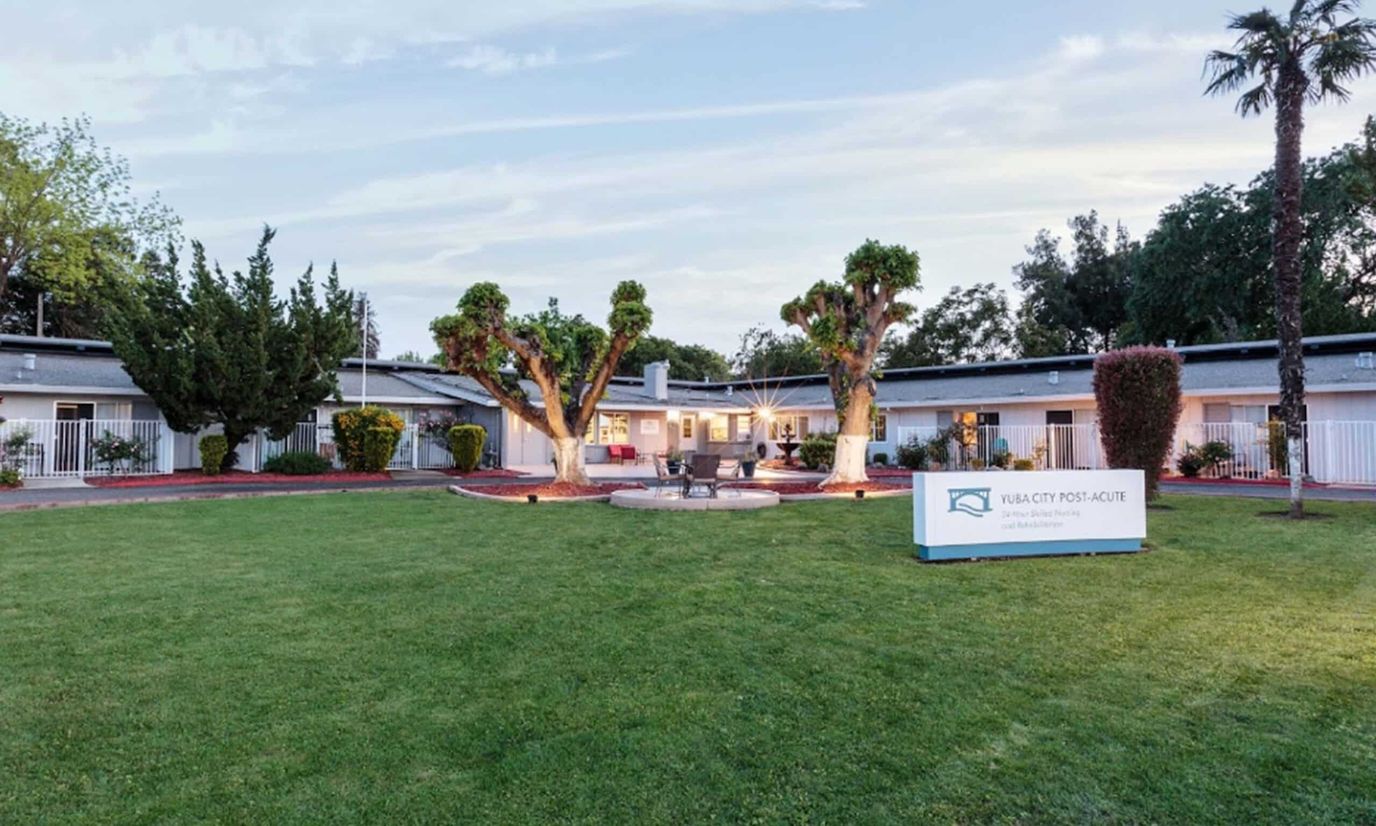
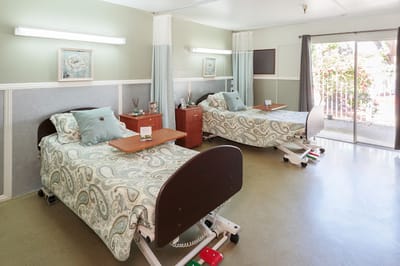
Situated in the vibrant California, Yuba City Post-Acute is a Medicare-certified facility renowned for its cheerful staff dedicated to surpassing expectations and aiding seniors in achieving their optimal functional state. With round-the-clock skilled nursing care, the facility stands out as a four-star haven with 59 beds.
Yuba City Post-Acute sets itself apart by providing comprehensive nursing home care, offering services such as speech, physical, and occupational therapy. The facility’s commitment to excellence is reflected not only in its skilled nursing offerings but also in its adherence to nursing home qualifications, making it a great choice for those seeking top-tier care in a vibrant and supportive environment.
| Staff type | Hours / Day / Resident | vs state avg |
|---|---|---|
|
Registered Nurse (RN)
| 23m per day | ▼ 42% State avg: 39m per day · National avg: 41m per day |
|
LPN / LVN
| 1h 3m per day | ▼ 14% State avg: 1h 13m per day · National avg: 52m per day |
|
Nurse Aide
| 2h 41m per day | ■ Avg State avg: 2h 39m per day · National avg: 2h 21m per day |
|
Weekend Total Nursing
| 3h 51m per day | ▼ 6% State avg: 4h 5m per day · National avg: 3h 26m per day |
|
Physical Therapist
| 4m per day | ▼ 21% State avg: 5m per day · National avg: 4m per day |
|
Weekend RN
| 25m per day | ▼ 18% State avg: 30m per day · National avg: 29m per day |
Reporting period: October 1 – December 31, 2025 (Q4 2025). Source: CMS Payroll-Based Journal report.
Manages medical care and health needs.
Assists with medical care and medications.
Helps with daily care and mobility.
Total hours from contractors
3,076 contractor hours this quarter
| Certified Nursing Assistant | 47 | 0 | 47 | 13,908 | 92 | 100% | 7.4 |
| Licensed Practical Nurse | 15 | 0 | 15 | 4,961 | 92 | 100% | 8.1 |
| Registered Nurse | 6 | 0 | 6 | 1,473 | 91 | 99% | 6.7 |
| Speech Language Pathologist | 0 | 2 | 2 | 1,072 | 72 | 78% | 8.5 |
| Other Dietary Services Staff | 5 | 0 | 5 | 778 | 92 | 100% | 7.4 |
| Physical Therapy Aide | 0 | 2 | 2 | 746 | 66 | 72% | 7.7 |
| Dietitian | 2 | 0 | 2 | 524 | 69 | 75% | 7.1 |
| Physical Therapy Assistant | 0 | 3 | 3 | 521 | 64 | 70% | 7.8 |
| Dental Services Staff | 1 | 0 | 1 | 515 | 65 | 71% | 7.9 |
| Nurse Practitioner | 1 | 0 | 1 | 496 | 63 | 68% | 7.9 |
| RN Director of Nursing | 1 | 0 | 1 | 486 | 70 | 76% | 6.9 |
| Respiratory Therapy Technician | 0 | 6 | 6 | 342 | 57 | 62% | 4.5 |
| Administrator | 1 | 0 | 1 | 256 | 64 | 70% | 4 |
| Qualified Social Worker | 0 | 3 | 3 | 163 | 42 | 46% | 3.9 |
| Medical Director | 0 | 1 | 1 | 160 | 40 | 43% | 4 |
| Occupational Therapy Aide | 1 | 0 | 1 | 114 | 16 | 17% | 7.1 |
| Feeding Assistant | 0 | 1 | 1 | 72 | 9 | 10% | 8 |
Federal penalties imposed by CMS for regulatory violations, including civil money penalties (fines) and denials of payment for new Medicare/Medicaid admissions.
Source: CMS Penalties Database
No penalties in the past 3 years
No civil money penalties or payment denials were reported in the last 3 years.
These measures show how residents usually do over time at this home, based on health outcomes and preventive care.
California average: 6.6
California average: 11.3
California average: 11.1%
California average: 12.0%
California average: 11.3%
California average: 1.7%
California average: 5.0%
California average: 1.2%
California average: 4.2%
California average: 6.7%
California average: 10.1%
California average: 98.5%
California average: 98.2%
California average: 2.25
California average: 1.59
California average: 94.0%
California average: 1.5%
California average: 93.2%
California average: 23.2%
California average: 11.2%
California average: 0.8%
California average: 53.7%
California average: 50.6%
Quality measures are calculated from Minimum Data Set (MDS) assessments. For most measures, lower percentages indicate better care quality.
65% of new residents, usually for short-term rehab.
32% of new residents, often for short stays.
3% of new residents, often for long-term daily care.
Source: CMS Long-Term Care Facility Characteristics (Data as of Jan 2026)
Residents meet regularly to discuss policies, care quality, and activities
State-approved Nurse Aide Training and Competency Evaluation Program on-site
Organized group of residents that meets regularly to discuss facility policies, quality of life, and activities.
Data sourced from CMS Long-Term Care Facility Characteristics quarterly report. Payer mix reflects the current resident census by primary payment source.
Historical financial and operational data for Yuba City Post-Acute from 2011–2023, based on CMS SNF Cost Reports.
Key figures below are for fiscal year ending in 12/2023.
Based on CMS SNF Cost Report for fiscal year ending in 12/2023.
Most residents typically stay for a few weeks or months before returning home or moving on.
Most new residents arrive under Medicare (65% of admissions), and a typical Medicare stay runs around 1 - 2 months.
Coverage residents most often arrive under.
Coverage residents most often leave under.
![]() 0.5 miles from city center
0.5 miles from city center
![]() Estimated distance in miles from Yuba City's city center to Yuba City Post-Acute's address, calculated via Google Maps.
Estimated distance in miles from Yuba City's city center to Yuba City Post-Acute's address, calculated via Google Maps.
Add your location
Info below is compiled from CMS reports & the CA Dept. of Social Services (CDSS), senior community websites & trusted data sources such as Walk Score & BBB.
Communities are listed from highest to lowest based on our ranking methodology.
| The Fountains Skilled Nursing Care | NH HOS | Yuba City | 80
Facility
80
CA AVG
104
Rank
#911 / 1644 |
70.0%
Facility
70.0%
CA AVG
73.9
Rank
#928 / 1492 | -5% | 4.20
Facility
4.20
CA AVG
4.22
Rank
#116 / 293 | +10% | 0% | $0
Facility
$0
CA AVG
$56.5k
Rank
#1 / 298 | 89
Facility
89
CA AVG
81
Rank
#461 / 1400 | 28
Facility
28
CA AVG
50.2
Rank
#85 / 293 | 5.6
Facility
5.6
CA AVG
4.6
Rank
#234 / 293 | - | 56 | - |
55
Facility
55
CA AVG
57
Rank
#1213 / 2087 | Stone Point Health | $25.2MFiscal year ending 12/2023
Facility
$25.2MFiscal year ending 12/2023
CA AVG
$17.0M
Rank
#47 / 295 | $14.8MFiscal year ending 12/2023
Facility
$14.8MFiscal year ending 12/2023
CA AVG
$7.0M
Rank
#32 / 295 | 58.5%Fiscal year ending 12/2023
Facility
58.5%Fiscal year ending 12/2023
CA AVG
45.2%
Rank
#183 / 295 | 555430 | ||||
| Yuba City Post-Acute | NH HOS MC PC RC SNF | Yuba City | 59
Facility
59
CA AVG
104
Rank
#1084 / 1644 |
95.6%
Facility
95.6%
CA AVG
73.9
Rank
#195 / 1492 | +29% | 3.69
Facility
3.69
CA AVG
4.22
Rank
#201 / 293 | -31% | -13% | $0
Facility
$0
CA AVG
$56.5k
Rank
#1 / 298 | - | 48
Facility
48
CA AVG
50.2
Rank
#178 / 293 | 6.0
Facility
6.0
CA AVG
4.6
Rank
#244 / 293 | - | 56 | - |
72
Facility
72
CA AVG
57
Rank
#673 / 2087 | Hudson River Opco LLC | $10.8MFiscal year ending 12/2023
Facility
$10.8MFiscal year ending 12/2023
CA AVG
$17.0M
Rank
#213 / 295 | $4.9MFiscal year ending 12/2023
Facility
$4.9MFiscal year ending 12/2023
CA AVG
$7.0M
Rank
#262 / 295 | 45.2%Fiscal year ending 12/2023
Facility
45.2%Fiscal year ending 12/2023
CA AVG
45.2%
Rank
#246 / 295 | 55092 | ||||
| The Bridgeview Post Acute | NH SNF | Yuba City | 130
Facility
130
CA AVG
104
Rank
#485 / 1644 |
91.2%
Facility
91.2%
CA AVG
73.9
Rank
#318 / 1492 | +23% | 4.16
Facility
4.16
CA AVG
4.22
Rank
#116 / 293 | -23% | -1% | $99.3k
Facility
$99.3k
CA AVG
$56.5k
Rank
#285 / 298 | - | 74
Facility
74
CA AVG
50.2
Rank
#246 / 293 | 6.2
Facility
6.2
CA AVG
4.6
Rank
#249 / 293 | 4 | 119 | A+ |
56
Facility
56
CA AVG
57
Rank
#1178 / 2087 | - | $14.0MFiscal year ending 12/2023
Facility
$14.0MFiscal year ending 12/2023
CA AVG
$17.0M
Rank
#204 / 295 | $6.5MFiscal year ending 12/2023
Facility
$6.5MFiscal year ending 12/2023
CA AVG
$7.0M
Rank
#160 / 295 | 46.1%Fiscal year ending 12/2023
Facility
46.1%Fiscal year ending 12/2023
CA AVG
45.2%
Rank
#59 / 295 | 56346 |
Yuba City Post-Acute is located in Yuba City, California.
Here are the financial assistance programs available to residents in California.
Yuba City Post-Acute has a walk score of 72. Very walkable. Most errands can be accomplished on foot, and many essentials are within a short walk.
Yuba City Post-Acute's occupancy is 90.4%.
No, Yuba City Post-Acute has a no-pet policy.
Yuba City Post-Acute is registered as a for-profit.
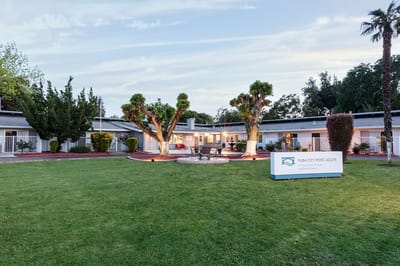
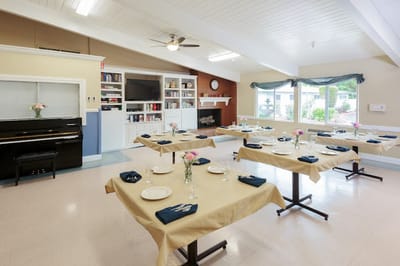
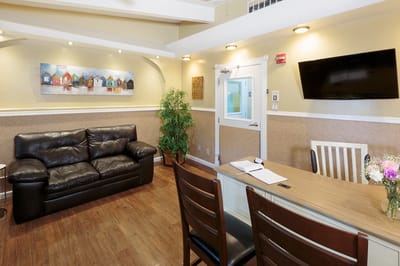
Yes — there are 5 photos of Yuba City Post-Acute in the photo gallery on this page.
Yuba City Post-Acute is located at 1220 Plumas St, Yuba City, CA 95991.
(530) 671-0550 will put you in contact with the team at Yuba City Post-Acute.
Care Cost Calculator: See Prices in Your Area
Nursing Home Data Explorer
Don’t Wait Too Long: 7 Red Flag Signs Your Parent Needs Assisted Living Now
The True Cost of Assisted Living in 2025 – And How Families Are Paying For It
Understanding Senior Living Costs: Pricing Models, Discounts & Financial Assistance


