


Total health inspections
12
California average 12.5
Last Health inspection on Oct 2025
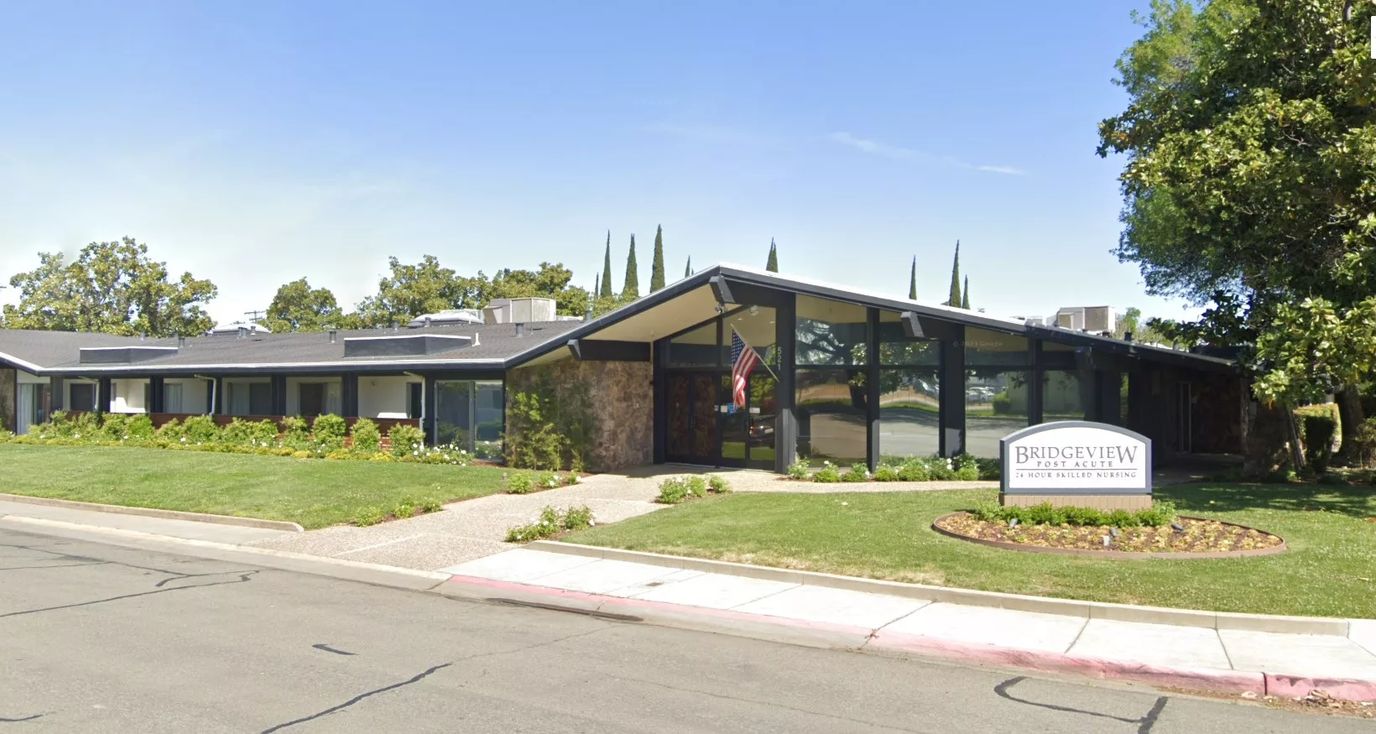


Nestled in Yuba City, The Bridgeview Post Acute exists as a 24-hour skilled nursing home with a rich history dating back to its establishment in 1970. Evolving from its origins, this facility has consistently delivered exceptional care as a skilled nursing and rehab facility. Having undergone purposeful renovations, it now serves as a leading short-term rehabilitation center in Yuba City.
The home takes pride in its comprehensive approach, featuring an activities program, social services, and a team of dedicated professionals providing top-notch care. Beyond meeting nursing home requirements, the facility excels in supporting families during the transition from the facility back to their own homes. This considerate and vibrant nursing home not only focuses on skilled nursing services but also fosters a senior living experience that is both compassionate and enriching.
| Staff type | Hours / Day / Resident | vs state avg |
|---|---|---|
|
Registered Nurse (RN)
| 45m per day | ▲ 14% State avg: 39m per day · National avg: 41m per day |
|
LPN / LVN
| 32m per day | ▼ 57% State avg: 1h 13m per day · National avg: 52m per day |
|
Nurse Aide
| 2h 47m per day | ▲ 5% State avg: 2h 39m per day · National avg: 2h 21m per day |
|
Weekend Total Nursing
| 3h 44m per day | ▼ 8% State avg: 4h 5m per day · National avg: 3h 26m per day |
|
Physical Therapist
| 3m per day | ▼ 46% State avg: 5m per day · National avg: 4m per day |
|
Weekend RN
| 42m per day | ▲ 39% State avg: 30m per day · National avg: 29m per day |
Key information about the people who lead and staff this community.
In California, the Department of Social Services (for assisted living facilities) and the Department of Public Health (for nursing homes) conduct inspections to ensure resident safety and regulatory compliance.
California average 12.5
Last Health inspection on Oct 2025
California average 50.2
California average 4.65
Health citations are formal notices following inspections when they fail to comply with safety and care standards.
42 of 74 citations resulted from standard inspections; 26 of 74 resulted from complaint investigations; and 6 of 74 came from combined inspections (standard and complaint).
California average: 0.4
California average: 1
Reporting period: October 1 – December 31, 2025 (Q4 2025). Source: CMS Payroll-Based Journal report.
Manages medical care and health needs.
Assists with medical care and medications.
Helps with daily care and mobility.
Total hours from contractors
9,839 contractor hours this quarter
| Certified Nursing Assistant | 62 | 141 | 203 | 28,996 | 92 | 100% | 7.6 |
| Registered Nurse | 19 | 0 | 19 | 7,240 | 92 | 100% | 8 |
| Licensed Practical Nurse | 11 | 0 | 11 | 4,032 | 92 | 100% | 8.5 |
| Other Dietary Services Staff | 6 | 0 | 6 | 2,350 | 92 | 100% | 7.8 |
| RN Director of Nursing | 4 | 0 | 4 | 1,696 | 66 | 72% | 8 |
| Nurse Aide in Training | 4 | 0 | 4 | 1,364 | 91 | 99% | 8 |
| Qualified Activities Professional | 2 | 0 | 2 | 814 | 89 | 97% | 7.9 |
| Qualified Social Worker | 0 | 2 | 2 | 788 | 65 | 71% | 6.7 |
| Speech Language Pathologist | 0 | 5 | 5 | 597 | 73 | 79% | 5.6 |
| Physical Therapy Aide | 0 | 3 | 3 | 566 | 74 | 80% | 7.2 |
| Clinical Nurse Specialist | 1 | 0 | 1 | 496 | 62 | 67% | 8 |
| Mental Health Service Worker | 1 | 0 | 1 | 496 | 62 | 67% | 8 |
| Administrator | 1 | 0 | 1 | 488 | 61 | 66% | 8 |
| Respiratory Therapy Technician | 0 | 4 | 4 | 487 | 47 | 51% | 8.4 |
| Nurse Practitioner | 1 | 0 | 1 | 376 | 47 | 51% | 8 |
| Physical Therapy Assistant | 0 | 4 | 4 | 353 | 60 | 65% | 5.3 |
| Occupational Therapy Aide | 0 | 1 | 1 | 267 | 40 | 43% | 6.7 |
| Medical Director | 0 | 1 | 1 | 60 | 12 | 13% | 5 |
| Occupational Therapy Assistant | 0 | 1 | 1 | 57 | 12 | 13% | 4.7 |
Includes penalties issued in 2024-2025
Federal penalties imposed by CMS for regulatory violations, including civil money penalties (fines) and denials of payment for new Medicare/Medicaid admissions.
Source: CMS Penalties Database (Data as of Jan 2026)
California average: $55K
California average: 2.4
California average: 0.5
Penalties are imposed by CMS for violations of federal nursing home regulations.
2 penalties in the past 3 years
Multiple penalties were reported in the last 3 years.
Last updated: Jan 2026
These measures show how residents usually do over time at this home, based on health outcomes and preventive care.
California average: 6.6
California average: 11.3
California average: 11.1%
California average: 12.0%
California average: 11.3%
California average: 1.7%
California average: 5.0%
California average: 1.2%
California average: 4.2%
California average: 6.7%
California average: 10.1%
California average: 98.5%
California average: 98.2%
California average: 2.25
California average: 1.59
California average: 94.0%
California average: 1.5%
California average: 93.2%
California average: 23.2%
California average: 11.2%
California average: 0.8%
California average: 53.7%
California average: 50.6%
Quality measures are calculated from Minimum Data Set (MDS) assessments. For most measures, lower percentages indicate better care quality.
53% of new residents, usually for short-term rehab.
25% of new residents, often for short stays.
21% of new residents, often for long-term daily care.
Source: CMS Long-Term Care Facility Characteristics (Data as of Jan 2026)
Residents meet regularly to discuss policies, care quality, and activities
Organized group of residents that meets regularly to discuss facility policies, quality of life, and activities.
Data sourced from CMS Long-Term Care Facility Characteristics quarterly report. Payer mix reflects the current resident census by primary payment source.
Historical financial and operational data for The Bridgeview Post Acute from 2011–2023, based on CMS SNF Cost Reports.
Based on CMS SNF Cost Report for fiscal year ending in 12/2023.
Most residents typically stay for a few weeks or months before returning home or moving on.
Most new residents arrive under Medicare (53% of admissions), and a typical Medicare stay runs around 1 months.
Coverage residents most often arrive under.
Coverage residents most often leave under.
![]() 1.2 miles from city center
1.2 miles from city center
![]() Estimated distance in miles from Yuba City's city center to The Bridgeview Post Acute's address, calculated via Google Maps.
Estimated distance in miles from Yuba City's city center to The Bridgeview Post Acute's address, calculated via Google Maps.
Add your location
The information below is reported by the California Department of Social Services and Department of Public Health.
| The Fountains Skilled Nursing Care | NH HC | Yuba City | 80
Facility
80
CA AVG
103
Rank
#916 / 1657 |
70.0%
Facility
70.0%
CA AVG
84.7%
Rank
#956 / 1537 | -17% | 4.20
Facility
4.20
CA AVG
4.22
Rank
#138 / 354 | +10% | 0% | $0
Facility
$0
CA AVG
$56.5k
Rank
#1 / 362 | 89
Facility
89
CA AVG
81
Rank
#461 / 1401 | 28
Facility
28
CA AVG
50.2
Rank
#100 / 361 | 5.6
Facility
5.6
CA AVG
4.6
Rank
#283 / 361 | - | 56 | - |
55
Facility
55
CA AVG
57
Rank
#1215 / 2092 | Stone Point Health | $25.2M
Facility
$25.2M
CA AVG
$17.0M
Rank
#52 / 355 | $14.8M
Facility
$14.8M
CA AVG
$7.0M
Rank
#30 / 355 | 58.5%
Facility
58.5%
CA AVG
45.2%
Rank
#202 / 355 | 555430 | ||||
| Yuba City Post-Acute | NH HC MC PC RC | Yuba City | 59
Facility
59
CA AVG
103
Rank
#1092 / 1657 |
90.4%
Facility
90.4%
CA AVG
84.7%
Rank
#311 / 1537 | +7% | 3.69
Facility
3.69
CA AVG
4.22
Rank
#245 / 354 | -31% | -13% | $0
Facility
$0
CA AVG
$56.5k
Rank
#1 / 362 | - | 48
Facility
48
CA AVG
50.2
Rank
#219 / 361 | 6.0
Facility
6.0
CA AVG
4.6
Rank
#296 / 361 | - | 56 | - |
72
Facility
72
CA AVG
57
Rank
#674 / 2092 | Hudson River Opco LLC | $10.8M
Facility
$10.8M
CA AVG
$17.0M
Rank
#246 / 355 | $4.9M
Facility
$4.9M
CA AVG
$7.0M
Rank
#300 / 355 | 45.2%
Facility
45.2%
CA AVG
45.2%
Rank
#291 / 355 | 55092 | ||||
| The Bridgeview Post Acute | NH | Yuba City | 130
Facility
130
CA AVG
103
Rank
#486 / 1657 |
76.2%
Facility
76.2%
CA AVG
84.7%
Rank
#797 / 1537 | -10% | 4.16
Facility
4.16
CA AVG
4.22
Rank
#138 / 354 | -23% | -1% | $99.3k
Facility
$99.3k
CA AVG
$56.5k
Rank
#348 / 362 | - | 74
Facility
74
CA AVG
50.2
Rank
#302 / 361 | 6.2
Facility
6.2
CA AVG
4.6
Rank
#305 / 361 | 4 | 119 | A+ |
56
Facility
56
CA AVG
57
Rank
#1180 / 2092 | - | $14.0M
Facility
$14.0M
CA AVG
$17.0M
Rank
#229 / 355 | $6.5M
Facility
$6.5M
CA AVG
$7.0M
Rank
#188 / 355 | 46.1%
Facility
46.1%
CA AVG
45.2%
Rank
#68 / 355 | 56346 |
The Bridgeview Post Acute is located in Yuba City, California.
Here are the financial assistance programs available to residents in California.
The Bridgeview Post Acute has a walk score of 56. Moderately walkable. Some errands can be accomplished on foot, with a mix of nearby amenities.
The Bridgeview Post Acute's occupancy is 76.2%.
The Bridgeview Post Acute is registered as a for-profit in CA.
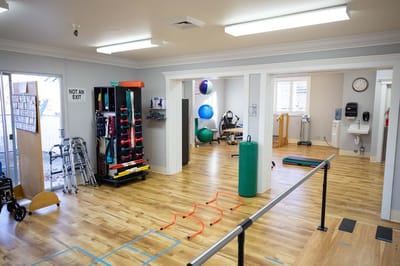
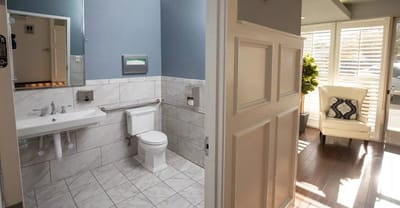
Yes — there are 5 photos of The Bridgeview Post Acute in the photo gallery on this page.
The Bridgeview Post Acute is located at 521 Lorel Way, Yuba City, CA 95991.
(530) 674-9140 will put you in contact with the team at The Bridgeview Post Acute.
Yes — The Bridgeview Post Acute is a CMS-certified provider of Medicare and Medicaid.
Care Cost Calculator: See Prices in Your Area
Nursing Home Data Explorer
Don’t Wait Too Long: 7 Red Flag Signs Your Parent Needs Assisted Living Now
The True Cost of Assisted Living in 2025 – And How Families Are Paying For It
Understanding Senior Living Costs: Pricing Models, Discounts & Financial Assistance


