


Brightview Catonsville
Assisted Living & Memory Care · Catonsville, MD
Brightview Catonsville
Assisted Living & Memory Care · Catonsville, MD
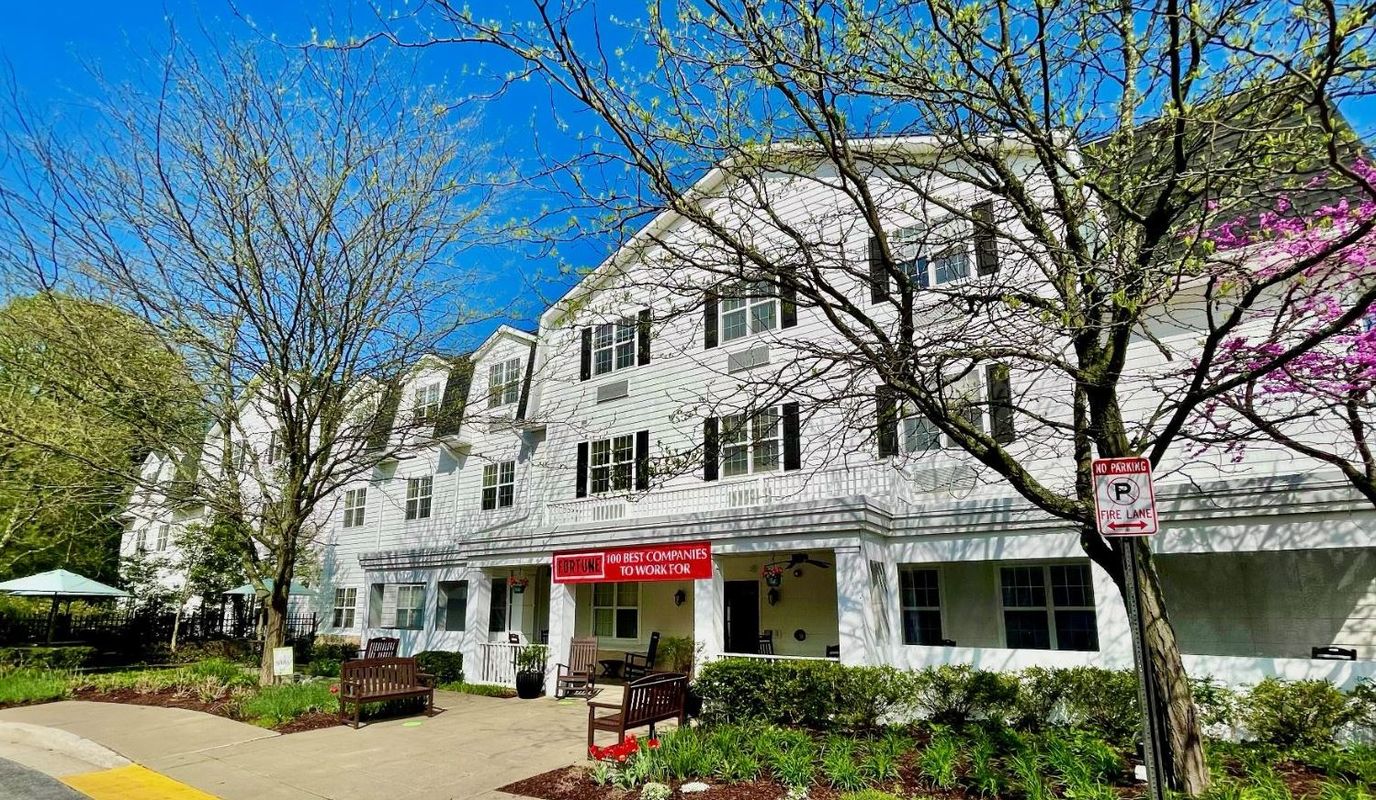
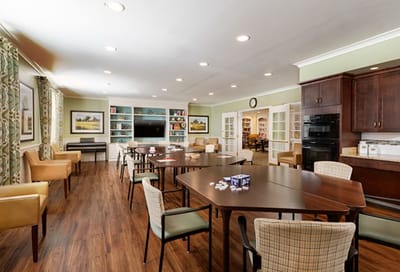
Brightview Catonsville is a vibrant senior living community located in the heart of Catonsville, Maryland. With a focus on independent living, assisted living, and memory care services, this community provides a nurturing and engaging environment for seniors. The modern and well-appointed apartments offer a comfortable and private living space, while the numerous communal areas provide opportunities for socializing and participating in a variety of activities. The dedicated staff at Brightview Catonsville is available 24/7 to provide personalized care and support, ensuring that each resident’s unique needs are met with compassion and professionalism.
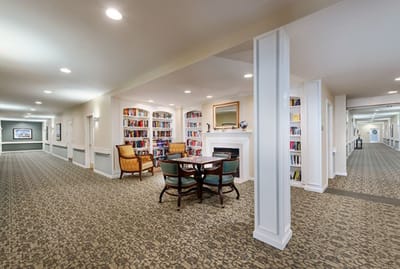
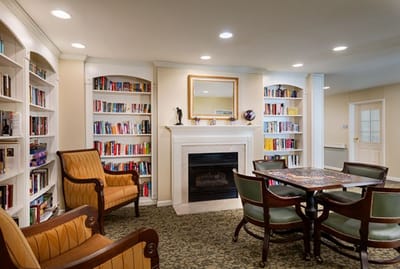
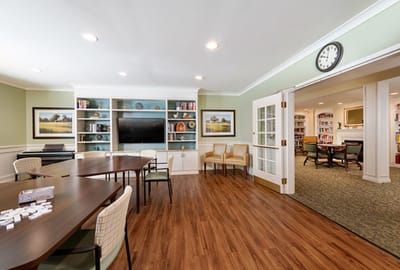
Brightview Catonsville is known for its extensive amenities and enriching programs. Residents can enjoy delicious meals prepared by skilled chefs in the elegant dining room, as well as engage in a wide range of activities, including fitness classes, arts and crafts, educational seminars, and social outings. The community is surrounded by beautifully landscaped grounds, including outdoor patios and walking paths, where residents can relax and enjoy nature. With a commitment to providing a vibrant and fulfilling lifestyle, Brightview Catonsville offers seniors a welcoming community where they can thrive and enjoy their golden years to the fullest.
95-bed community Rank #136 / 685Bed count — State benchmarkedThis home is ranked 136th out of 685 homes in Maryland for bed count. Shows this facility's certified or reported bed count compared to other Maryland facilities. Larger communities may offer more amenities, programs, and on-site services for residents and families.Facilities with the same value for a metric share the same rank. Rankings are based only on facilities in Maryland that report data for that category. Facilities without available data are excluded from the ranking.Click the rank badge to see the full State ranking.Click here to see the full State ranking.
A larger shared setting that may offer more common spaces and organized community services.
24 years in operation Rank #93 / 210Years in operation — State benchmarkedThis home is ranked 93rd out of 210 homes in Maryland for years in operation. Shows how long this facility has been in operation compared to other Maryland facilities. Longer operating histories may benefit residents, families, and staff.Facilities with the same value for a metric share the same rank. Rankings are based only on facilities in Maryland that report data for that category. Facilities without available data are excluded from the ranking.Click the rank badge to see the full State ranking.Click here to see the full State ranking.
A longer operating history, which may indicate experience navigating regulations and delivering ongoing care.
Walk Score: 23 / 100 Rank #704 / 985Walk Score — State benchmarkedThis home is ranked 704th out of 985 homes in Maryland for walk score. Shows how walkable this facility's neighborhood is compared to the average walk score across Maryland facilities. Higher scores benefit residents, families, and staff.Facilities with the same value for a metric share the same rank. Rankings are based only on facilities in Maryland that report data for that category. Facilities without available data are excluded from the ranking.Click the rank badge to see the full State ranking.Click here to see the full State ranking.
Car-dependent. Most errands require a car, with limited nearby walkable options.
About this community
Ranked by FORTUNE Magazine for seven consecutive years (2019 - 2025)
Facility TypeAssisted Living
CountyBaltimore
Apartment
$170 - $310 per day
Hospice Affiliations
Respite Care
Short-Term Rehab
Licensed Nurses/CNAs
Dedicated Alzheimer's Unit
Mild Alzheimer's Level
Moderate Alzheimer's Level
Severe Alzheimer's Level
Restaurant-Style Dining
Individualized Care Service Plans
Branded ProgramsBright Minds Program
Specific ProgramsDaily programs promoting healthy lifestyles, Chef-prepared meals
Demographics
Resident demographic information for this facility.
Gender
- Female 63.2%
- Male 36.8%
Age Distribution
- 85-94 39.7%
- 75-84 33.8%
- 95+ 22.1%
- ≤64 2.9%
- 65-74 1.5%
Ethnicity
- White 94.1%
- African American 2.9%
- Hispanic 2.9%
Infection Prevention & Vaccination
How this facility protects residents through staff vaccination policies and immunization practices.
Mandatory Vaccination Policy
The facility requires certain vaccinations for staff as part of its infection prevention measures.
What does this home offer?
Pets Allowed
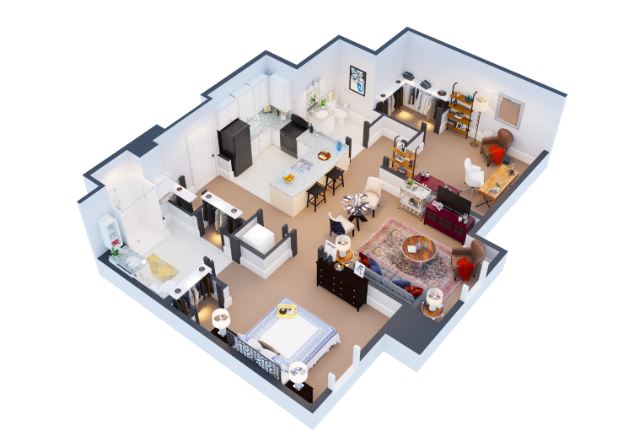
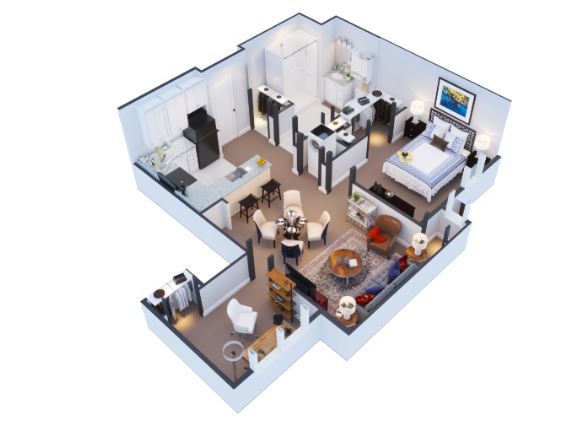
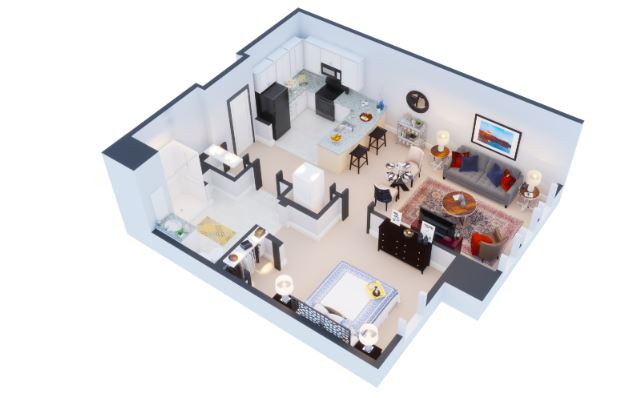
Housing Options: Studio / 1 Bed / 2 Bed
Building Type: 3-story
Transportation Services
Fitness and Recreation
Over 10 years of experience
Katie A. is the Community Executive Director at Brightview Catonsville. She joined Brightview over 10 years ago, starting as a concierge and progressing through several community director roles. Katie now leads the community with extensive experience and a deep commitment to vibrant senior living.
Living Spaces & Floor Plans for Brightview Catonsville
Places of interest near Brightview Catonsville
![]() 1.5 miles from city center
1.5 miles from city center
![]() Estimated distance in miles from Catonsville's city center to Brightview Catonsville's address, calculated via Google Maps.
— 2.99 miles to nearest hospital (Ascension Saint Agnes Hospital)
Estimated distance in miles from Catonsville's city center to Brightview Catonsville's address, calculated via Google Maps.
— 2.99 miles to nearest hospital (Ascension Saint Agnes Hospital)
Calculate Travel Distance to Brightview Catonsville
Add your location
Compare Assisted Living around Baltimore
Info below is compiled from the MD Dept. of Health (OHCQ), senior community websites & trusted data sources such as Walk Score & BBB.
Communities are listed from highest to lowest based on our ranking methodology.
| Pickersgill Retirement Community | AL IL NH SNF | Baltimore (Chestnut Hill) | 138
Facility
138
MD AVG
42
Rank
#55 / 685 | No |
45
Facility
45
MD AVG
43
Rank
#475 / 985 | - | - | A+ |
24% Male Residents — State Benchmarked 24% of residents are male, compared to the Maryland average of 31%. This facility caters to a majority female resident pool (76% female), consistent with the broader assisted living trend where women significantly outnumber men. |
76% Female Residents — State Benchmarked 76% of residents are female, compared to the Maryland average of 69%. Women comprise the large majority, consistent with national assisted living demographics where women live longer and enter care facilities at higher rates. |
95% White Residents — State Benchmarked 95% of residents are reported as White, compared to the Maryland average of 81%. A higher White share than is typical for assisted living in Maryland in this dataset — compare with peer facilities for local context. |
1% African American Residents — State Benchmarked 1% of residents are reported as African American or Black, compared to the Maryland average of 13%. A lower African American share than is typical in Maryland; local markets still vary widely. |
4% Other Ethnicity Residents — State Benchmarked 4% of residents fall into categories other than White or African American (combined), compared to the Maryland average of 6%. This column aggregates Hispanic, Asian, multiracial, and any other labeled groups that are not classified as White or African American. Reported subgroups in this total: Asian (4%). |
3% Residents Age 65–74 — State Benchmarked 3% of residents are 65–74, compared to the Maryland average of 13%. Fewer younger seniors suggests the resident population skews older, likely requiring higher acuity care and more hands-on support. |
27% Residents Age 75–84 — State Benchmarked 27% of residents are 75–84, compared to the Maryland average of 31%. This is the second most common age bracket in assisted living, representing residents with moderate care needs. |
55% Residents Age 85–94 — State Benchmarked 55% of residents are 85–94, compared to the Maryland average of 44%. A high concentration of very elderly residents signals a higher-acuity facility with experience caring for advanced age-related needs. |
15% Residents Age 95+ — State Benchmarked 15% of residents are 95 or older, compared to the Maryland average of 16%. In line with the statewide profile for the oldest resident bracket. |
| Morningside House At Satyr Hill | AL HOS MC RC | Parkville (Woodcroft) | 125
Facility
125
MD AVG
42
Rank
#68 / 685 | Yes |
72
Facility
72
MD AVG
43
Rank
#160 / 985 | Private Rooms / Semi-Private Rooms | 28
Facility
28
MD AVG
21
Rank
#53 / 210 | A+ |
34% Male Residents — State Benchmarked 34% of residents are male, compared to the Maryland average of 31%. This facility caters to a majority female resident pool (66% female), consistent with the broader assisted living trend where women significantly outnumber men. |
66% Female Residents — State Benchmarked 66% of residents are female, compared to the Maryland average of 69%. Women comprise the large majority, consistent with national assisted living demographics where women live longer and enter care facilities at higher rates. |
98% White Residents — State Benchmarked 98% of residents are reported as White, compared to the Maryland average of 81%. A higher White share than is typical for assisted living in Maryland in this dataset — compare with peer facilities for local context. |
2% African American Residents — State Benchmarked 2% of residents are reported as African American or Black, compared to the Maryland average of 13%. A lower African American share than is typical in Maryland; local markets still vary widely. |
0% Other Ethnicity Residents — State Benchmarked 0% of residents fall into categories other than White or African American (combined), compared to the Maryland average of 6%. This column aggregates Hispanic, Asian, multiracial, and any other labeled groups that are not classified as White or African American. |
13% Residents Age 65–74 — State Benchmarked 13% of residents are 65–74, compared to the Maryland average of 13%. In line with the statewide profile for this youngest senior bracket in assisted living. |
40% Residents Age 75–84 — State Benchmarked 40% of residents are 75–84, compared to the Maryland average of 31%. A high concentration in this mid-range bracket, where residents typically need moderate support with daily activities. |
29% Residents Age 85–94 — State Benchmarked 29% of residents are 85–94, compared to the Maryland average of 44%. The population here skews younger than the statewide norm, which may indicate a more active, lower-acuity community. |
16% Residents Age 95+ — State Benchmarked 16% of residents are 95 or older, compared to the Maryland average of 16%. In line with the statewide profile for the oldest resident bracket. |
| Morningside House of Friendship | AL HOS MC RC | Hanover | 103
Facility
103
MD AVG
42
Rank
#103 / 685 | Yes |
36
Facility
36
MD AVG
43
Rank
#563 / 985 | Studio / 1 Bed / 2 Bed | 33
Facility
33
MD AVG
21
Rank
#25 / 210 | - |
23% Male Residents — State Benchmarked 23% of residents are male, compared to the Maryland average of 31%. This facility caters to a majority female resident pool (77% female), consistent with the broader assisted living trend where women significantly outnumber men. |
77% Female Residents — State Benchmarked 77% of residents are female, compared to the Maryland average of 69%. Women comprise the large majority, consistent with national assisted living demographics where women live longer and enter care facilities at higher rates. |
86% White Residents — State Benchmarked 86% of residents are reported as White, compared to the Maryland average of 81%. Close to the average for this category among assisted living facilities in Maryland with reported race/ethnicity data. |
13% African American Residents — State Benchmarked 13% of residents are reported as African American or Black, compared to the Maryland average of 13%. In line with the Maryland average for African American residents among facilities reporting this breakdown. |
1% Other Ethnicity Residents — State Benchmarked 1% of residents fall into categories other than White or African American (combined), compared to the Maryland average of 6%. This column aggregates Hispanic, Asian, multiracial, and any other labeled groups that are not classified as White or African American. Reported subgroups in this total: Asian (1%). |
8% Residents Age 65–74 — State Benchmarked 8% of residents are 65–74, compared to the Maryland average of 13%. Fewer younger seniors suggests the resident population skews older, likely requiring higher acuity care and more hands-on support. |
35% Residents Age 75–84 — State Benchmarked 35% of residents are 75–84, compared to the Maryland average of 31%. This is the second most common age bracket in assisted living, representing residents with moderate care needs. |
41% Residents Age 85–94 — State Benchmarked 41% of residents are 85–94, compared to the Maryland average of 44%. This is typically the most common age bracket in assisted living — this facility is in line with the statewide norm. |
16% Residents Age 95+ — State Benchmarked 16% of residents are 95 or older, compared to the Maryland average of 16%. In line with the statewide profile for the oldest resident bracket. |
| Brightview Catonsville | AL MC | Catonsville (South Rolling Road) | 95
Facility
95
MD AVG
42
Rank
#136 / 685 | Yes |
23
Facility
23
MD AVG
43
Rank
#704 / 985 | Studio / 1 Bed / 2 Bed | 24
Facility
24
MD AVG
21
Rank
#93 / 210 | - |
37% Male Residents — State Benchmarked 37% of residents are male, compared to the Maryland average of 31%. This facility caters to a majority female resident pool (63% female), consistent with the broader assisted living trend where women significantly outnumber men. |
63% Female Residents — State Benchmarked 63% of residents are female, compared to the Maryland average of 69%. Closer to an even gender split than most assisted living facilities, which typically have 65–75% female residents. |
94% White Residents — State Benchmarked 94% of residents are reported as White, compared to the Maryland average of 81%. A higher White share than is typical for assisted living in Maryland in this dataset — compare with peer facilities for local context. |
3% African American Residents — State Benchmarked 3% of residents are reported as African American or Black, compared to the Maryland average of 13%. A lower African American share than is typical in Maryland; local markets still vary widely. |
3% Other Ethnicity Residents — State Benchmarked 3% of residents fall into categories other than White or African American (combined), compared to the Maryland average of 6%. This column aggregates Hispanic, Asian, multiracial, and any other labeled groups that are not classified as White or African American. Reported subgroups in this total: Hispanic (3%). |
1% Residents Age 65–74 — State Benchmarked 1% of residents are 65–74, compared to the Maryland average of 13%. Fewer younger seniors suggests the resident population skews older, likely requiring higher acuity care and more hands-on support. |
34% Residents Age 75–84 — State Benchmarked 34% of residents are 75–84, compared to the Maryland average of 31%. This is the second most common age bracket in assisted living, representing residents with moderate care needs. |
40% Residents Age 85–94 — State Benchmarked 40% of residents are 85–94, compared to the Maryland average of 44%. This is typically the most common age bracket in assisted living — this facility is in line with the statewide norm. |
22% Residents Age 95+ — State Benchmarked 22% of residents are 95 or older, compared to the Maryland average of 16%. A high proportion of the oldest-old suggests strong end-of-life care experience and very-high-acuity capabilities. |
| Brightview Mays Chapel Ridge | AL IL MC | Timonium (Dixon Hill) | 89
Facility
89
MD AVG
42
Rank
#150 / 685 | Yes |
52
Facility
52
MD AVG
43
Rank
#402 / 985 | Studio / 1 Bed / 2 Bed | 50
Facility
50
MD AVG
21
Rank
#1 / 210 | A+ |
13% Male Residents — State Benchmarked 13% of residents are male, compared to the Maryland average of 31%. This facility caters to a majority female resident pool (87% female), consistent with the broader assisted living trend where women significantly outnumber men. |
87% Female Residents — State Benchmarked 87% of residents are female, compared to the Maryland average of 69%. Women comprise the large majority, consistent with national assisted living demographics where women live longer and enter care facilities at higher rates. |
99% White Residents — State Benchmarked 99% of residents are reported as White, compared to the Maryland average of 81%. A higher White share than is typical for assisted living in Maryland in this dataset — compare with peer facilities for local context. |
0% African American Residents — State Benchmarked 0% of residents are reported as African American or Black, compared to the Maryland average of 13%. A lower African American share than is typical in Maryland; local markets still vary widely. |
1% Other Ethnicity Residents — State Benchmarked 1% of residents fall into categories other than White or African American (combined), compared to the Maryland average of 6%. This column aggregates Hispanic, Asian, multiracial, and any other labeled groups that are not classified as White or African American. Reported subgroups in this total: Asian (1%). |
3% Residents Age 65–74 — State Benchmarked 3% of residents are 65–74, compared to the Maryland average of 13%. Fewer younger seniors suggests the resident population skews older, likely requiring higher acuity care and more hands-on support. |
30% Residents Age 75–84 — State Benchmarked 30% of residents are 75–84, compared to the Maryland average of 31%. This is the second most common age bracket in assisted living, representing residents with moderate care needs. |
48% Residents Age 85–94 — State Benchmarked 48% of residents are 85–94, compared to the Maryland average of 44%. This is typically the most common age bracket in assisted living — this facility is in line with the statewide norm. |
18% Residents Age 95+ — State Benchmarked 18% of residents are 95 or older, compared to the Maryland average of 16%. In line with the statewide profile for the oldest resident bracket. |
Financial Assistance for
Assisted Living in Maryland
Brightview Catonsville is located in Catonsville, Maryland.
Here are the financial assistance programs available to residents in Maryland.
Frequently Asked Questions about Brightview Catonsville
What neighborhood is Brightview Catonsville in?
Brightview Catonsville is in the South Rolling Road neighborhood of Catonsville.
Is Brightview Catonsville in a walkable area?
Brightview Catonsville has a walk score of 23. Car-dependent. Most errands require a car, with limited nearby walkable options.
How long has Brightview Catonsville been in business?
Brightview Catonsville has been operating for approximately 24 years, based on available licensing and registration records.
Are pets allowed at Brightview Catonsville?
Yes, Brightview Catonsville allows residents to bring their pets.
How many beds does Brightview Catonsville have?
Brightview Catonsville has 95 beds.
Are there photos of Brightview Catonsville?
Yes — there are 5 photos of Brightview Catonsville in the photo gallery on this page.
What is the address of Brightview Catonsville?
Brightview Catonsville is located at 912 S Rolling Rd, Catonsville, MD 21228.
Guides for Better Senior Living
Care Cost Calculator: See Prices in Your Area
Assisted Living Explorer
Don’t Wait Too Long: 7 Red Flag Signs Your Parent Needs Assisted Living Now
The True Cost of Assisted Living in 2025 – And How Families Are Paying For It
Understanding Senior Living Costs: Pricing Models, Discounts & Financial Assistance
Updated on
