


Brookeville House
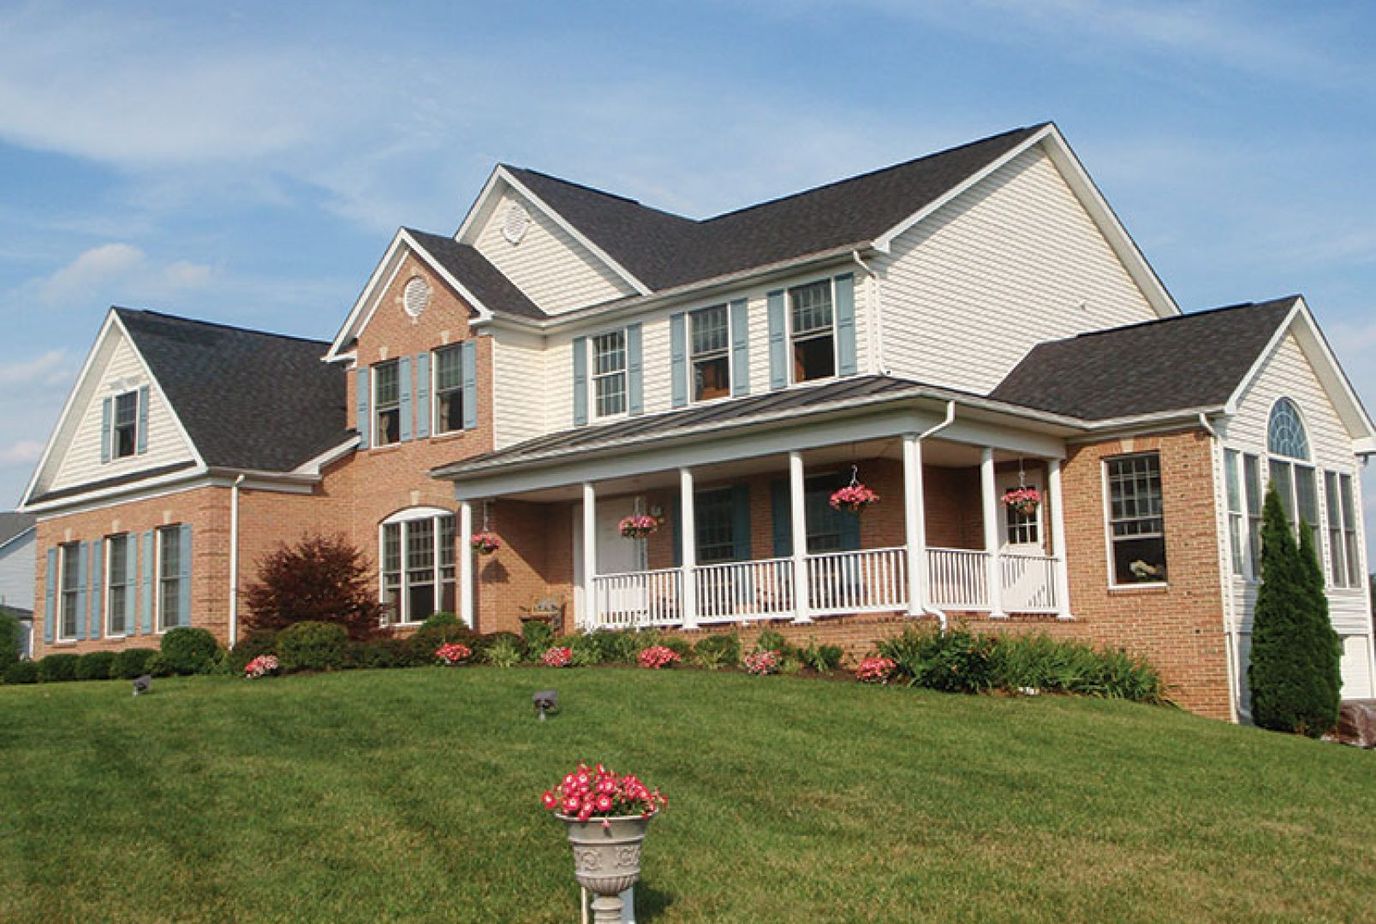
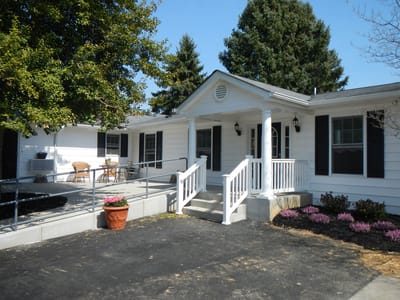
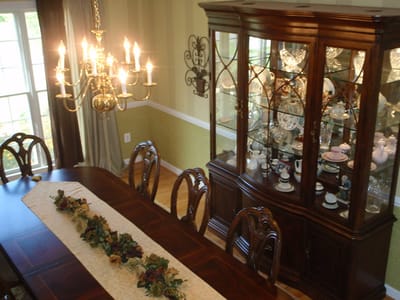
Brookeville Boutique House is a close-knit assisted living community with memory care support that has had a tremendous impact on the lives of its residents. It is proud to be a home that has continued to deliver excellent services nurtured by compassion and kindness; many of its residents have praised the personal touch approach akin to a family-like treatment. With three communities branching out in Brookeville, seniors will discover a home built with flexibility, comfortability, and affordability in mind.
The lifestyle at any Brookeville House is simple: residents receive assistance with their day-to-day activities while continuing to live independently and purposefully. The boutique-style home’s featured accommodations include semi-private rooms, private rooms with private baths, specialized memory care training, respite stays, and long-term care.
Community insights.
Places of interest near Brookeville House
2.7 miles from city center
Estimated distance in miles from Brookeville's city center to Brookeville House's address, calculated via Google Maps.
— 11.63 miles to nearest hospital (Adventist HealthCare Shady Grove Medical Center)
Calculate Travel Distance to Brookeville House
Add your location
Compare Assisted Living around Gaithersburg
Info below is compiled from the MD Dept. of Health (OHCQ), senior community websites & trusted data sources such as Walk Score & BBB.
Communities are listed from highest to lowest based on our ranking methodology.
Care Types in This Table
AL (Assisted Living):
Housing with help for daily activities like bathing, dressing, and medication, without 24-hour skilled nursing.
MC (Memory Care):
Secured, specialized care for people living with Alzheimer's or dementia.
RC (Respite Care):
Short-term temporary care that gives family caregivers a break.
IL (Independent Living):
Community living with dining, activities, and transportation for active seniors who need little personal care.
HOS (Hospice Care):
Comfort-focused care for those with a terminal illness, prioritizing quality of life over treatment.
|
City and state of the facility. Used for mapping and state-average comparisons.
|
Licensed bed capacity (maximum allowed). Not the same as how many beds are currently filled.
|
Indicates whether residents are allowed to have pets in the facility.
|
Third-party neighborhood walkability score (0–100). Convenience/context metric, not a healthcare quality measure.
|
Description of bed or unit types offered (e.g. assisted living, memory care), as reported in state or facility disclosures.
|
Number of years the company has been in operation.
|
Better Business Bureau grade for the operating company. Reflects complaint handling and business practices, not clinical care quality.
|
Percentage of residents reported as male in state demographics, shown as a whole-number percent.
|
Percentage of residents reported as female in state demographics, shown as a whole-number percent.
|
Share of residents reported as White in the state-published race/ethnicity breakdown for this facility, shown as a whole-number percent. Parsed from the same source as the profile demographics section.
|
Share of residents reported as African American or Black in the state breakdown, shown as a whole-number percent. Labels in the raw data are normalized to this bucket for compare.
|
Combined share of all race/ethnicity groups that are not classified as White or African American (e.g. Hispanic, Asian, multiracial, and other labeled categories), summed to a single whole-number percent.
|
Share of residents aged 65–74 in reported demographics, as a whole-number percentage of residents.
|
Share of residents aged 75–84 in reported demographics, as a whole-number percentage of residents.
|
Share of residents aged 85–94 in reported demographics, as a whole-number percentage of residents.
|
Share of residents aged 95 or older in reported demographics, as a whole-number percentage of residents.
| |
|---|---|---|---|---|---|---|---|---|---|---|---|---|---|---|---|---|---|
| Sunrise of Montgomery Village | AL HOS IL MC | Montgomery Village | 100
Facility
100
MD AVG
42
Rank
#108 / 684 | Yes |
56
Facility
56
MD AVG
45
Rank
#355 / 953 | Studio / 1 Bed / 2 Bed / Suite | 33
Facility
33
MD AVG
21
Rank
#25 / 210 | - |
28% Male Residents — State Benchmarked 28% of residents are male, compared to the Maryland average of 31%. This facility caters to a majority female resident pool (72% female), consistent with the broader assisted living trend where women significantly outnumber men. |
72% Female Residents — State Benchmarked 72% of residents are female, compared to the Maryland average of 69%. Women comprise the large majority, consistent with national assisted living demographics where women live longer and enter care facilities at higher rates. |
80% White Residents — State Benchmarked 80% of residents are reported as White, compared to the Maryland average of 81%. Close to the average for this category among assisted living facilities in Maryland with reported race/ethnicity data. |
13% African American Residents — State Benchmarked 13% of residents are reported as African American or Black, compared to the Maryland average of 13%. In line with the Maryland average for African American residents among facilities reporting this breakdown. |
7% Other Ethnicity Residents — State Benchmarked 7% of residents fall into categories other than White or African American (combined), compared to the Maryland average of 6%. This column aggregates Hispanic, Asian, multiracial, and any other labeled groups that are not classified as White or African American. Reported subgroups in this total: Asian (3%), Other (3%), Hawaiian/Pacific Islander (1%). |
7% Residents Age 65–74 — State Benchmarked 7% of residents are 65–74, compared to the Maryland average of 13%. Fewer younger seniors suggests the resident population skews older, likely requiring higher acuity care and more hands-on support. |
32% Residents Age 75–84 — State Benchmarked 32% of residents are 75–84, compared to the Maryland average of 31%. This is the second most common age bracket in assisted living, representing residents with moderate care needs. |
41% Residents Age 85–94 — State Benchmarked 41% of residents are 85–94, compared to the Maryland average of 44%. This is typically the most common age bracket in assisted living — this facility is in line with the statewide norm. |
19% Residents Age 95+ — State Benchmarked 19% of residents are 95 or older, compared to the Maryland average of 16%. In line with the statewide profile for the oldest resident bracket. |
| Nightingale House | AL HOS MC RC | Gaithersburg (Bondbrook) | 8
Facility
8
MD AVG
42
Rank
#300 / 684 | No |
9
Facility
9
MD AVG
45
Rank
#853 / 953 | Private Rooms / Semi-Private Rooms | - | - | - | - | - | - | - | - | - | - | - |
| Fatima‘s Assisted Living | AL MC RC | Gaithersburg | 7
Facility
7
MD AVG
42
Rank
#379 / 684 | No |
48
Facility
48
MD AVG
45
Rank
#447 / 953 | Private Rooms / Semi-Private Rooms | - | - | - | - | - | - | - | - | - | - | - |
| Brookeville House | AL HOS MC RC | Brookeville | - | No |
2
Facility
2
MD AVG
45
Rank
#940 / 953 | - | 17
Facility
17
MD AVG
21
Rank
#121 / 210 | A+ | - | - | - | - | - | - | - | - | - |
| Kindley Assisted Living | AL | Gaithersburg | - | Yes |
66
Facility
66
MD AVG
45
Rank
#240 / 953 | Studio / 1 Bed / 2 Bed | - | - | - | - | - | - | - | - | - | - | - |
Financial Assistance for
Assisted Living in Maryland
Brookeville House is located in Brookeville, Maryland.
Here are the financial assistance programs available to residents in Maryland.
Frequently Asked Questions about Brookeville House
Is Brookeville House in a walkable area?
Brookeville House has a walk score of 2. Car-dependent. Most errands require a car, with limited nearby walkable options.
How long has Brookeville House been in business?
Brookeville House has been operating for approximately 17 years, based on available licensing and registration records.
Are pets allowed at Brookeville House?
No, Brookeville House has a no-pet policy.
Are there photos of Brookeville House?
Yes — there are 9 photos of Brookeville House in the photo gallery on this page.
What is the address of Brookeville House?
Brookeville House is located at 2505 Brown Farm Ct, Brookeville, MD 20833.
What is the phone number of Brookeville House?
(301) 363-9688 will put you in contact with the team at Brookeville House.
Guides for Better Senior Living
Care Cost Calculator: See Prices in Your Area
Assisted Living Explorer
Don’t Wait Too Long: 7 Red Flag Signs Your Parent Needs Assisted Living Now
The True Cost of Assisted Living in 2025 – And How Families Are Paying For It
Understanding Senior Living Costs: Pricing Models, Discounts & Financial Assistance




