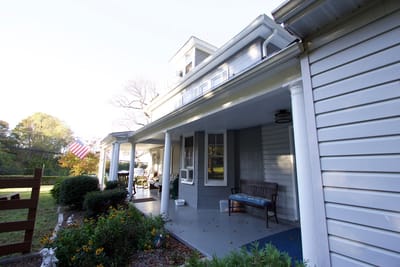
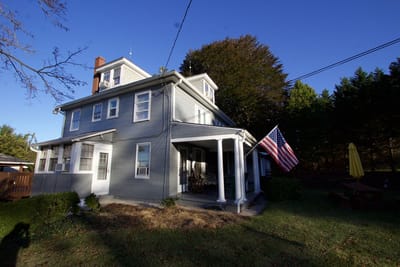
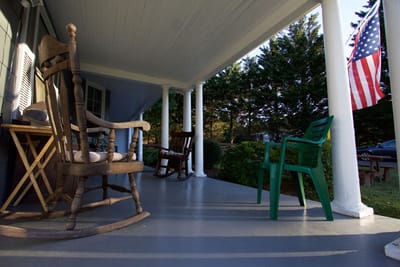
Dulaney Valley Assisted Living at Baldwin
Assisted Living & Respite Care · Baldwin, MD

Dulaney Valley Assisted Living at Baldwin

Assisted Living & Respite Care · Baldwin, MD
Dulaney Valley Assisted Living at Baldwin accepts Medicaid.

Overview of Dulaney Valley Assisted Living at Baldwin

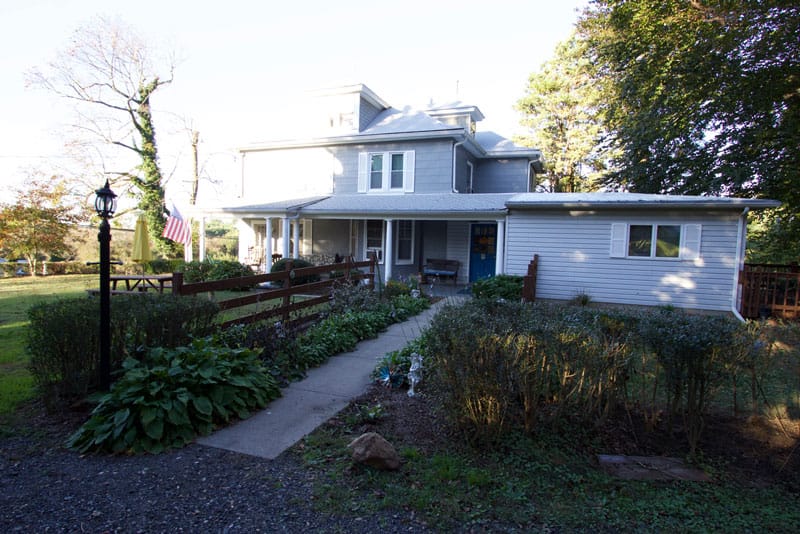
Dulaney Valley Assisted Living at Baldwin offers assisted living and respite care in Baldwin, MD, in the Hurline Farms neighborhood. The community has 10 beds, making it a smaller place that might be right for a resident who likes a close-knit environment where people become familiar with each other. Assisted living includes help with daily tasks and medication management while a resident lives in a private or semi-private room.

Respite care is available for short-term stays when a usual caregiver needs time to travel, recover or manage another responsibility. That makes the community a possible fit for families seeking temporary support. Private rooms start at $100 per day, and semi-private rooms start at $73 per day. Medicaid is accepted, giving eligible residents a payment option when personal savings may not cover the full cost of care.

Residents have access to 2.5 acres of outdoor land. An exercise program and planned recreational activities are based on resident interests, giving people structured ways to stay active and spend time in activities they enjoy. Rehabilitation services are available, while a registered nurse evaluates and manages care, providing clinical oversight within each resident’s care plan.

By The Numbers

Community insights.

Bed count Info A smaller, more intimate setting that may offer a quieter environment and closer staff-resident interactions. 10 Rank #195 / 576Bed count — State benchmarked This assisted living community is ranked 195th out of 576 assisted living communities we track in Maryland for bed count. Shows this facility's certified or reported bed count compared to other Maryland facilities. Larger communities may offer more amenities, programs, and on-site services for residents and families. Communities with the same value for a metric share the same rank. Rankings compare like with like: every assisted living community we track in Maryland that reports data for that category. Assisted living communities without available data are excluded, so the pool size varies from metric to metric.

Smaller home · May offer a more intimate, personalized care environment.

Years of operating Info A longer operating history, which may indicate experience navigating regulations and delivering ongoing care. This is the number of years in operation under current management. Rank #21 / 181Years in operation — State benchmarked This assisted living community is ranked 21st out of 181 assisted living communities we track in Maryland for years in operation. Shows how long this facility has been in operation compared to other Maryland facilities. Longer operating histories may benefit residents, families, and staff. Communities with the same value for a metric share the same rank. Rankings compare like with like: every assisted living community we track in Maryland that reports data for that category. Assisted living communities without available data are excluded, so the pool size varies from metric to metric.
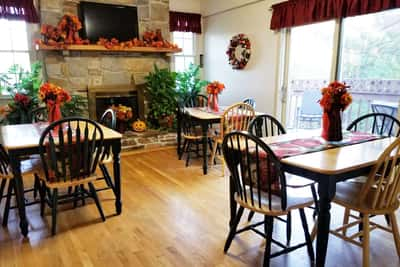
33 years

About This Community

Pricing & Financial Information

The below pricing was updated on

Private Room
$100 - $100/Day

License Details

Facility TypeAssisted Living
CountyBaltimore

Staff Vaccination

Requires staff flu vaccinationThe community reported a mandatory flu vaccination policy for staff to the Maryland Health Care Commission. A policy is separate from the Gold Star, which is earned by the vaccination rate itself.
Requires staff COVID-19 vaccinationThe community reported a policy requiring COVID-19 vaccination for staff to the Maryland Health Care Commission.

Therapy & Rehabilitation

1 service
Physical Therapy

Staffing & Medical

2 services
Licensed Nurses/CNAs

Hospice partners Hospice providers this community works with, as listed in the Maryland Health Care Commission's consumer guide. Hospice brings end-of-life and comfort care to residents where they live.

  • AccentCare Hospice and Palliative Care of Maryland

Memory & Specialized Care

2 services
Mild Alzheimer's LevelAccepts residents with mild (early-stage) Alzheimer's or dementia, who are mostly independent but need reminders and some supervision. Maryland's Health Care Commission asks each assisted living community which stages of Alzheimer's or dementia it accepts and publishes the answer; other states do not report this.
Moderate Alzheimer's LevelAccepts residents with moderate (middle-stage) Alzheimer's or dementia, who need regular help with daily activities and closer supervision. Maryland's Health Care Commission asks each assisted living community which stages of Alzheimer's or dementia it accepts and publishes the answer; other states do not report this.

Additional Services

7 services
Respite CareRespite care provides families and unpaid caregivers with short-term relief from caregiving duties. Care can range from a few hours to a few weeks.
3 Nutritious Meals per Day Plus Snacks
Daily Living Assistance
3 Nutritious Meals per Day
Caregiver Services
Laundry & Linen
Housekeeping

Additional Policies & Features

Pets not allowed

Amenities & Lifestyle

Parking
2.5 Acres of Land

Room Accommodations

Building TypeTwo-story
Room Types
Private Room Semi-Private / Shared Room
In-Room Features
Private And Semi-Private Rooms

Contact Dulaney Valley Assisted Living at Baldwin

Demographics Source: Maryland Health Care Commission consumer guide, as reported by the facility. Maryland is the only state that publishes resident demographics for each community. Data retrieved May 2026.

Resident demographic information for this facility.

Gender

  • Female 100%

Age Distribution

  • 65-74 50%
  • 75-84 30%
  • 85-94 20%

Ethnicity

  • White 100%

Places of interest near Dulaney Valley Assisted Living at Baldwin

Address 2.0 miles from city center Info Estimated distance in miles from Baldwin's city center to Dulaney Valley Assisted Living at Baldwin's address, calculated via Google Maps.

Calculate Travel Distance to Dulaney Valley Assisted Living at Baldwin

Add your location

Address

Compare Assisted Living around the area

Info below is compiled from the MD Dept. of Health (OHCQ), senior community websites & trusted data sources such as Walk Score & BBB.

Communities are listed from highest-ranked to lowest-ranked based on our methodology.

Care Types in This Table AL (Assisted Living): Housing with help for daily activities like bathing, dressing, and medication, without 24-hour skilled nursing. MC (Memory Care): Secured, specialized care for people living with Alzheimer's or dementia. RC (Respite Care): Short-term temporary care that gives family caregivers a break. HOS (Hospice Care): Comfort-focused care for those with a terminal illness, prioritizing quality of life over treatment.
City and state of the facility. Used for mapping and state-average comparisons.
Licensed bed capacity (maximum allowed). Not the same as how many beds are currently filled.
Indicates whether residents are allowed to have pets in the facility.
Third-party neighborhood walkability score (0–100). Convenience/context metric, not a healthcare quality measure.
Description of bed or unit types offered (e.g. assisted living, memory care), as reported in state or facility disclosures.
Number of years the company has been in operation.
Better Business Bureau grade for the operating company. Reflects complaint handling and business practices, not clinical care quality.
Percentage of residents reported as male in state demographics, shown as a whole-number percent.
Percentage of residents reported as female in state demographics, shown as a whole-number percent.
Share of residents reported as White in the state-published race/ethnicity breakdown for this facility, shown as a whole-number percent. Parsed from the same source as the profile demographics section.
Share of residents reported as African American or Black in the state breakdown, shown as a whole-number percent. Labels in the raw data are normalized to this bucket for compare.
Combined share of all race/ethnicity groups that are not classified as White or African American (e.g. Hispanic, Asian, multiracial, and other labeled categories), summed to a single whole-number percent.
Share of residents aged 65–74 in reported demographics, as a whole-number percentage of residents.
Share of residents aged 75–84 in reported demographics, as a whole-number percentage of residents.
Share of residents aged 85–94 in reported demographics, as a whole-number percentage of residents.
Share of residents aged 95 or older in reported demographics, as a whole-number percentage of residents.
Sunrise of Rockville
AL
HOS
MC
Rockville
89
Facility 89
MD AVG 28
Rank #76 / 576
Yes
89
Facility 89
MD AVG 43
Rank #15 / 740
Studio / 1 Bed / 2 Bed
45
Facility 45
MD AVG 21
Rank #3 / 181
A-
23%

Male Residents — State Benchmarked 23% of residents are male, compared to the Maryland average of 31%. This facility caters to a majority female resident pool (77% female), consistent with the broader assisted living trend where women significantly outnumber men.

77%

Female Residents — State Benchmarked 77% of residents are female, compared to the Maryland average of 69%. Women comprise the large majority, consistent with national assisted living demographics where women live longer and enter care facilities at higher rates.

87%

White Residents — State Benchmarked 87% of residents are reported as White, compared to the Maryland average of 81%. Close to the average for this category among assisted living facilities in Maryland with reported race/ethnicity data.

2%

African American Residents — State Benchmarked 2% of residents are reported as African American or Black, compared to the Maryland average of 13%. A lower African American share than is typical in Maryland; local markets still vary widely.

11%

Other Ethnicity Residents — State Benchmarked 11% of residents fall into categories other than White or African American (combined), compared to the Maryland average of 6%. This column aggregates Hispanic, Asian, multiracial, and any other labeled groups that are not classified as White or African American. Reported subgroups in this total: Mixed Race (6%), Hispanic (3%), Asian (2%).

3%

Residents Age 65–74 — State Benchmarked 3% of residents are 65–74, compared to the Maryland average of 13%. Fewer younger seniors suggests the resident population skews older, likely requiring higher acuity care and more hands-on support.

31%

Residents Age 75–84 — State Benchmarked 31% of residents are 75–84, compared to the Maryland average of 31%. This is the second most common age bracket in assisted living, representing residents with moderate care needs.

56%

Residents Age 85–94 — State Benchmarked 56% of residents are 85–94, compared to the Maryland average of 44%. A high concentration of very elderly residents signals a higher-acuity facility with experience caring for advanced age-related needs.

10%

Residents Age 95+ — State Benchmarked 10% of residents are 95 or older, compared to the Maryland average of 16%. Most residents here have not yet reached the oldest-old bracket, suggesting a younger overall community.

Sunrise of Frederick
AL
MC
Frederick
88
Facility 88
MD AVG 28
Rank #78 / 576
Yes
62
Facility 62
MD AVG 43
Rank #208 / 740
Studio / Suite / 2 Bed
45
Facility 45
MD AVG 21
Rank #3 / 181
A-
31%

Male Residents — State Benchmarked 31% of residents are male, compared to the Maryland average of 31%. This facility caters to a majority female resident pool (69% female), consistent with the broader assisted living trend where women significantly outnumber men.

69%

Female Residents — State Benchmarked 69% of residents are female, compared to the Maryland average of 69%. Women comprise the large majority, consistent with national assisted living demographics where women live longer and enter care facilities at higher rates.

97%

White Residents — State Benchmarked 97% of residents are reported as White, compared to the Maryland average of 81%. A higher White share than is typical for assisted living in Maryland in this dataset — compare with peer facilities for local context.

2%

African American Residents — State Benchmarked 2% of residents are reported as African American or Black, compared to the Maryland average of 13%. A lower African American share than is typical in Maryland; local markets still vary widely.

2%

Other Ethnicity Residents — State Benchmarked 2% of residents fall into categories other than White or African American (combined), compared to the Maryland average of 6%. This column aggregates Hispanic, Asian, multiracial, and any other labeled groups that are not classified as White or African American. Reported subgroups in this total: Hispanic (2%).

10%

Residents Age 65–74 — State Benchmarked 10% of residents are 65–74, compared to the Maryland average of 13%. Fewer younger seniors suggests the resident population skews older, likely requiring higher acuity care and more hands-on support.

34%

Residents Age 75–84 — State Benchmarked 34% of residents are 75–84, compared to the Maryland average of 31%. This is the second most common age bracket in assisted living, representing residents with moderate care needs.

48%

Residents Age 85–94 — State Benchmarked 48% of residents are 85–94, compared to the Maryland average of 44%. This is typically the most common age bracket in assisted living — this facility is in line with the statewide norm.

6%

Residents Age 95+ — State Benchmarked 6% of residents are 95 or older, compared to the Maryland average of 16%. Most residents here have not yet reached the oldest-old bracket, suggesting a younger overall community.

Sunrise of Columbia
AL
HOS
MC
RC
Columbia (Hickory Ridge)
96
Facility 96
MD AVG 28
Rank #59 / 576
Yes
53
Facility 53
MD AVG 43
Rank #273 / 740
Studio / 1 Bed / 2 Bed
45
Facility 45
MD AVG 21
Rank #3 / 181
A-
31%

Male Residents — State Benchmarked 31% of residents are male, compared to the Maryland average of 31%. This facility caters to a majority female resident pool (69% female), consistent with the broader assisted living trend where women significantly outnumber men.

69%

Female Residents — State Benchmarked 69% of residents are female, compared to the Maryland average of 69%. Women comprise the large majority, consistent with national assisted living demographics where women live longer and enter care facilities at higher rates.

88%

White Residents — State Benchmarked 88% of residents are reported as White, compared to the Maryland average of 81%. Close to the average for this category among assisted living facilities in Maryland with reported race/ethnicity data.

5%

African American Residents — State Benchmarked 5% of residents are reported as African American or Black, compared to the Maryland average of 13%. In line with the Maryland average for African American residents among facilities reporting this breakdown.

6%

Other Ethnicity Residents — State Benchmarked 6% of residents fall into categories other than White or African American (combined), compared to the Maryland average of 6%. This column aggregates Hispanic, Asian, multiracial, and any other labeled groups that are not classified as White or African American. Reported subgroups in this total: Asian (4%), American Indian (1%), Hispanic (1%).

6%

Residents Age 65–74 — State Benchmarked 6% of residents are 65–74, compared to the Maryland average of 13%. Fewer younger seniors suggests the resident population skews older, likely requiring higher acuity care and more hands-on support.

38%

Residents Age 75–84 — State Benchmarked 38% of residents are 75–84, compared to the Maryland average of 31%. A high concentration in this mid-range bracket, where residents typically need moderate support with daily activities.

36%

Residents Age 85–94 — State Benchmarked 36% of residents are 85–94, compared to the Maryland average of 44%. The population here skews younger than the statewide norm, which may indicate a more active, lower-acuity community.

19%

Residents Age 95+ — State Benchmarked 19% of residents are 95 or older, compared to the Maryland average of 16%. In line with the statewide profile for the oldest resident bracket.

Brookdale Potomac
AL
MC
Potomac
139
Facility 139
MD AVG 28
Rank #17 / 576
Yes
64
Facility 64
MD AVG 43
Rank #191 / 740
Studio / 1 Bed / 2 Bed
27
Facility 27
MD AVG 21
Rank #58 / 181
A+
38%

Male Residents — State Benchmarked 38% of residents are male, compared to the Maryland average of 31%. This facility caters to a majority female resident pool (62% female), consistent with the broader assisted living trend where women significantly outnumber men.

62%

Female Residents — State Benchmarked 62% of residents are female, compared to the Maryland average of 69%. Closer to an even gender split than most assisted living facilities, which typically have 65–75% female residents.

94%

White Residents — State Benchmarked 94% of residents are reported as White, compared to the Maryland average of 81%. A higher White share than is typical for assisted living in Maryland in this dataset — compare with peer facilities for local context.

3%

African American Residents — State Benchmarked 3% of residents are reported as African American or Black, compared to the Maryland average of 13%. A lower African American share than is typical in Maryland; local markets still vary widely.

3%

Other Ethnicity Residents — State Benchmarked 3% of residents fall into categories other than White or African American (combined), compared to the Maryland average of 6%. This column aggregates Hispanic, Asian, multiracial, and any other labeled groups that are not classified as White or African American. Reported subgroups in this total: Asian (1%), Mixed Race (1%).

13%

Residents Age 65–74 — State Benchmarked 13% of residents are 65–74, compared to the Maryland average of 13%. In line with the statewide profile for this youngest senior bracket in assisted living.

26%

Residents Age 75–84 — State Benchmarked 26% of residents are 75–84, compared to the Maryland average of 31%. Below the state norm — the resident mix may skew either younger or older than this typical middle bracket.

43%

Residents Age 85–94 — State Benchmarked 43% of residents are 85–94, compared to the Maryland average of 44%. This is typically the most common age bracket in assisted living — this facility is in line with the statewide norm.

13%

Residents Age 95+ — State Benchmarked 13% of residents are 95 or older, compared to the Maryland average of 16%. In line with the statewide profile for the oldest resident bracket.

Dulaney Valley Assisted Living at Baldwin
AL
RC
Baldwin (Hurline Farms)
10
Facility 10
MD AVG 28
Rank #195 / 576
No-Private Rooms / Semi-Private Rooms
33
Facility 33
MD AVG 21
Rank #21 / 181
--
100%

Female Residents — State Benchmarked 100% of residents are female, compared to the Maryland average of 69%. Women comprise the large majority, consistent with national assisted living demographics where women live longer and enter care facilities at higher rates.

100%

White Residents — State Benchmarked 100% of residents are reported as White, compared to the Maryland average of 81%. A higher White share than is typical for assisted living in Maryland in this dataset — compare with peer facilities for local context.

0%

African American Residents — State Benchmarked 0% of residents are reported as African American or Black, compared to the Maryland average of 13%. A lower African American share than is typical in Maryland; local markets still vary widely.

0%

Other Ethnicity Residents — State Benchmarked 0% of residents fall into categories other than White or African American (combined), compared to the Maryland average of 6%. This column aggregates Hispanic, Asian, multiracial, and any other labeled groups that are not classified as White or African American.

50%

Residents Age 65–74 — State Benchmarked 50% of residents are 65–74, compared to the Maryland average of 13%. A higher share of younger seniors often signals a more independent, active resident community with lower acuity care needs.

30%

Residents Age 75–84 — State Benchmarked 30% of residents are 75–84, compared to the Maryland average of 31%. This is the second most common age bracket in assisted living, representing residents with moderate care needs.

20%

Residents Age 85–94 — State Benchmarked 20% of residents are 85–94, compared to the Maryland average of 44%. The population here skews younger than the statewide norm, which may indicate a more active, lower-acuity community.

-

Rank badges are statewide and care-type specific: each assisted living community is ranked against every other MD assisted living community we track that reports that metric, not just the 5 on this page. See how we rank facilities

Financial assistance

Programs that may help with care and living costs in Maryland

Dulaney Valley Assisted Living at Baldwin is in Baldwin, Maryland. These programs may support different care settings or living expenses. A listing does not confirm this community participates; our concierge team can help confirm.

Get financial aid guidance
In-home or residential support

Supporting Older Adults with Resources (SOAR)

Maryland SOAR

Income limit
Income below 60% of Maryland median income.

Eligibility

General
Maryland residents age 62 or older who need daily-living assistance and meet SOAR financial criteria; designed for people not qualifying for Medicaid or waiting for Medicaid-funded supports.
MD specifics
Senior Care, Senior Assisted Living Subsidy and Congregate Housing were consolidated into SOAR on July 1, 2026.

What it provides

  • Case management; approved home/community supports and partial assistance with monthly assisted-living fees; funding and individual authorization apply.
Nursing home coverage

Maryland Nursing Home Medicaid

Maryland Medical Assistance (Medicaid) Nursing Home Program

Eligibility

General
People who meet Maryland Medicaid nursing-facility medical and financial criteria; not limited solely to adults age 65 or older.

What it provides

  • Authorized Medicaid nursing-facility care; resident contribution and covered services are subject to current rules.
Cash support · veterans

Veterans Aid and Attendance (A&A) Benefit

VA Pension Aid and Attendance and Housebound Benefits (Federal)

Who it is for
Veterans or survivors with VA pension eligibility and an Aid and Attendance or Housebound medical need
Income limit
No single monthly income cutoff. VA compares countable annual income, after permitted deductions, with the applicable Maximum Annual Pension Rate for the household and benefit category.
Asset limit
Net-worth limit is $163,699 from December 1, 2025 through November 30, 2026. Net worth includes countable assets plus annual income; exclusions and transfer rules apply.

Eligibility

General
Veterans or eligible survivors who qualify for VA Pension or Survivors Pension and meet the additional Aid and Attendance or Housebound criteria. Service, discharge, family status and pension eligibility rules also apply.
MD specifics
A federal VA pension benefit; Aid and Attendance and Housebound enhancements cannot be received together.

What it provides

  • A higher pension ceiling for eligible Aid and Attendance or Housebound recipients. Actual pension equals the applicable annual maximum minus countable income; the two enhancements cannot be paid together.
Assisted living or in-home support

Increased Community Services (ICS)

Maryland Increased Community Services (ICS)

Income limit
Monthly income exceeds 300% of SSI; the excess is paid toward care under program rules.
Asset limit
Applicant countable assets no more than $2,500.

Eligibility

General
Adults 18 or older who need nursing-facility-level care, have lived in a nursing facility at least six months with Medicaid eligibility for at least 30 consecutive days, and are not eligible for an HCBS waiver or PACE. Community living must be safe and cost no more than institutional care.
MD specifics
Referral must come from Medicaid’s Eligibility Determination Division; there is no direct application.

What it provides

  • Approved services may include assisted living; personal assistance; medical day care; respite; adaptations and supports planning.
In-home & community support

Community Options Waiver

Maryland Medicaid Community Options Waiver

Income limit
Income up to 300% of the SSI benefit rate, subject to the applicable Medicaid category.
Asset limit
Countable assets up to $2,000 or $2,500, depending on eligibility category.

Eligibility

General
Age 18 or older, nursing-facility level of care, safely living at home/community, meeting Medicaid requirements and cost-effectiveness rules; cannot simultaneously join another waiver or PACE.
MD specifics
Community applicants join a registry and await invitation. A person whose nursing-facility services have been Medicaid-paid for at least 30 days may apply without that wait.

What it provides

  • Medicaid benefits including Community First Choice plus authorized waiver services such as assisted living; behavioral consultation; case management; family training and medical day care.
In-home support

Community Personal Assistance Services (CPAS)

Maryland Medicaid Community Personal Assistance Services

Eligibility

General
People of any age with full Medicaid, living in a community setting and needing help with at least one activity of daily living.
MD specifics
State-plan benefit with no age limit.

What it provides

  • Personal assistance; nurse monitoring and supports planning; plus other covered Medicaid benefits.
In-home support

Community First Choice (CFC)

Maryland Community First Choice (CFC)

Eligibility

General
People of any age with full Maryland Medicaid who need an institutional level of care and live in a community setting.

What it provides

  • Authorized personal assistance; supports planning; nurse monitoring; accessibility adaptations; assistive technology; meals; emergency response systems and transition services.
Adult day support

Medical Day Care Services Waiver

Maryland Medical Day Care Services Waiver

Eligibility

General
People age 16 or older with full Medicaid, nursing-facility-level care needs and a medical order for day care. They may not be enrolled in another waiver and community services must cost no more than institutional care.

What it provides

  • Authorized medical day care including nursing; medication monitoring; meals; activities; therapies; social work and transportation.
Prescription costs

Senior Prescription Drug Assistance Program (SPDAP)

Maryland Senior Prescription Drug Assistance Program

Income limit
Income at or below 300% of the federal poverty level.

Eligibility

General
Maryland resident for at least six months, Medicare recipient and enrolled in a prescription-drug plan, meeting SPDAP income requirements.
MD specifics
Not restricted to age 65 and older.

What it provides

  • Assistance with eligible Medicare prescription-plan premiums.
Medicare costs

Medicare Savings Programs (MSP)

Maryland Medicare Savings Programs

Who it is for
Medicare beneficiaries with limited income who need help with premiums or cost sharing

Eligibility

General
Medicare beneficiaries meeting the applicable state Medicare Savings Program eligibility rules.
MD specifics
Applications are administered by the state Medicaid program.

What it provides

  • Assistance with Medicare premiums and; for qualified QMB beneficiaries; Medicare-covered deductibles and coinsurance. The qualifying category determines which costs are paid.
Know before you visit

Frequently Asked Questions about Dulaney Valley Assisted Living at Baldwin

Quick answers from public records and the community's own listing.
01 What neighborhood is Dulaney Valley Assisted Living at Baldwin in?
Dulaney Valley Assisted Living at Baldwin is in the Hurline Farms neighborhood of Baldwin.
02 How long has Dulaney Valley Assisted Living at Baldwin been in business?
Dulaney Valley Assisted Living at Baldwin has been operating for approximately 33 years, based on available licensing and registration records.
03 Are pets allowed at Dulaney Valley Assisted Living at Baldwin?
No, Dulaney Valley Assisted Living at Baldwin has a no-pet policy.
04 What is the best email address for Dulaney Valley Assisted Living at Baldwin?
The team at Dulaney Valley Assisted Living at Baldwin can be reached at info@dulaneyvalleyalf.com.
05 How many beds does Dulaney Valley Assisted Living at Baldwin have?
Dulaney Valley Assisted Living at Baldwin has 10 beds.
06 How much does Dulaney Valley Assisted Living at Baldwin cost per month?
Pricing at Dulaney Valley Assisted Living at Baldwin starts at $2,190 per month, with rates varying by floorplan and additional care needs.
07 Are there photos of Dulaney Valley Assisted Living at Baldwin?
Yes — there are 5 photos of Dulaney Valley Assisted Living at Baldwin in the photo gallery on this page.