


Mabel‘s House
Assisted Living, Independent Living, Memory Care & Respite Care · Gwynn Oak, MD
Mabel‘s House
Assisted Living, Independent Living, Memory Care & Respite Care · Gwynn Oak, MD
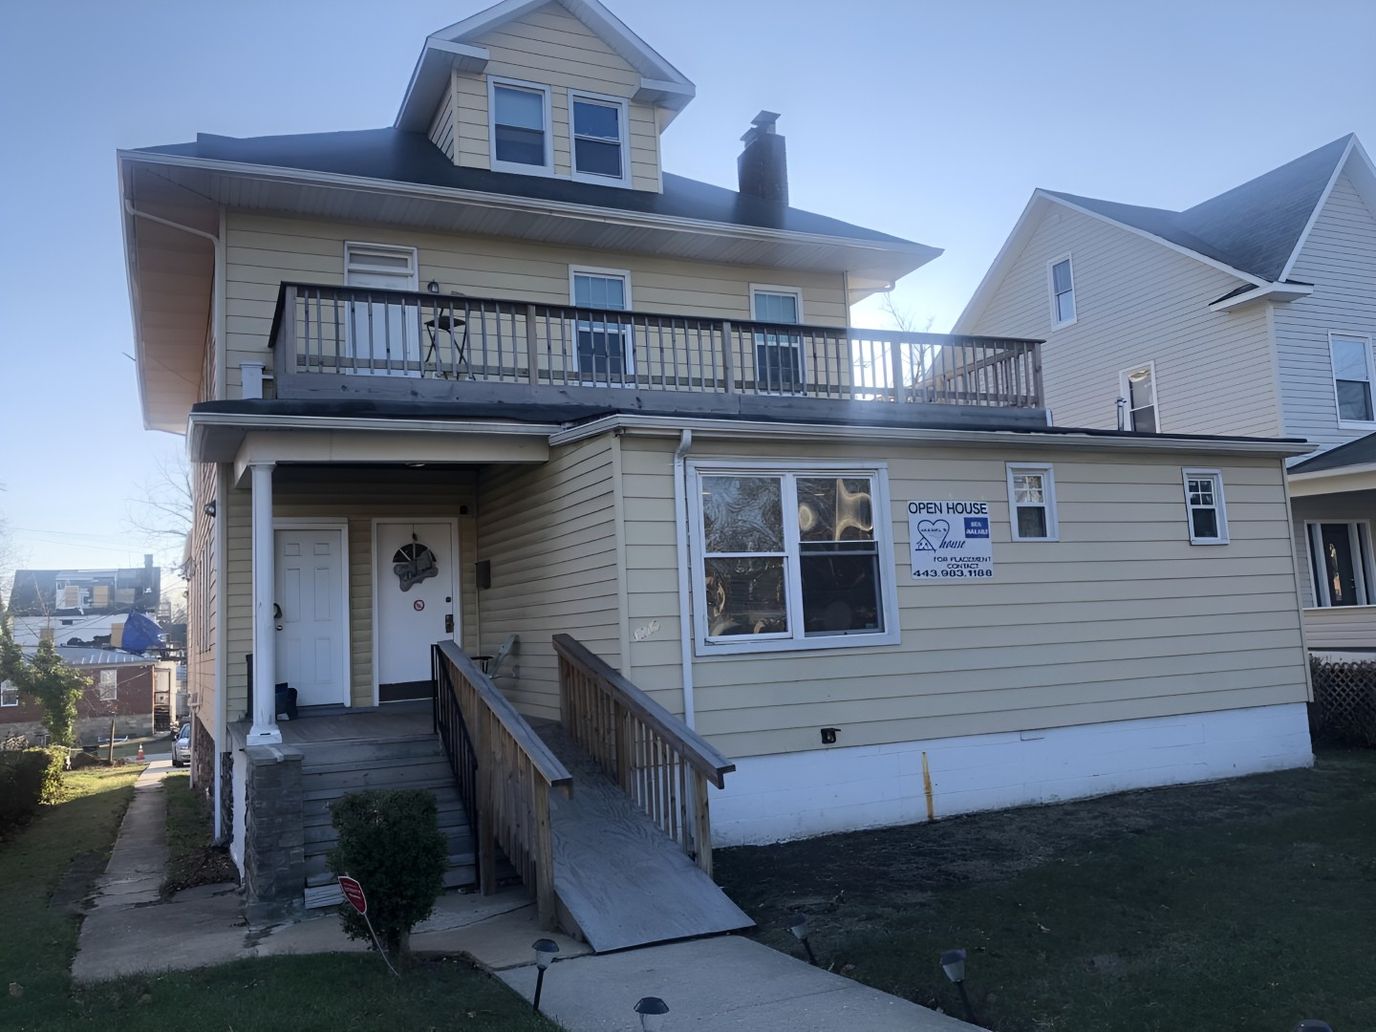
Operated by a registered nurse owner, Mabel’s House is an 8-bed assisted living and independent living community in Gwynn Oak, Maryland. The community is in a two-story residential building. It’s a small setting where personalized attention and close relationships between staff and residents are an important part of daily life. It serves older adults who need help with daily activities, those who want independent living with access to support services, residents with memory care needs, and seniors who need respite care for short-term stays.
Located on Liberty Heights Avenue, the neighborhood is very walkable. Residents have convenient access to dining, shopping, and public transportation. This location reduces isolation and makes it easier for families to visit and enjoy outings with their loved ones. The surrounding neighborhood offers the welcoming community feel that many families look for in a smaller senior living home.
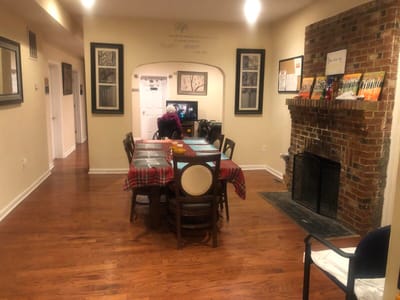
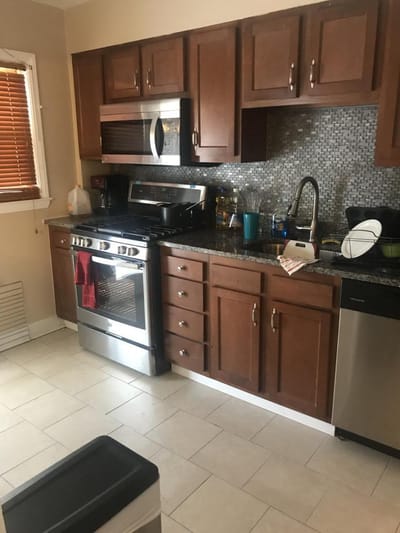
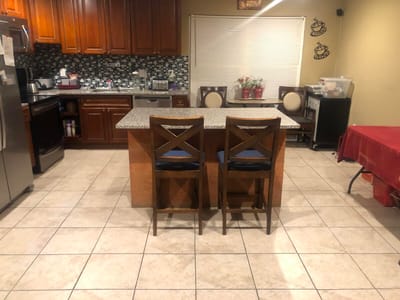
Daily life at Mabel’s House focuses on engagement and maintenance-free living. Residents can join in exercise programs and culturally enriching outings based on their interests. These help them stay active and socially connected. The community offers private and semi-private rooms, comfortable shared spaces, and household services that remove the burden of daily maintenance. Around-the-clock support is also available whenever residents need assistance.
Residents and their families value the welcoming environment and the quality of care provided. The combination of registered nurse ownership, a small community setting, and a strong focus on enrichment activities makes Mabel’s House a thoughtful choice for older adults looking for a residential assisted living community in the Baltimore area.
8-bed community Rank #301 / 685Bed count — State benchmarkedThis home is ranked 301st out of 685 homes in Maryland for bed count. Shows this facility's certified or reported bed count compared to other Maryland facilities. Larger communities may offer more amenities, programs, and on-site services for residents and families.Facilities with the same value for a metric share the same rank. Rankings are based only on facilities in Maryland that report data for that category. Facilities without available data are excluded from the ranking.Click the rank badge to see the full State ranking.Click here to see the full State ranking.
A smaller, more intimate setting that may offer a quieter environment and closer staff-resident interactions.
Walk Score: 70 / 100 Rank #184 / 985Walk Score — State benchmarkedThis home is ranked 184th out of 985 homes in Maryland for walk score. Shows how walkable this facility's neighborhood is compared to the average walk score across Maryland facilities. Higher scores benefit residents, families, and staff.Facilities with the same value for a metric share the same rank. Rankings are based only on facilities in Maryland that report data for that category. Facilities without available data are excluded from the ranking.Click the rank badge to see the full State ranking.Click here to see the full State ranking.
Very walkable. Most errands can be accomplished on foot, and many essentials are within a short walk.
About this community
Facility TypeAssisted Living
CountyMontgomery
No mild Alzheimer's level
No moderate Alzheimer's level
No severe Alzheimer's level
What does this home offer?
No pets allowed
Housing Options: Private / Semi-Private Rooms
Building Type: 2-story
Social and Recreational Activities
Reviews (1)
Mabel‘s House Reviews
Janelle Keating
I’ve been a resident here at Mabel’s House for a year now, and I can honestly say that I truly enjoy it and am satisfied with my stay. The team here makes me feel very supported and well-cared for, which I really appreciate. When it comes to dining, I’m happy with the food they provide, and the pizza is definitely a favorite of mine. My daily routine keeps me content; I spend a good amount of time watching television on my phone and working on my crossword games. I also look forward to participating in the day program. Above all, I’m just happy to be here because the people at the facility are truly nice to me.
Places of interest near Mabel‘s House
![]() 0.7 miles from city center
0.7 miles from city center
![]() Estimated distance in miles from Gwynn Oak's city center to Mabel‘s House's address, calculated via Google Maps.
Estimated distance in miles from Gwynn Oak's city center to Mabel‘s House's address, calculated via Google Maps.
Calculate Travel Distance to Mabel‘s House
Add your location
Compare Assisted Living around Baltimore
Info below is compiled from the MD Dept. of Health (OHCQ), senior community websites & trusted data sources such as Walk Score & BBB.
Communities are listed from highest to lowest based on our ranking methodology.
| Pickersgill Retirement Community | AL IL NH SNF | Baltimore (Chestnut Hill) | 138
Facility
138
MD AVG
42
Rank
#55 / 685 | No |
45
Facility
45
MD AVG
43
Rank
#475 / 985 | - | - | A+ |
24% Male Residents — State Benchmarked 24% of residents are male, compared to the Maryland average of 31%. This facility caters to a majority female resident pool (76% female), consistent with the broader assisted living trend where women significantly outnumber men. |
76% Female Residents — State Benchmarked 76% of residents are female, compared to the Maryland average of 69%. Women comprise the large majority, consistent with national assisted living demographics where women live longer and enter care facilities at higher rates. |
95% White Residents — State Benchmarked 95% of residents are reported as White, compared to the Maryland average of 81%. A higher White share than is typical for assisted living in Maryland in this dataset — compare with peer facilities for local context. |
1% African American Residents — State Benchmarked 1% of residents are reported as African American or Black, compared to the Maryland average of 13%. A lower African American share than is typical in Maryland; local markets still vary widely. |
4% Other Ethnicity Residents — State Benchmarked 4% of residents fall into categories other than White or African American (combined), compared to the Maryland average of 6%. This column aggregates Hispanic, Asian, multiracial, and any other labeled groups that are not classified as White or African American. Reported subgroups in this total: Asian (4%). |
3% Residents Age 65–74 — State Benchmarked 3% of residents are 65–74, compared to the Maryland average of 13%. Fewer younger seniors suggests the resident population skews older, likely requiring higher acuity care and more hands-on support. |
27% Residents Age 75–84 — State Benchmarked 27% of residents are 75–84, compared to the Maryland average of 31%. This is the second most common age bracket in assisted living, representing residents with moderate care needs. |
55% Residents Age 85–94 — State Benchmarked 55% of residents are 85–94, compared to the Maryland average of 44%. A high concentration of very elderly residents signals a higher-acuity facility with experience caring for advanced age-related needs. |
15% Residents Age 95+ — State Benchmarked 15% of residents are 95 or older, compared to the Maryland average of 16%. In line with the statewide profile for the oldest resident bracket. |
| Morningside House At Satyr Hill | AL HOS MC RC | Parkville (Woodcroft) | 125
Facility
125
MD AVG
42
Rank
#68 / 685 | Yes |
72
Facility
72
MD AVG
43
Rank
#160 / 985 | Private Rooms / Semi-Private Rooms | 28
Facility
28
MD AVG
21
Rank
#53 / 210 | A+ |
34% Male Residents — State Benchmarked 34% of residents are male, compared to the Maryland average of 31%. This facility caters to a majority female resident pool (66% female), consistent with the broader assisted living trend where women significantly outnumber men. |
66% Female Residents — State Benchmarked 66% of residents are female, compared to the Maryland average of 69%. Women comprise the large majority, consistent with national assisted living demographics where women live longer and enter care facilities at higher rates. |
98% White Residents — State Benchmarked 98% of residents are reported as White, compared to the Maryland average of 81%. A higher White share than is typical for assisted living in Maryland in this dataset — compare with peer facilities for local context. |
2% African American Residents — State Benchmarked 2% of residents are reported as African American or Black, compared to the Maryland average of 13%. A lower African American share than is typical in Maryland; local markets still vary widely. |
0% Other Ethnicity Residents — State Benchmarked 0% of residents fall into categories other than White or African American (combined), compared to the Maryland average of 6%. This column aggregates Hispanic, Asian, multiracial, and any other labeled groups that are not classified as White or African American. |
13% Residents Age 65–74 — State Benchmarked 13% of residents are 65–74, compared to the Maryland average of 13%. In line with the statewide profile for this youngest senior bracket in assisted living. |
40% Residents Age 75–84 — State Benchmarked 40% of residents are 75–84, compared to the Maryland average of 31%. A high concentration in this mid-range bracket, where residents typically need moderate support with daily activities. |
29% Residents Age 85–94 — State Benchmarked 29% of residents are 85–94, compared to the Maryland average of 44%. The population here skews younger than the statewide norm, which may indicate a more active, lower-acuity community. |
16% Residents Age 95+ — State Benchmarked 16% of residents are 95 or older, compared to the Maryland average of 16%. In line with the statewide profile for the oldest resident bracket. |
| Morningside House of Friendship | AL HOS MC RC | Hanover | 103
Facility
103
MD AVG
42
Rank
#103 / 685 | Yes |
36
Facility
36
MD AVG
43
Rank
#563 / 985 | Studio / 1 Bed / 2 Bed | 33
Facility
33
MD AVG
21
Rank
#25 / 210 | - |
23% Male Residents — State Benchmarked 23% of residents are male, compared to the Maryland average of 31%. This facility caters to a majority female resident pool (77% female), consistent with the broader assisted living trend where women significantly outnumber men. |
77% Female Residents — State Benchmarked 77% of residents are female, compared to the Maryland average of 69%. Women comprise the large majority, consistent with national assisted living demographics where women live longer and enter care facilities at higher rates. |
86% White Residents — State Benchmarked 86% of residents are reported as White, compared to the Maryland average of 81%. Close to the average for this category among assisted living facilities in Maryland with reported race/ethnicity data. |
13% African American Residents — State Benchmarked 13% of residents are reported as African American or Black, compared to the Maryland average of 13%. In line with the Maryland average for African American residents among facilities reporting this breakdown. |
1% Other Ethnicity Residents — State Benchmarked 1% of residents fall into categories other than White or African American (combined), compared to the Maryland average of 6%. This column aggregates Hispanic, Asian, multiracial, and any other labeled groups that are not classified as White or African American. Reported subgroups in this total: Asian (1%). |
8% Residents Age 65–74 — State Benchmarked 8% of residents are 65–74, compared to the Maryland average of 13%. Fewer younger seniors suggests the resident population skews older, likely requiring higher acuity care and more hands-on support. |
35% Residents Age 75–84 — State Benchmarked 35% of residents are 75–84, compared to the Maryland average of 31%. This is the second most common age bracket in assisted living, representing residents with moderate care needs. |
41% Residents Age 85–94 — State Benchmarked 41% of residents are 85–94, compared to the Maryland average of 44%. This is typically the most common age bracket in assisted living — this facility is in line with the statewide norm. |
16% Residents Age 95+ — State Benchmarked 16% of residents are 95 or older, compared to the Maryland average of 16%. In line with the statewide profile for the oldest resident bracket. |
| Brightview Mays Chapel Ridge | AL IL MC | Timonium (Dixon Hill) | 89
Facility
89
MD AVG
42
Rank
#150 / 685 | Yes |
52
Facility
52
MD AVG
43
Rank
#402 / 985 | Studio / 1 Bed / 2 Bed | 50
Facility
50
MD AVG
21
Rank
#1 / 210 | A+ |
13% Male Residents — State Benchmarked 13% of residents are male, compared to the Maryland average of 31%. This facility caters to a majority female resident pool (87% female), consistent with the broader assisted living trend where women significantly outnumber men. |
87% Female Residents — State Benchmarked 87% of residents are female, compared to the Maryland average of 69%. Women comprise the large majority, consistent with national assisted living demographics where women live longer and enter care facilities at higher rates. |
99% White Residents — State Benchmarked 99% of residents are reported as White, compared to the Maryland average of 81%. A higher White share than is typical for assisted living in Maryland in this dataset — compare with peer facilities for local context. |
0% African American Residents — State Benchmarked 0% of residents are reported as African American or Black, compared to the Maryland average of 13%. A lower African American share than is typical in Maryland; local markets still vary widely. |
1% Other Ethnicity Residents — State Benchmarked 1% of residents fall into categories other than White or African American (combined), compared to the Maryland average of 6%. This column aggregates Hispanic, Asian, multiracial, and any other labeled groups that are not classified as White or African American. Reported subgroups in this total: Asian (1%). |
3% Residents Age 65–74 — State Benchmarked 3% of residents are 65–74, compared to the Maryland average of 13%. Fewer younger seniors suggests the resident population skews older, likely requiring higher acuity care and more hands-on support. |
30% Residents Age 75–84 — State Benchmarked 30% of residents are 75–84, compared to the Maryland average of 31%. This is the second most common age bracket in assisted living, representing residents with moderate care needs. |
48% Residents Age 85–94 — State Benchmarked 48% of residents are 85–94, compared to the Maryland average of 44%. This is typically the most common age bracket in assisted living — this facility is in line with the statewide norm. |
18% Residents Age 95+ — State Benchmarked 18% of residents are 95 or older, compared to the Maryland average of 16%. In line with the statewide profile for the oldest resident bracket. |
| Mabel‘s House | AL IL MC RC | Gwynn Oak (Central Forest Park) | 8
Facility
8
MD AVG
42
Rank
#301 / 685 | No |
70
Facility
70
MD AVG
43
Rank
#184 / 985 | Private / Semi-Private Rooms | - | - | - | - | - | - | - | - | - | - | - |
Financial Assistance for
Assisted Living in Maryland
Mabel‘s House is located in Gwynn Oak, Maryland.
Here are the financial assistance programs available to residents in Maryland.
Frequently Asked Questions about Mabel‘s House
What neighborhood is Mabel‘s House in?
Mabel‘s House is in the Central Forest Park neighborhood of Gwynn Oak.
Is Mabel‘s House in a walkable area?
Mabel‘s House has a walk score of 70. Very walkable. Most errands can be accomplished on foot, and many essentials are within a short walk.
Are pets allowed at Mabel‘s House?
No, Mabel‘s House has a no-pet policy.
How many beds does Mabel‘s House have?
Mabel‘s House has 8 beds.
Are there photos of Mabel‘s House?
Yes — there are 4 photos of Mabel‘s House in the photo gallery on this page.
What is the address of Mabel‘s House?
Mabel‘s House is located at 4205 Liberty Heights Ave, Gwynn Oak, MD 21207.
What is the phone number of Mabel‘s House?
(443) 561-7447 will put you in contact with the team at Mabel‘s House.
Guides for Better Senior Living
Care Cost Calculator: See Prices in Your Area
Assisted Living Explorer
Don’t Wait Too Long: 7 Red Flag Signs Your Parent Needs Assisted Living Now
The True Cost of Assisted Living in 2025 – And How Families Are Paying For It
Understanding Senior Living Costs: Pricing Models, Discounts & Financial Assistance
Updated on
