


Montgomery Eldercare at Orchard Way
Assisted Living, Hospice Care, Memory Care & Respite Care · Silver Spring, MD
Montgomery Eldercare at Orchard Way
Assisted Living, Hospice Care, Memory Care & Respite Care · Silver Spring, MD
Montgomery Eldercare at Orchard Way accepts Medicaid.
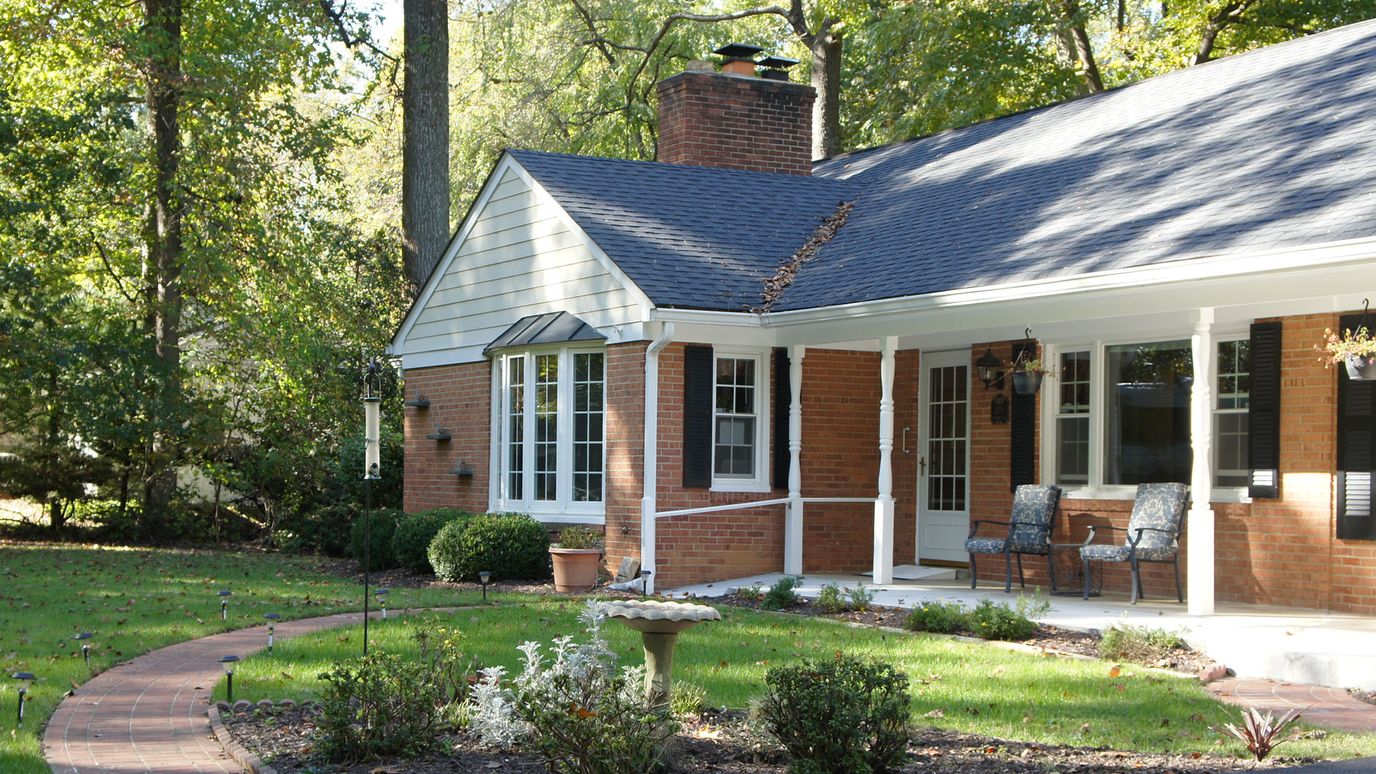
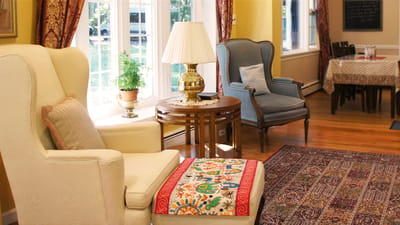
Montgomery Eldercare at Orchard Way is an astounding community located in the peaceful neighborhood of Orchard Way, Silver Spring, MD, offering memory care. Dedicated to enhancing residents’ quality of life, the community provides top-notch care and assistance with a kind and highly trained team available around the clock. Residents also enjoy a worry-free lifestyle with the community handling the housekeeping, laundry, and other day-to-day activities.
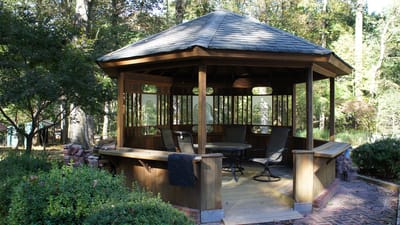
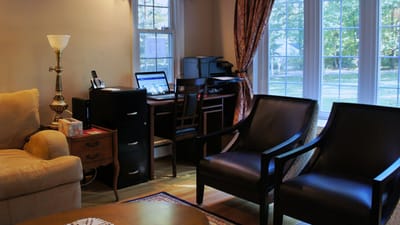
With the community’s various entertainment options, residents are encouraged to do the things they love and interact with their newfound friends. Delicious and healthy meals are also served for residents’ dietary needs and preferences. Hospice and respite care are also available to meet residents’ preferences and unique needs. Live a blissful retirement with the community’s cozy amenities and dedicated care.
6-bed community Rank #397 / 685Bed count — State benchmarkedThis home is ranked 397th out of 685 homes in Maryland for bed count. Shows this facility's certified or reported bed count compared to other Maryland facilities. Larger communities may offer more amenities, programs, and on-site services for residents and families.Facilities with the same value for a metric share the same rank. Rankings are based only on facilities in Maryland that report data for that category. Facilities without available data are excluded from the ranking.Click the rank badge to see the full State ranking.Click here to see the full State ranking.
A smaller, more intimate setting that may offer a quieter environment and closer staff-resident interactions.
Walk Score: 9 / 100 Rank #853 / 985Walk Score — State benchmarkedThis home is ranked 853rd out of 985 homes in Maryland for walk score. Shows how walkable this facility's neighborhood is compared to the average walk score across Maryland facilities. Higher scores benefit residents, families, and staff.Facilities with the same value for a metric share the same rank. Rankings are based only on facilities in Maryland that report data for that category. Facilities without available data are excluded from the ranking.Click the rank badge to see the full State ranking.Click here to see the full State ranking.
Car-dependent. Most errands require a car, with limited nearby walkable options.
About this community
Facility TypeAssisted Living
CountyAnne Arundel
No mild Alzheimer's level
No moderate Alzheimer's level
No severe Alzheimer's level
What does this home offer?
No pets allowed
Housing Options: Private / Semi-Private Rooms
Building Type: Single-story
Beauty Services
Housekeeping Services
Recreational Activities
Exercise Programs
Places of interest near Montgomery Eldercare at Orchard Way
![]() 6.4 miles from city center
6.4 miles from city center
![]() Estimated distance in miles from Silver Spring's city center to Montgomery Eldercare at Orchard Way's address, calculated via Google Maps.
Estimated distance in miles from Silver Spring's city center to Montgomery Eldercare at Orchard Way's address, calculated via Google Maps.
Calculate Travel Distance to Montgomery Eldercare at Orchard Way
Add your location
Compare Assisted Living around Montgomery County
Info below is compiled from the MD Dept. of Health (OHCQ), senior community websites & trusted data sources such as Walk Score & BBB.
Communities are listed from highest to lowest based on our ranking methodology.
| Asbury Methodist Village | AL IL MC NH SNF | Gaithersburg (Russell Avenue) | 164
Facility
164
MD AVG
42
Rank
#26 / 685 | Yes |
41
Facility
41
MD AVG
43
Rank
#508 / 985 | - | 27
Facility
27
MD AVG
21
Rank
#62 / 210 | - |
21% Male Residents — State Benchmarked 21% of residents are male, compared to the Maryland average of 31%. This facility caters to a majority female resident pool (79% female), consistent with the broader assisted living trend where women significantly outnumber men. |
79% Female Residents — State Benchmarked 79% of residents are female, compared to the Maryland average of 69%. Women comprise the large majority, consistent with national assisted living demographics where women live longer and enter care facilities at higher rates. |
92% White Residents — State Benchmarked 92% of residents are reported as White, compared to the Maryland average of 81%. A higher White share than is typical for assisted living in Maryland in this dataset — compare with peer facilities for local context. |
1% African American Residents — State Benchmarked 1% of residents are reported as African American or Black, compared to the Maryland average of 13%. A lower African American share than is typical in Maryland; local markets still vary widely. |
7% Other Ethnicity Residents — State Benchmarked 7% of residents fall into categories other than White or African American (combined), compared to the Maryland average of 6%. This column aggregates Hispanic, Asian, multiracial, and any other labeled groups that are not classified as White or African American. Reported subgroups in this total: Asian (7%). |
1% Residents Age 65–74 — State Benchmarked 1% of residents are 65–74, compared to the Maryland average of 13%. Fewer younger seniors suggests the resident population skews older, likely requiring higher acuity care and more hands-on support. |
21% Residents Age 75–84 — State Benchmarked 21% of residents are 75–84, compared to the Maryland average of 31%. Below the state norm — the resident mix may skew either younger or older than this typical middle bracket. |
48% Residents Age 85–94 — State Benchmarked 48% of residents are 85–94, compared to the Maryland average of 44%. This is typically the most common age bracket in assisted living — this facility is in line with the statewide norm. |
30% Residents Age 95+ — State Benchmarked 30% of residents are 95 or older, compared to the Maryland average of 16%. A high proportion of the oldest-old suggests strong end-of-life care experience and very-high-acuity capabilities. |
| Modena Reserve at Kensington | AL IL MC | Kensington (Metropolitan Avenue) | 80
Facility
80
MD AVG
42
Rank
#166 / 685 | No |
85
Facility
85
MD AVG
43
Rank
#54 / 985 | - | 4
Facility
4
MD AVG
21
Rank
#195 / 210 | - | - | - | - | - | - | - | - | - | - |
| Caring Companions Inc | AL HOS RESC RC | Silver Spring | 14
Facility
14
MD AVG
42
Rank
#283 / 685 | No |
34
Facility
34
MD AVG
43
Rank
#590 / 985 | Semi-Private / 1 Bed Studio | 41
Facility
41
MD AVG
21
Rank
#10 / 210 | A+ |
58% Male Residents — State Benchmarked 58% of residents are male, compared to the Maryland average of 31%. An unusually high male share for assisted living, where most facilities skew heavily female. |
42% Female Residents — State Benchmarked 42% of residents are female, compared to the Maryland average of 69%. An unusually low female share — most assisted living facilities have 65–75% female residents. |
75% White Residents — State Benchmarked 75% of residents are reported as White, compared to the Maryland average of 81%. Close to the average for this category among assisted living facilities in Maryland with reported race/ethnicity data. |
17% African American Residents — State Benchmarked 17% of residents are reported as African American or Black, compared to the Maryland average of 13%. In line with the Maryland average for African American residents among facilities reporting this breakdown. |
8% Other Ethnicity Residents — State Benchmarked 8% of residents fall into categories other than White or African American (combined), compared to the Maryland average of 6%. This column aggregates Hispanic, Asian, multiracial, and any other labeled groups that are not classified as White or African American. Reported subgroups in this total: Asian (8%). |
58% Residents Age 65–74 — State Benchmarked 58% of residents are 65–74, compared to the Maryland average of 13%. A higher share of younger seniors often signals a more independent, active resident community with lower acuity care needs. |
17% Residents Age 75–84 — State Benchmarked 17% of residents are 75–84, compared to the Maryland average of 31%. Below the state norm — the resident mix may skew either younger or older than this typical middle bracket. |
17% Residents Age 85–94 — State Benchmarked 17% of residents are 85–94, compared to the Maryland average of 44%. The population here skews younger than the statewide norm, which may indicate a more active, lower-acuity community. |
8% Residents Age 95+ — State Benchmarked 8% of residents are 95 or older, compared to the Maryland average of 16%. Most residents here have not yet reached the oldest-old bracket, suggesting a younger overall community. |
| Montgomery Eldercare at Orchard Way | AL HOS MC RC | Silver Spring | 6
Facility
6
MD AVG
42
Rank
#397 / 685 | No |
9
Facility
9
MD AVG
43
Rank
#853 / 985 | Private / Semi-Private Rooms | - | - | - | - | - | - | - | - | - | - | - |
| Winter Growth | AL ADC MC RC | Olney (Timberland Estates) | - | No |
60
Facility
60
MD AVG
43
Rank
#316 / 985 | Private Rooms | - | - | - | - | - | - | - | - | - | - | - |
Financial Assistance for
Assisted Living in Maryland
Montgomery Eldercare at Orchard Way is located in Silver Spring, Maryland.
Here are the financial assistance programs available to residents in Maryland.
Frequently Asked Questions about Montgomery Eldercare at Orchard Way
Is Montgomery Eldercare at Orchard Way in a walkable area?
Montgomery Eldercare at Orchard Way has a walk score of 9. Car-dependent. Most errands require a car, with limited nearby walkable options.
Are pets allowed at Montgomery Eldercare at Orchard Way?
No, Montgomery Eldercare at Orchard Way has a no-pet policy.
How many beds does Montgomery Eldercare at Orchard Way have?
Montgomery Eldercare at Orchard Way has 6 beds.
Are there photos of Montgomery Eldercare at Orchard Way?
Yes — there are 4 photos of Montgomery Eldercare at Orchard Way in the photo gallery on this page.
What is the address of Montgomery Eldercare at Orchard Way?
Montgomery Eldercare at Orchard Way is located at 1106 Orchard Way, Silver Spring, MD 20904.
What is the phone number of Montgomery Eldercare at Orchard Way?
(301) 655-1978 will put you in contact with the team at Montgomery Eldercare at Orchard Way.
What county is Montgomery Eldercare at Orchard Way located in?
Montgomery Eldercare at Orchard Way is in Anne Arundel County.
Guides for Better Senior Living
Care Cost Calculator: See Prices in Your Area
Assisted Living Explorer
Don’t Wait Too Long: 7 Red Flag Signs Your Parent Needs Assisted Living Now
The True Cost of Assisted Living in 2025 – And How Families Are Paying For It
Understanding Senior Living Costs: Pricing Models, Discounts & Financial Assistance
Updated on
