


Total health inspections
4
Maryland average 3.9
Last Health inspection on Apr 2025
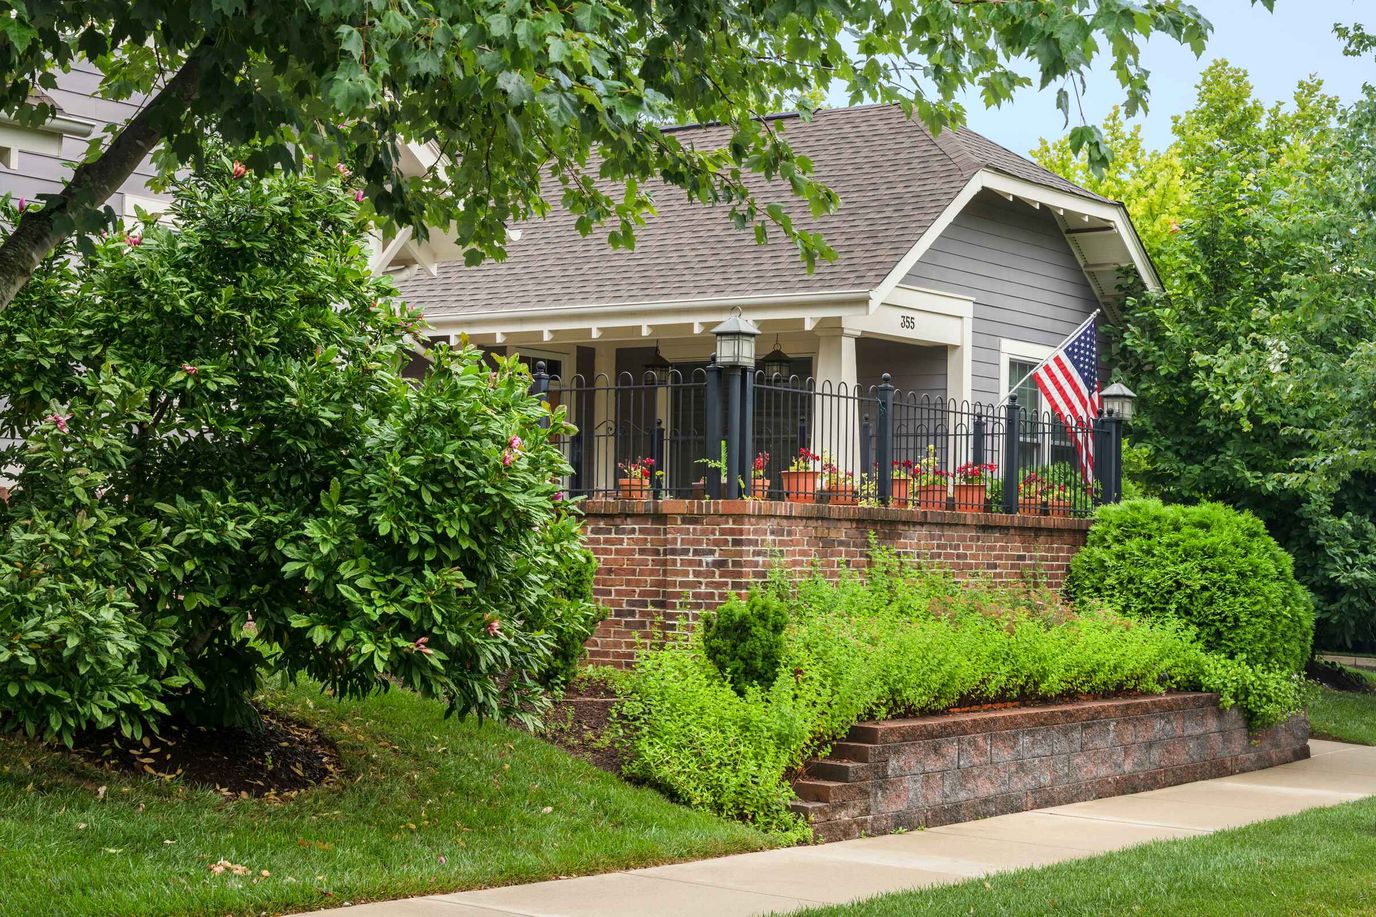


Asbury Methodist Village shines as a steadfast haven in Gaithersburg, Maryland, dedicated to enriching the lives of seniors as they embark on their retirement journey. With a commitment to providing unwavering support and meaningful experiences, this exceptional community offers a comprehensive range of services, including assisted living levels of care, skilled nursing care, and residential living. The dedicated team of highly trained professionals is always at the ready, ensuring that residents’ needs are met with unparalleled expertise and compassion.
As a distinguished not-for-profit continuing care retirement community, the home sets a remarkable standard of excellence across all facets of its operation. Its unwavering dedication to maintaining the highest standards is reflected not only in its robust programs and services but also in its commitment to nursing home care that is personalized and compassionate. Adhering to nursing home rules and regulations, the community provides a secure and nurturing environment where residents can thrive. The positive experiences and glowing nursing home reviews from residents and their families speak volumes about the genuine care and attention that define the essence of Asbury Methodist Village.
| Staff type | Hours / Day / Resident | vs state avg |
|---|---|---|
|
Registered Nurse (RN)
| 1h 2m per day | ▲ 27% State avg: 49m per day · National avg: 41m per day |
|
LPN / LVN
| 51m per day | ▼ 6% State avg: 55m per day · National avg: 52m per day |
|
Nurse Aide
| 2h 7m per day | ■ Avg State avg: 2h 8m per day · National avg: 2h 20m per day |
|
Weekend Total Nursing
| 3h 43m per day | ▲ 6% State avg: 3h 31m per day · National avg: 3h 27m per day |
|
Physical Therapist
| 8m per day | ▲ 36% State avg: 6m per day · National avg: 4m per day |
|
Weekend RN
| 52m per day | ▲ 43% State avg: 37m per day · National avg: 29m per day |
Maryland average 3.9
Last Health inspection on Apr 2025
Maryland average 49.9
Maryland average 12.81
Health citations are formal notices following inspections when they fail to comply with safety and care standards.
24 of 29 citations resulted from standard inspections; and 5 of 29 resulted from complaint investigations.
Maryland average: 0.5
Maryland average: 0.6
Resident demographic information for this facility.
How this facility protects residents through staff vaccination policies and immunization practices.
Awarded by the Maryland Health Care Commission (MHCC) to healthcare facilities that achieve a high influenza vaccination rate.
The facility requires certain vaccinations for staff as part of its infection prevention measures.
Reporting period: October 1 – December 31, 2025 (Q4 2025). Source: CMS Payroll-Based Journal report.
Manages medical care and health needs.
Assists with medical care and medications.
Helps with daily care and mobility.
Total hours from contractors
6,855 contractor hours this quarter
| Certified Nursing Assistant | 80 | 0 | 80 | 28,356 | 92 | 100% | 6.9 |
| Registered Nurse | 42 | 0 | 42 | 13,274 | 92 | 100% | 7.4 |
| Licensed Practical Nurse | 31 | 0 | 31 | 12,189 | 92 | 100% | 7.8 |
| Medication Aide/Technician | 9 | 0 | 9 | 3,262 | 92 | 100% | 7.5 |
| Clinical Nurse Specialist | 6 | 0 | 6 | 2,007 | 64 | 70% | 8 |
| Respiratory Therapy Technician | 0 | 9 | 9 | 1,973 | 79 | 86% | 7.3 |
| Physical Therapy Assistant | 0 | 9 | 9 | 1,874 | 84 | 91% | 7.1 |
| Other Dietary Services Staff | 5 | 0 | 5 | 1,837 | 91 | 99% | 7.9 |
| Physical Therapy Aide | 0 | 4 | 4 | 1,045 | 73 | 79% | 7.9 |
| Speech Language Pathologist | 0 | 5 | 5 | 992 | 88 | 96% | 7.4 |
| Dental Services Staff | 2 | 0 | 2 | 968 | 64 | 70% | 8 |
| Qualified Social Worker | 0 | 4 | 4 | 865 | 69 | 75% | 6.7 |
| Occupational Therapy Aide | 2 | 0 | 2 | 848 | 62 | 67% | 8 |
| Dietitian | 4 | 0 | 4 | 777 | 64 | 70% | 8 |
| RN Director of Nursing | 2 | 0 | 2 | 555 | 59 | 64% | 7.4 |
| Administrator | 1 | 0 | 1 | 472 | 59 | 64% | 8 |
| Mental Health Service Worker | 1 | 0 | 1 | 456 | 57 | 62% | 8 |
| Nurse Practitioner | 1 | 0 | 1 | 288 | 36 | 39% | 8 |
| Occupational Therapy Assistant | 0 | 1 | 1 | 60 | 30 | 33% | 2 |
| Medical Director | 0 | 1 | 1 | 46 | 24 | 26% | 1.9 |
Federal penalties imposed by CMS for regulatory violations, including civil money penalties (fines) and denials of payment for new Medicare/Medicaid admissions.
Source: CMS Penalties Database
No penalties in the past 3 years
No civil money penalties or payment denials were reported in the last 3 years.
These measures show how residents usually do over time at this home, based on health outcomes and preventive care.
Maryland average: 12.9
Maryland average: 25.7
Maryland average: 23.7%
Maryland average: 27.7%
Maryland average: 25.9%
Maryland average: 2.3%
Maryland average: 6.5%
Maryland average: 1.6%
Maryland average: 5.8%
Maryland average: 20.2%
Maryland average: 12.9%
Maryland average: 92.0%
Maryland average: 96.6%
Maryland average: 78.4%
Maryland average: 1.4%
Maryland average: 80.6%
Quality measures are calculated from Minimum Data Set (MDS) assessments. For most measures, lower percentages indicate better care quality.
61% of new residents, usually for short-term rehab.
38% of new residents, often for short stays.
1% of new residents, often for long-term daily care.
Source: CMS Long-Term Care Facility Characteristics (Data as of Jan 2026)
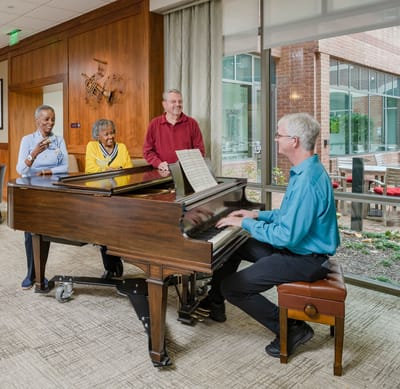
Residents meet regularly to discuss policies, care quality, and activities
Part of a Continuing Care Retirement Community offering multiple care levels
Organized group of residents that meets regularly to discuss facility policies, quality of life, and activities.
Data sourced from CMS Long-Term Care Facility Characteristics quarterly report. Payer mix reflects the current resident census by primary payment source.
Historical financial and operational data for Asbury Methodist Village from 2011–2023, based on CMS SNF Cost Reports.
Key figures below are for fiscal year ending in 12/2023.
Based on CMS SNF Cost Report for fiscal year ending in 12/2023.
Pets Allowed
Building Type: High-rise
Most residents typically stay for a few weeks or months before returning home or moving on.
Most new residents arrive under Medicare (61% of admissions), and a typical Medicare stay runs around 1 months.
Coverage residents most often arrive under.
Coverage residents most often leave under.

![]() 0.5 miles from city center
0.5 miles from city center
![]() Estimated distance in miles from Gaithersburg's city center to Asbury Methodist Village's address, calculated via Google Maps.
— 3.48 miles to nearest hospital (Adventist HealthCare Shady Grove Medical Center)
Estimated distance in miles from Gaithersburg's city center to Asbury Methodist Village's address, calculated via Google Maps.
— 3.48 miles to nearest hospital (Adventist HealthCare Shady Grove Medical Center)
Add your location
The information below is reported by the Maryland Department of Health, Office of Health Care Quality.
| Montcare Bethesda | NH HOS MC PC SNF | Bethesda (Georgetown Village) | 120
Facility
120
MD AVG
43
Rank
#76 / 690 |
85.3%
Facility
85.3%
MD AVG
80.8
Rank
#63 / 104 | +6% | 3.04
Facility
3.04
MD AVG
3.77
Rank
#127 / 143 | -9% | -19% | $0
Facility
$0
MD AVG
$65.0k
Rank
#1 / 145 | 34
Facility
34
MD AVG
49.9
Rank
#50 / 145 | 8.5
Facility
8.5
MD AVG
12.8
Rank
#45 / 145 | - | 102 | - |
70
Facility
70
MD AVG
43
Rank
#184 / 985 | Jack Ribikow | $10.5M*Fiscal year ending 12/2022These figures are from this home's most recent complete cost report — an older period than most facilities report. Compare with that in mind.
Facility
$10.5M*Fiscal year ending 12/2022These figures are from this home's most recent complete cost report — an older period than most facilities report. Compare with that in mind.
MD AVG
$18.7M
Rank
#121 / 144 | $5.0M*Fiscal year ending 12/2022These figures are from this home's most recent complete cost report — an older period than most facilities report. Compare with that in mind.
Facility
$5.0M*Fiscal year ending 12/2022These figures are from this home's most recent complete cost report — an older period than most facilities report. Compare with that in mind.
MD AVG
$6.5M
Rank
#127 / 144 | 47%*Fiscal year ending 12/2022These figures are from this home's most recent complete cost report — an older period than most facilities report. Compare with that in mind.
Facility
47%*Fiscal year ending 12/2022These figures are from this home's most recent complete cost report — an older period than most facilities report. Compare with that in mind.
MD AVG
38.5%
Rank
#83 / 144 | 215095 | ||||
| Asbury Methodist Village | NH AL IL MC SNF | Gaithersburg (Russell Avenue) | 164
Facility
164
MD AVG
43
Rank
#26 / 690 | - | - | 3.92
Facility
3.92
MD AVG
3.77
Rank
#41 / 143 | +40% | +4% | $0
Facility
$0
MD AVG
$65.0k
Rank
#1 / 145 | 29
Facility
29
MD AVG
49.9
Rank
#28 / 145 | 7.3
Facility
7.3
MD AVG
12.8
Rank
#25 / 145 | - | 163 | - |
41
Facility
41
MD AVG
43
Rank
#508 / 985 | Asbury Communities Inc | $28.6MFiscal year ending 12/2023
Facility
$28.6MFiscal year ending 12/2023
MD AVG
$18.7M
Rank
#11 / 144 | $18.6MFiscal year ending 12/2023
Facility
$18.6MFiscal year ending 12/2023
MD AVG
$6.5M
Rank
#11 / 144 | 64.8%Fiscal year ending 12/2023
Facility
64.8%Fiscal year ending 12/2023
MD AVG
38.5%
Rank
#90 / 144 | 215099 | ||||
| Montcare Wheaton | NH HOS MC PC SNF | Wheaton | 94
Facility
94
MD AVG
43
Rank
#144 / 690 |
94.6%
Facility
94.6%
MD AVG
80.8
Rank
#16 / 104 | +17% | 3.10
Facility
3.10
MD AVG
3.77
Rank
#119 / 143 | -19% | -18% | $0
Facility
$0
MD AVG
$65.0k
Rank
#1 / 145 | 58
Facility
58
MD AVG
49.9
Rank
#103 / 145 | 19.3
Facility
19.3
MD AVG
12.8
Rank
#126 / 145 | - | 89 | - |
63
Facility
63
MD AVG
43
Rank
#273 / 985 | Md3 Operator Holdco LLC | $10.3M*Fiscal year ending 08/2022These figures are from this home's most recent complete cost report — an older period than most facilities report. Compare with that in mind.
Facility
$10.3M*Fiscal year ending 08/2022These figures are from this home's most recent complete cost report — an older period than most facilities report. Compare with that in mind.
MD AVG
$18.7M
Rank
#114 / 144 | $6.3M*Fiscal year ending 08/2022These figures are from this home's most recent complete cost report — an older period than most facilities report. Compare with that in mind.
Facility
$6.3M*Fiscal year ending 08/2022These figures are from this home's most recent complete cost report — an older period than most facilities report. Compare with that in mind.
MD AVG
$6.5M
Rank
#115 / 144 | 60.9%*Fiscal year ending 08/2022These figures are from this home's most recent complete cost report — an older period than most facilities report. Compare with that in mind.
Facility
60.9%*Fiscal year ending 08/2022These figures are from this home's most recent complete cost report — an older period than most facilities report. Compare with that in mind.
MD AVG
38.5%
Rank
#62 / 144 | 215048 | ||||
| Sligo Creek Healthcare | NH SNF | Takoma Park (Carroll Manor) | 102
Facility
102
MD AVG
43
Rank
#109 / 690 |
93.1%
Facility
93.1%
MD AVG
80.8
Rank
#22 / 104 | +15% | 3.53
Facility
3.53
MD AVG
3.77
Rank
#69 / 143 | -2% | -7% | $12.7k
Facility
$12.7k
MD AVG
$65.0k
Rank
#99 / 145 | 42
Facility
42
MD AVG
49.9
Rank
#73 / 145 | 10.5
Facility
10.5
MD AVG
12.8
Rank
#61 / 145 | 1 | 95 | - |
60
Facility
60
MD AVG
43
Rank
#316 / 985 | Woodside Park MD Holdco LLC | $12.9M*Fiscal year ending 12/2022These figures are from this home's most recent complete cost report — an older period than most facilities report. Compare with that in mind.
Facility
$12.9M*Fiscal year ending 12/2022These figures are from this home's most recent complete cost report — an older period than most facilities report. Compare with that in mind.
MD AVG
$18.7M
Rank
#113 / 144 | $5.2M*Fiscal year ending 12/2022These figures are from this home's most recent complete cost report — an older period than most facilities report. Compare with that in mind.
Facility
$5.2M*Fiscal year ending 12/2022These figures are from this home's most recent complete cost report — an older period than most facilities report. Compare with that in mind.
MD AVG
$6.5M
Rank
#108 / 144 | 40%*Fiscal year ending 12/2022These figures are from this home's most recent complete cost report — an older period than most facilities report. Compare with that in mind.
Facility
40%*Fiscal year ending 12/2022These figures are from this home's most recent complete cost report — an older period than most facilities report. Compare with that in mind.
MD AVG
38.5%
Rank
#53 / 144 | 215327 | ||||
| Kensington Healthcare Center | NH SNF | Kensington (Mccomas Avenue) | 140
Facility
140
MD AVG
43
Rank
#50 / 690 |
90.6%
Facility
90.6%
MD AVG
80.8
Rank
#40 / 104 | +12% | 3.83
Facility
3.83
MD AVG
3.77
Rank
#47 / 143 | -6% | +2% | $96.0k
Facility
$96.0k
MD AVG
$65.0k
Rank
#140 / 145 | 42
Facility
42
MD AVG
49.9
Rank
#73 / 145 | 10.5
Facility
10.5
MD AVG
12.8
Rank
#61 / 145 | 2 | 127 | - |
32
Facility
32
MD AVG
43
Rank
#609 / 985 | Wo Holdings LLC | $17.4MFiscal year ending 12/2023
Facility
$17.4MFiscal year ending 12/2023
MD AVG
$18.7M
Rank
#60 / 144 | $7.3MFiscal year ending 12/2023
Facility
$7.3MFiscal year ending 12/2023
MD AVG
$6.5M
Rank
#70 / 144 | 41.8%Fiscal year ending 12/2023
Facility
41.8%Fiscal year ending 12/2023
MD AVG
38.5%
Rank
#108 / 144 | 215043 |
Asbury Methodist Village is located in Gaithersburg, Maryland.
Here are the financial assistance programs available to residents in Maryland.
Asbury Methodist Village is in the Russell Avenue neighborhood of Gaithersburg.
Asbury Methodist Village has a walk score of 41. Somewhat walkable. A few nearby services may be reachable on foot, but most trips require transportation.
Asbury Methodist Village's occupancy is 61.4%.
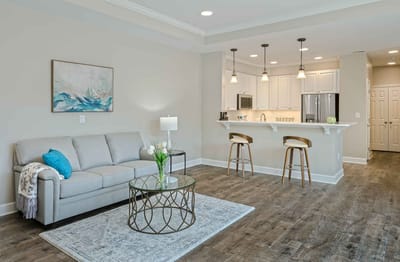
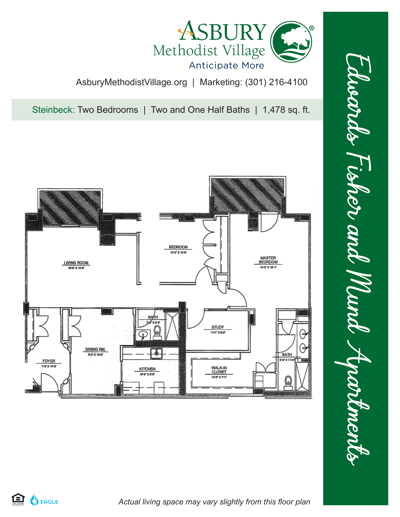
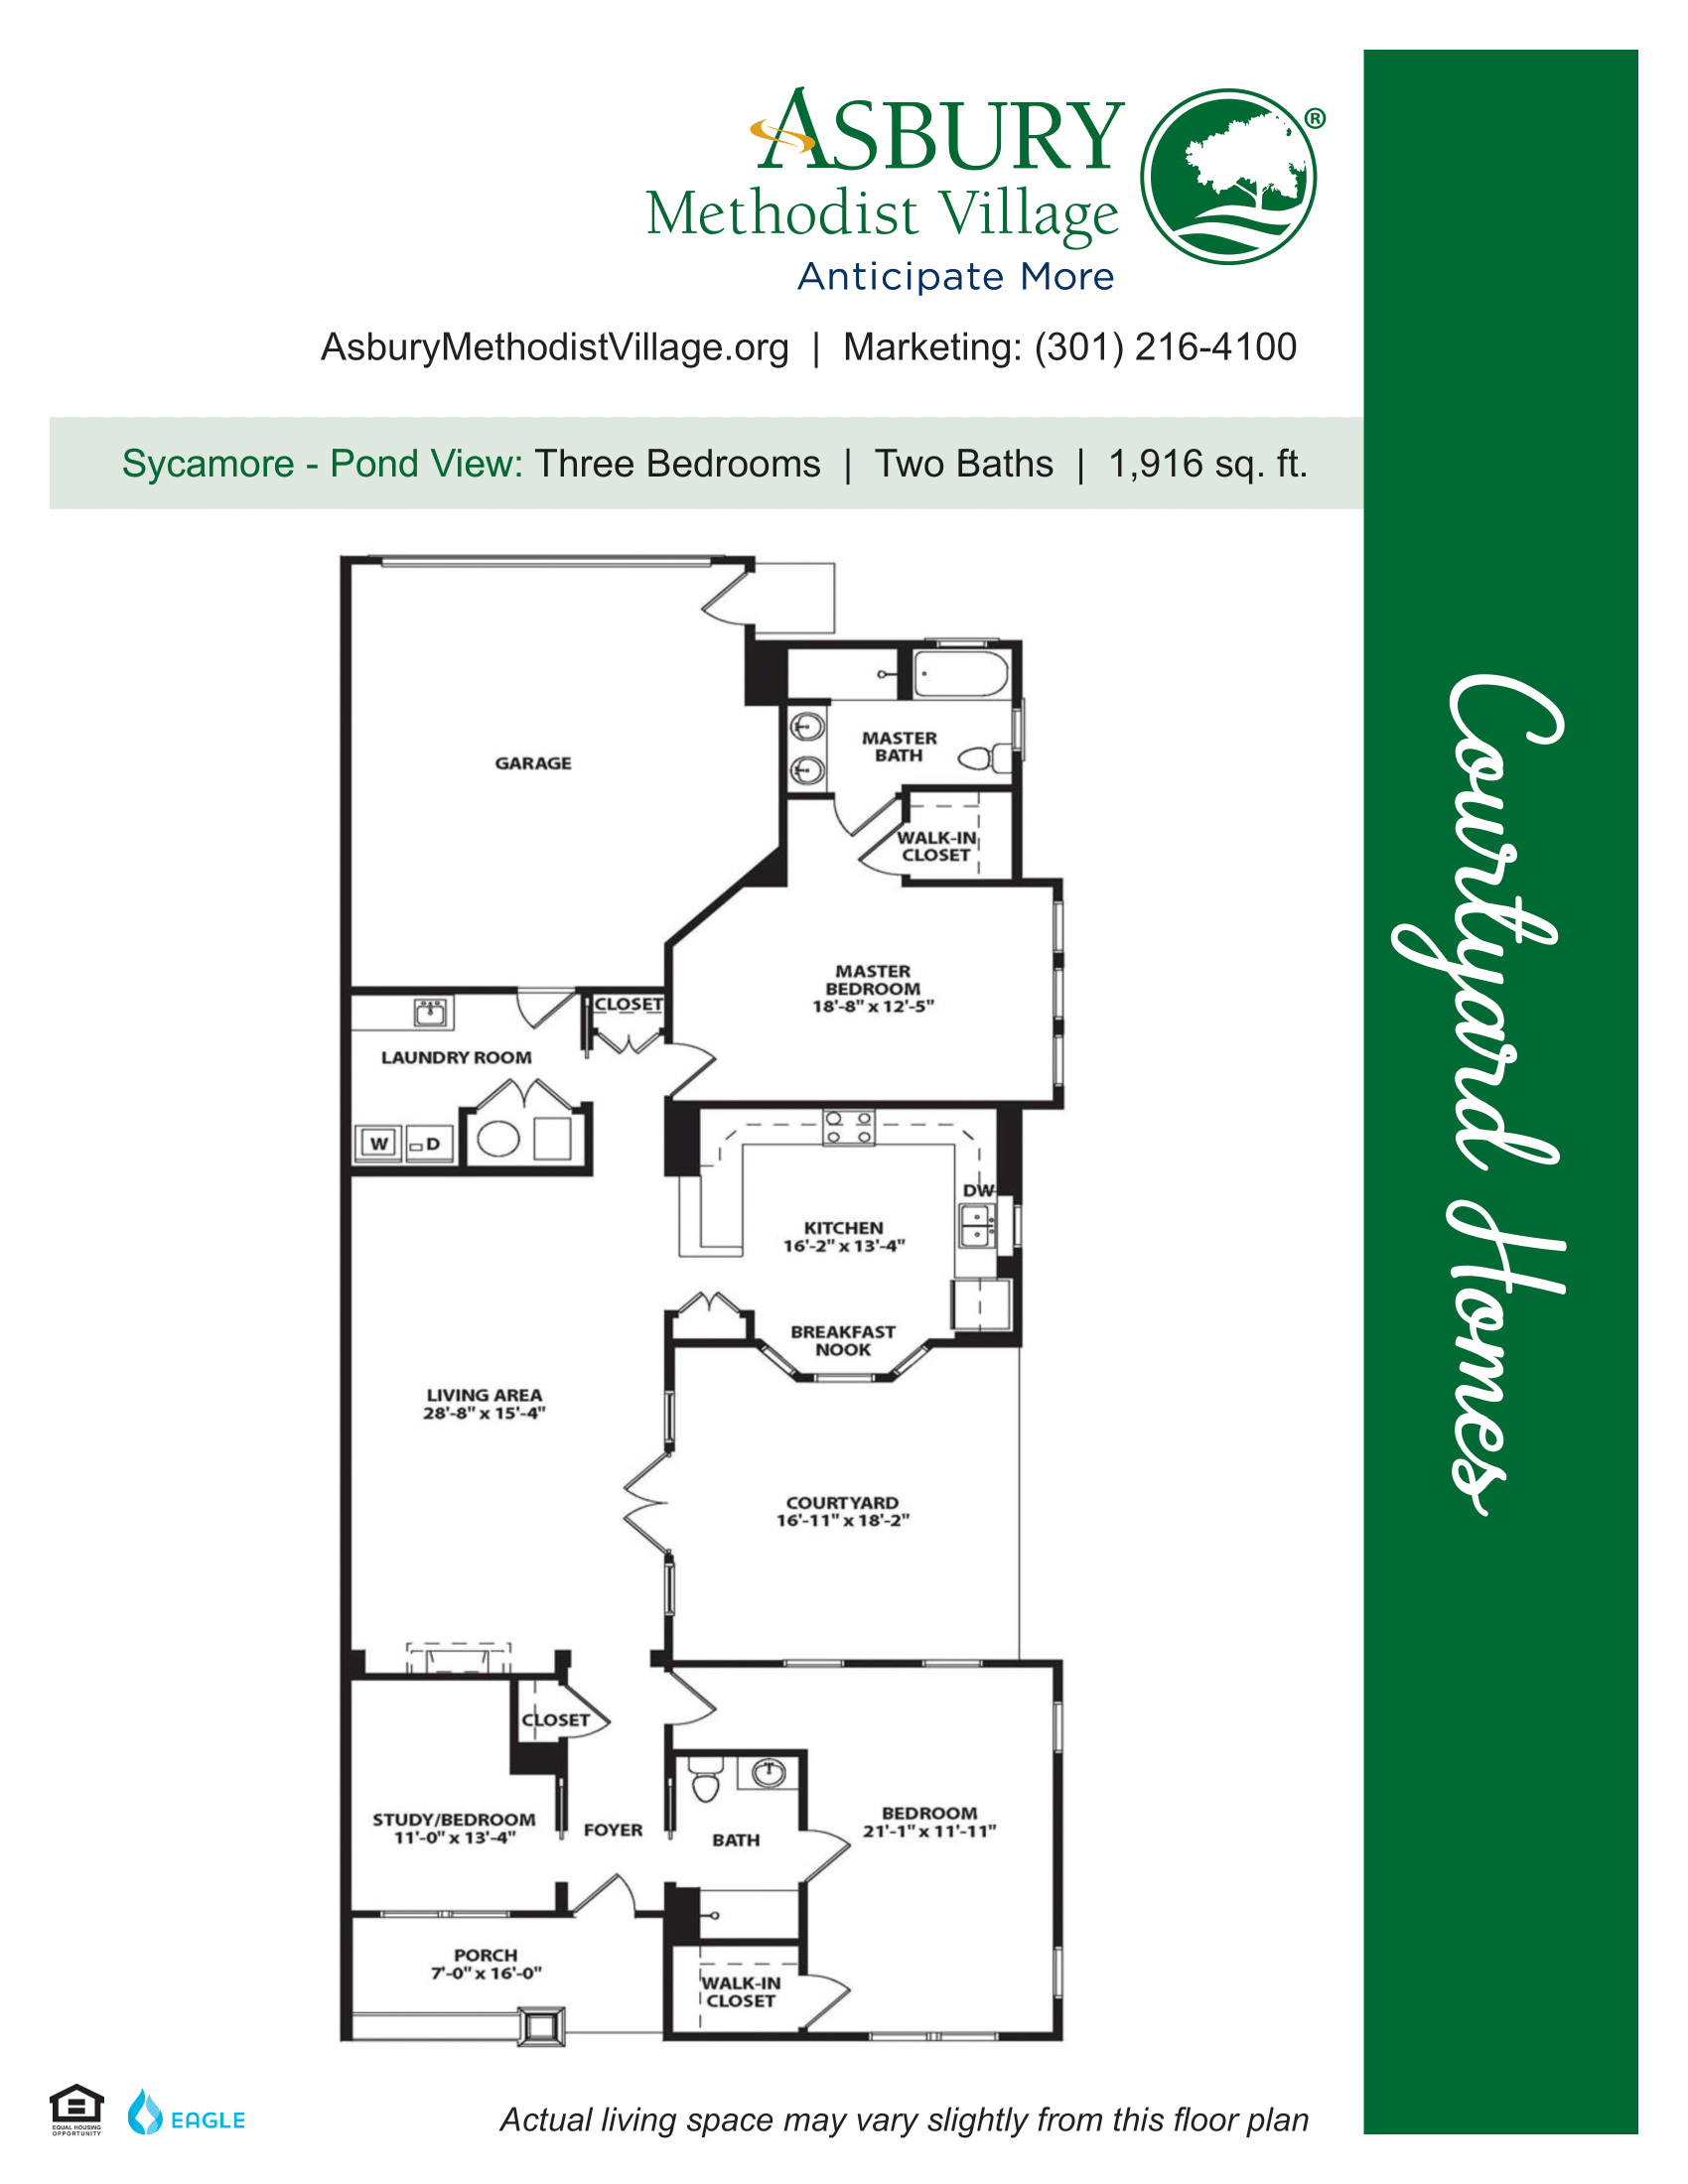
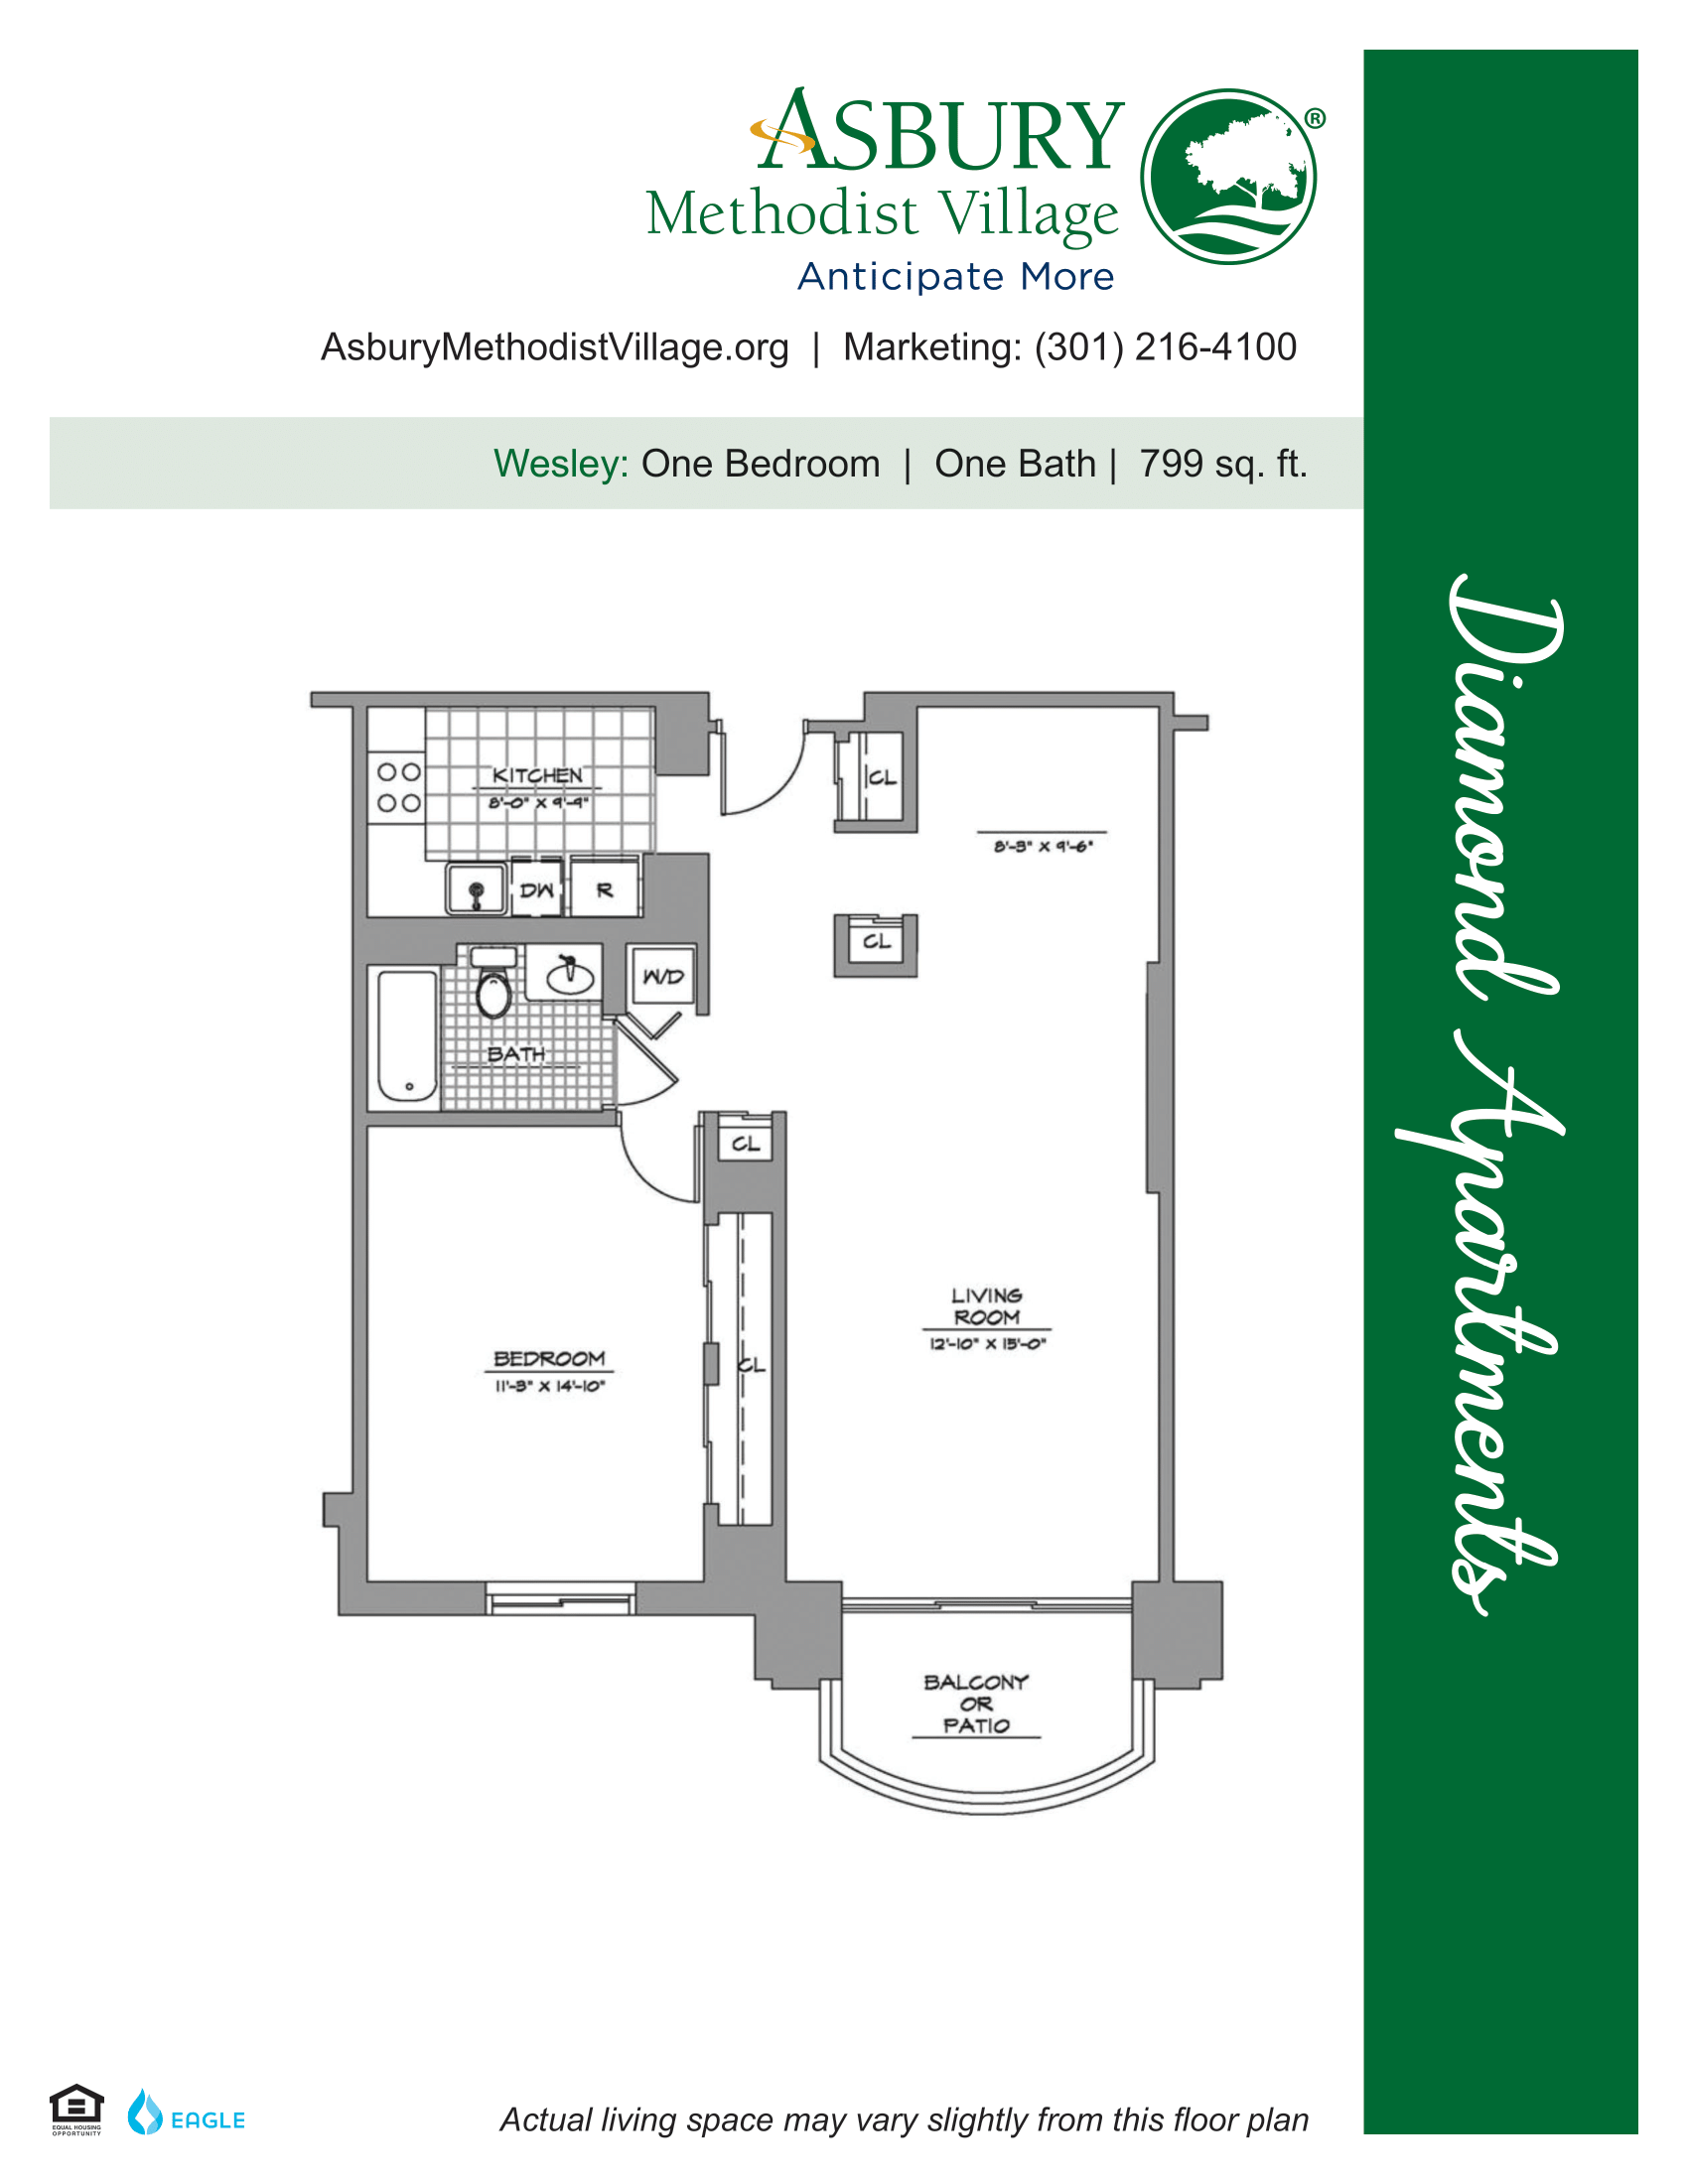
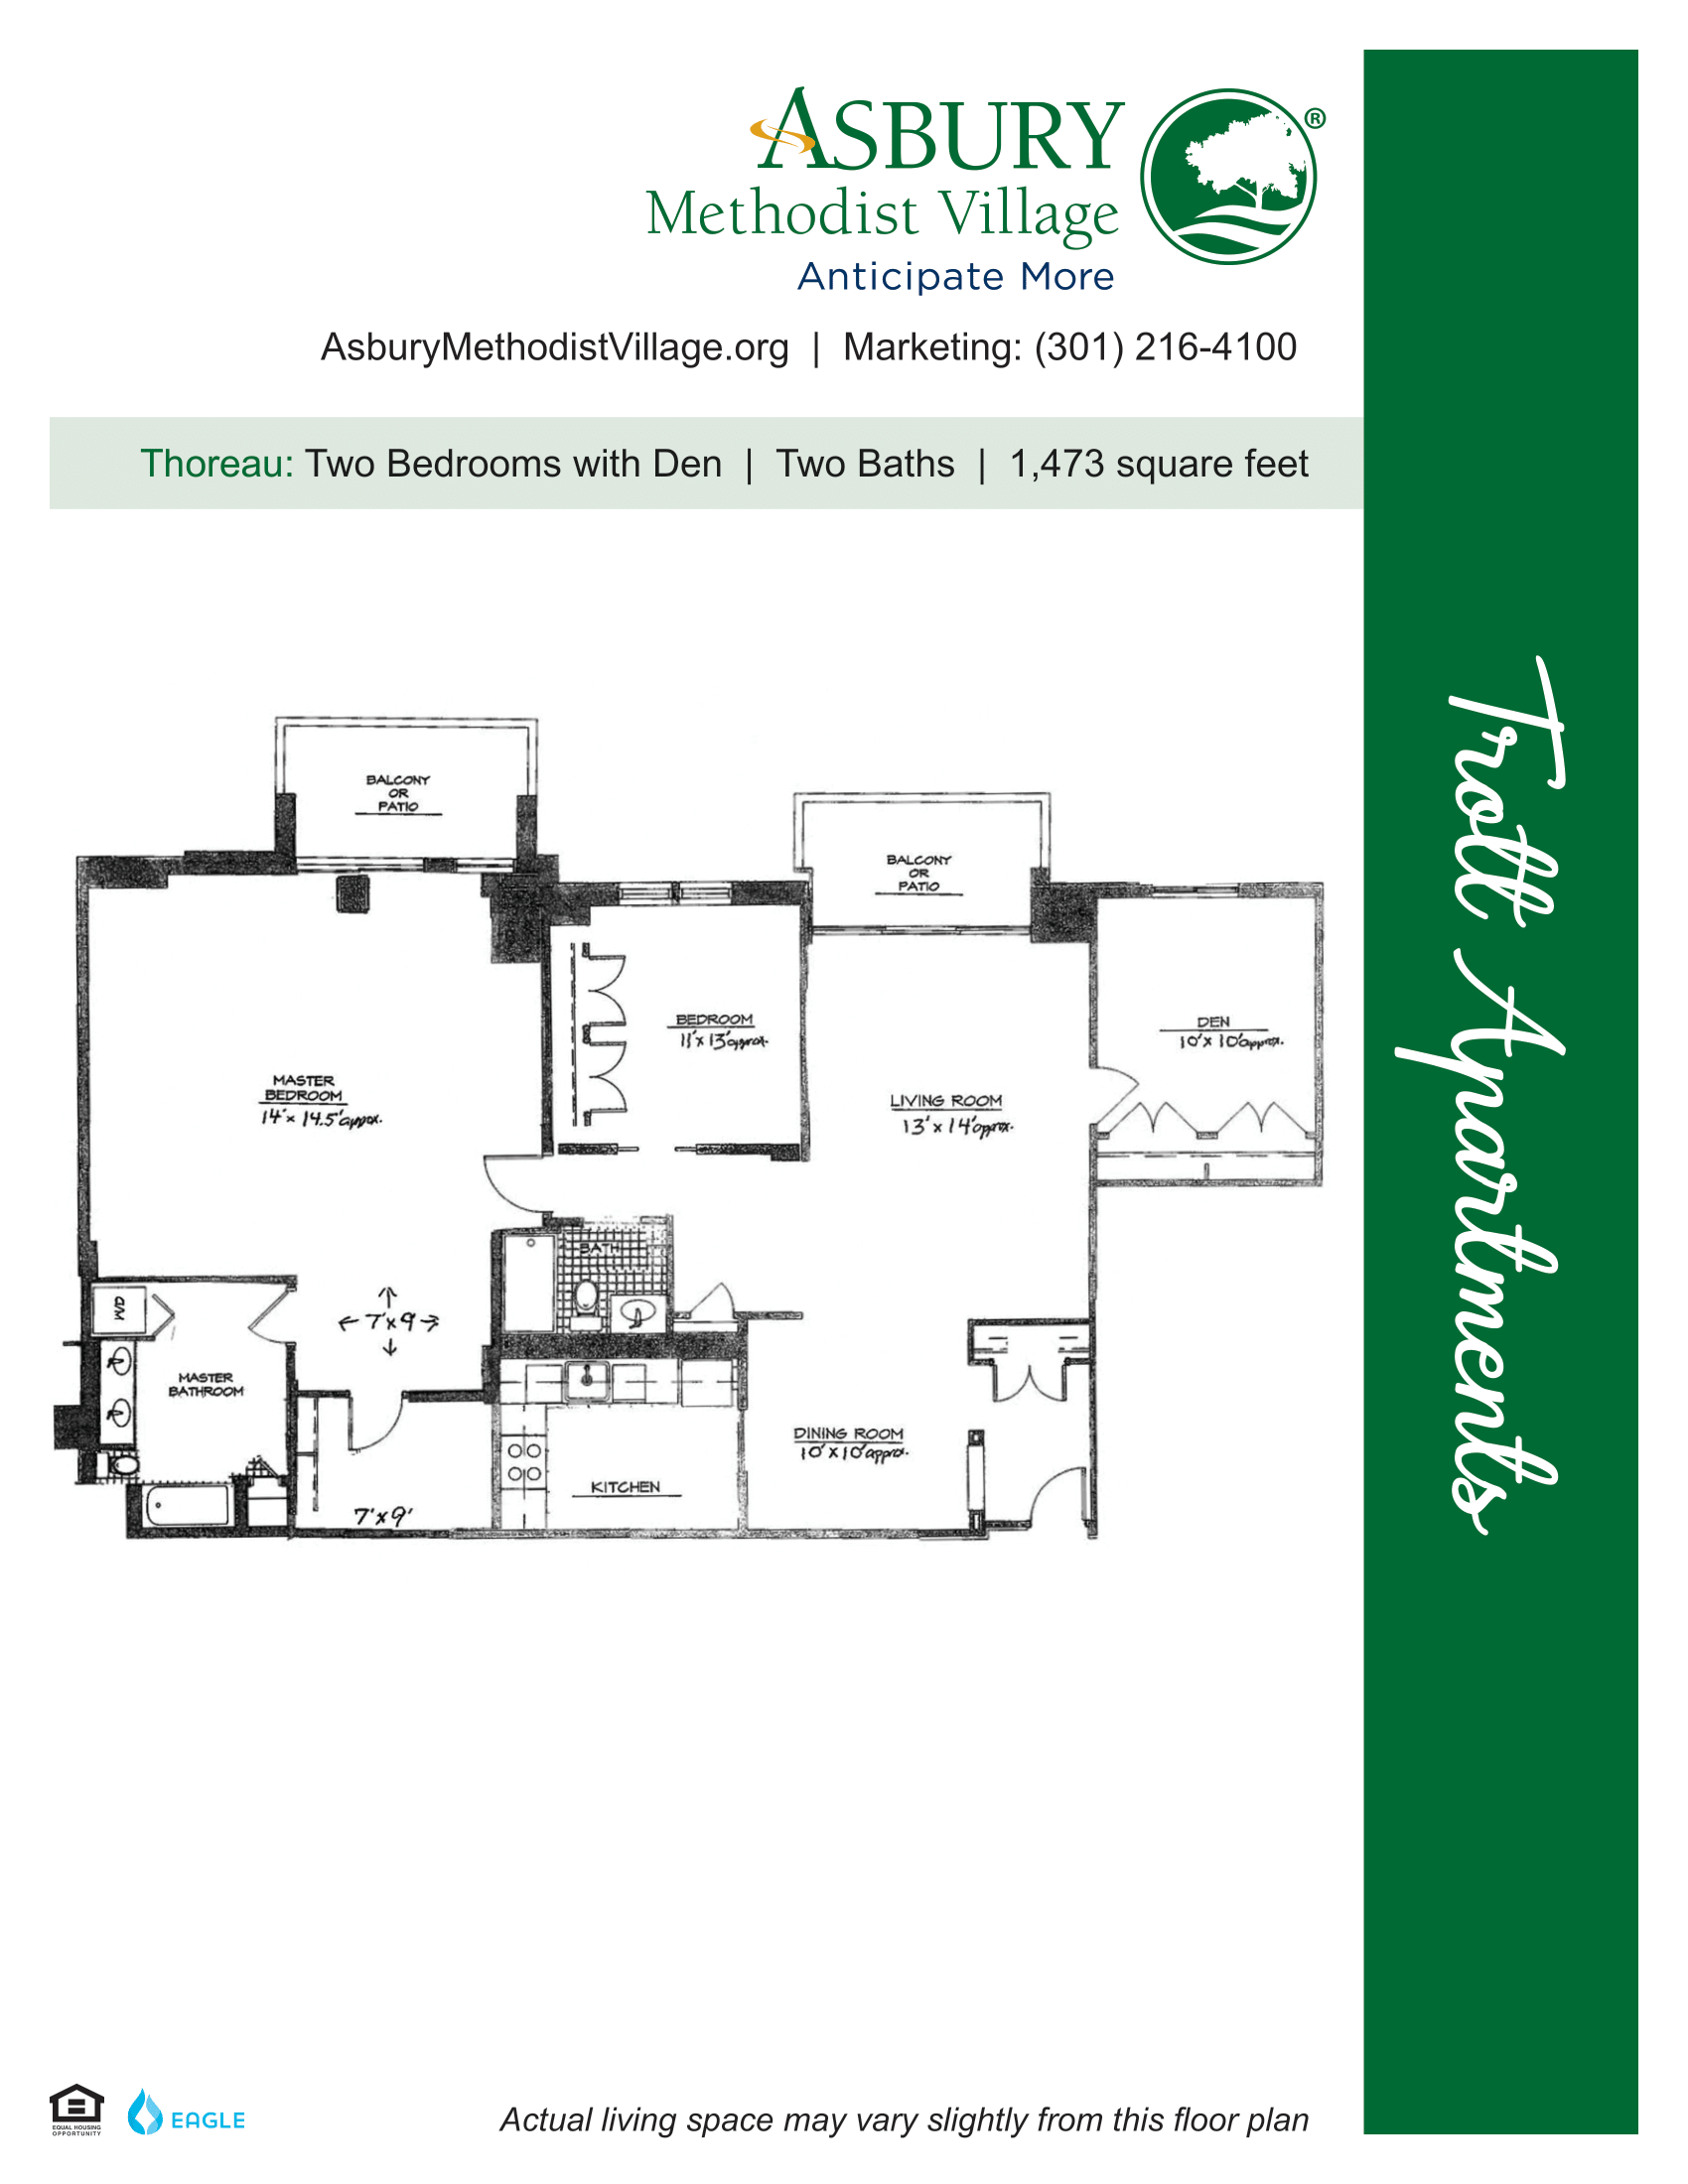
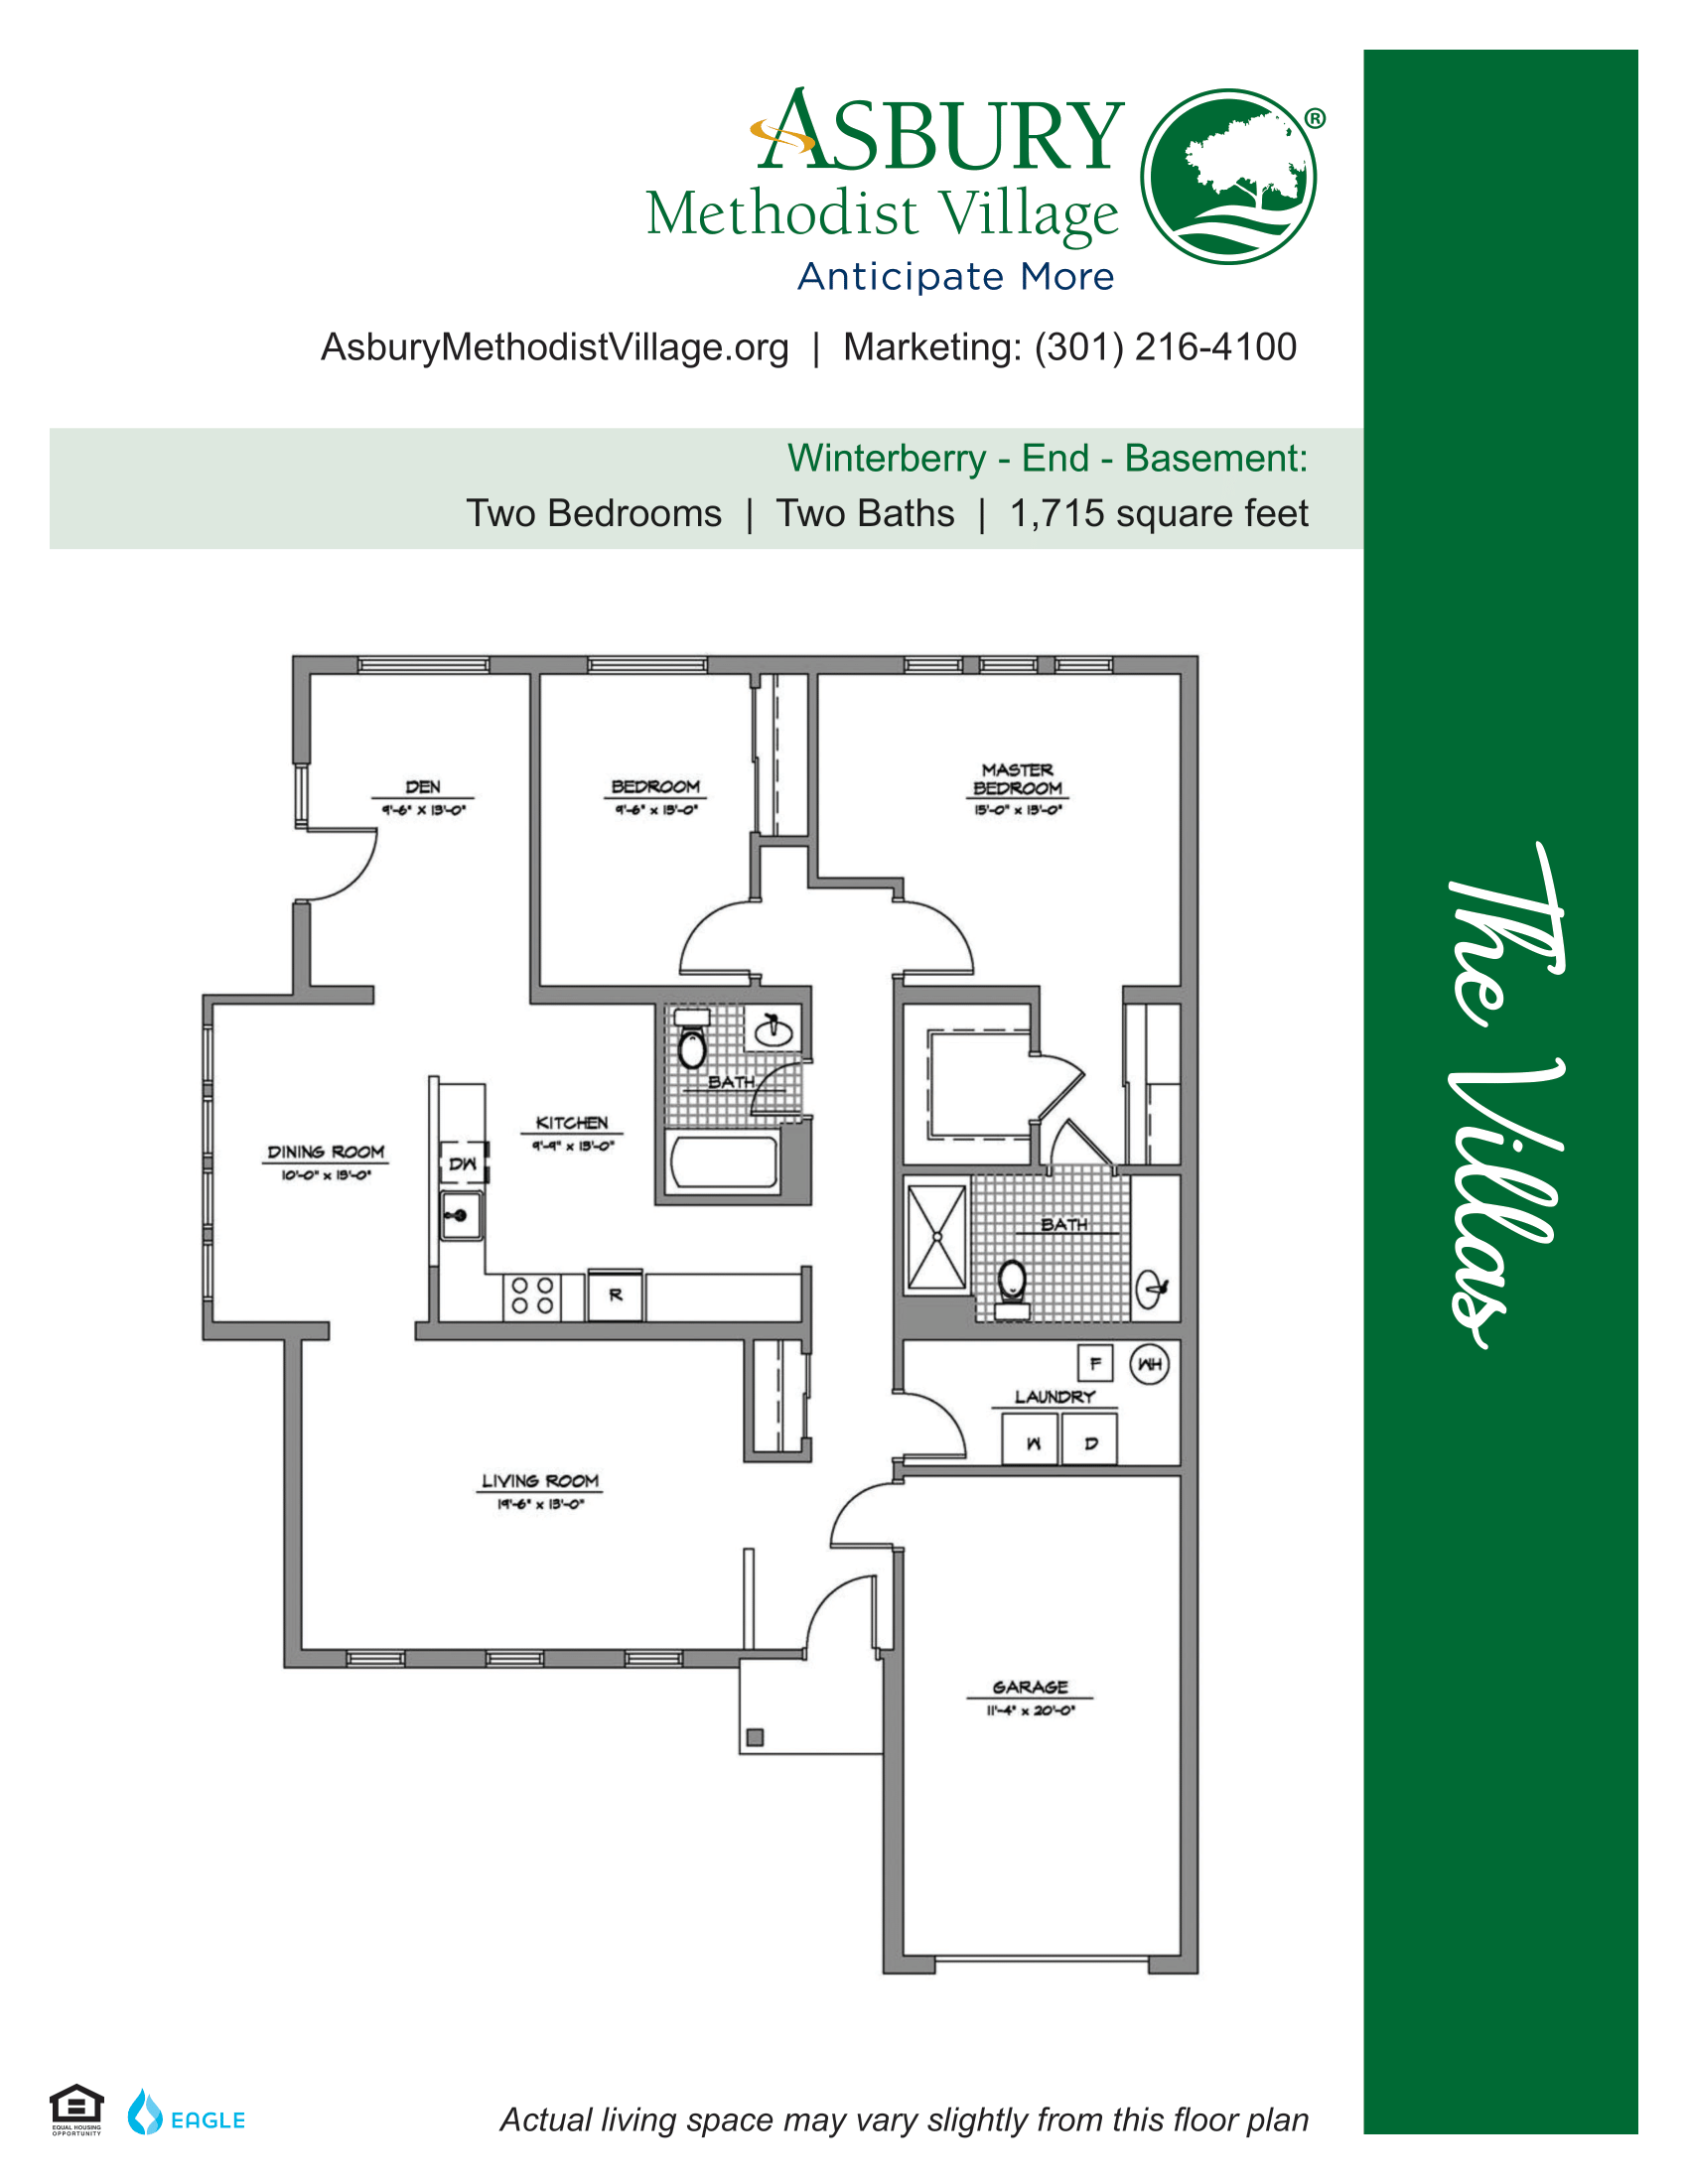
Yes — see the floorplan options available at Asbury Methodist Village on this page.
Yes, Asbury Methodist Village allows residents to bring their pets.
Asbury Methodist Village is registered as a non-profit in MD.
Asbury Methodist Village has 164 beds.
Care Cost Calculator: See Prices in Your Area
Nursing Home Data Explorer
Don’t Wait Too Long: 7 Red Flag Signs Your Parent Needs Assisted Living Now
The True Cost of Assisted Living in 2025 – And How Families Are Paying For It
Understanding Senior Living Costs: Pricing Models, Discounts & Financial Assistance


