


Compare Assisted Living around Forest Hill
Info below is compiled from the MD Dept. of Health (OHCQ), senior community websites & trusted data sources such as Walk Score & BBB.
Communities are listed from highest to lowest based on our ranking methodology.
| Hart Heritage Estates | AL MC RC | Forest Hill | 55
Facility
55
MD AVG
42
Rank
#206 / 685 | No |
31
Facility
31
MD AVG
43
Rank
#620 / 985 | Private Rooms | 15
Facility
15
MD AVG
21
Rank
#133 / 210 | A+ |
30% Female Residents — State Benchmarked 30% of residents are female, compared to the Maryland average of 69%. An unusually low female share — most assisted living facilities have 65–75% female residents. |
91% White Residents — State Benchmarked 91% of residents are reported as White, compared to the Maryland average of 81%. A higher White share than is typical for assisted living in Maryland in this dataset — compare with peer facilities for local context. |
5% African American Residents — State Benchmarked 5% of residents are reported as African American or Black, compared to the Maryland average of 13%. In line with the Maryland average for African American residents among facilities reporting this breakdown. |
5% Other Ethnicity Residents — State Benchmarked 5% of residents fall into categories other than White or African American (combined), compared to the Maryland average of 6%. This column aggregates Hispanic, Asian, multiracial, and any other labeled groups that are not classified as White or African American. Reported subgroups in this total: Asian (5%). |
7% Residents Age 65–74 — State Benchmarked 7% of residents are 65–74, compared to the Maryland average of 13%. Fewer younger seniors suggests the resident population skews older, likely requiring higher acuity care and more hands-on support. |
41% Residents Age 75–84 — State Benchmarked 41% of residents are 75–84, compared to the Maryland average of 31%. A high concentration in this mid-range bracket, where residents typically need moderate support with daily activities. |
41% Residents Age 85–94 — State Benchmarked 41% of residents are 85–94, compared to the Maryland average of 44%. This is typically the most common age bracket in assisted living — this facility is in line with the statewide norm. |
11% Residents Age 95+ — State Benchmarked 11% of residents are 95 or older, compared to the Maryland average of 16%. Most residents here have not yet reached the oldest-old bracket, suggesting a younger overall community. |
| Bel Air Assisted Living | Senior Living & Memory Care | AL HOS MC RC | Bel Air (North Hickory Avenue) | - | No |
85
Facility
85
MD AVG
43
Rank
#54 / 985 | Studio | - | - | - | - | - | - | - | - | - | - |
| Forest Hill Heights: Assisted Living & Memory Care In Bel Air | AL MC RC | Forest Hill | - | No |
48
Facility
48
MD AVG
43
Rank
#448 / 985 | Studio / 1 Bed / 2 Bed | 37
Facility
37
MD AVG
21
Rank
#15 / 210 | - | - | - | - | - | - | - | - | - |
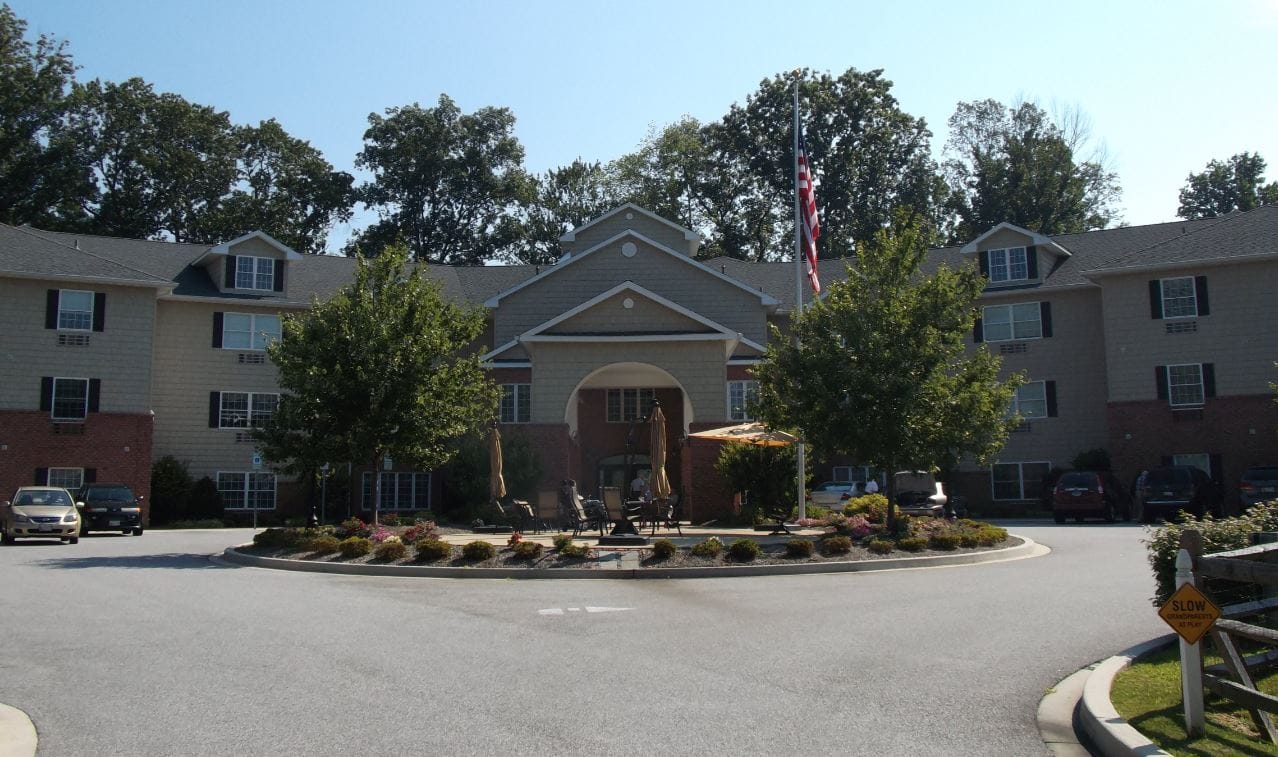
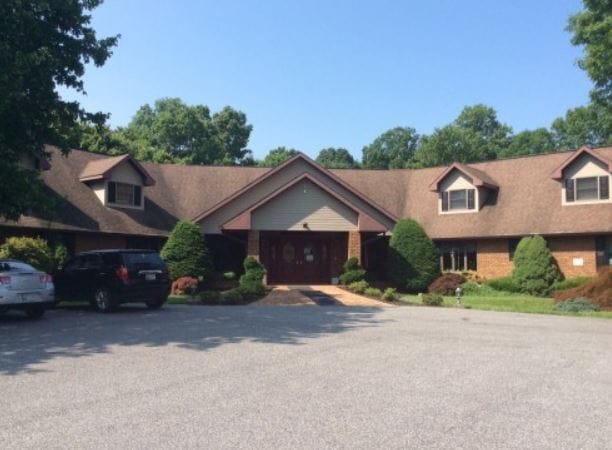
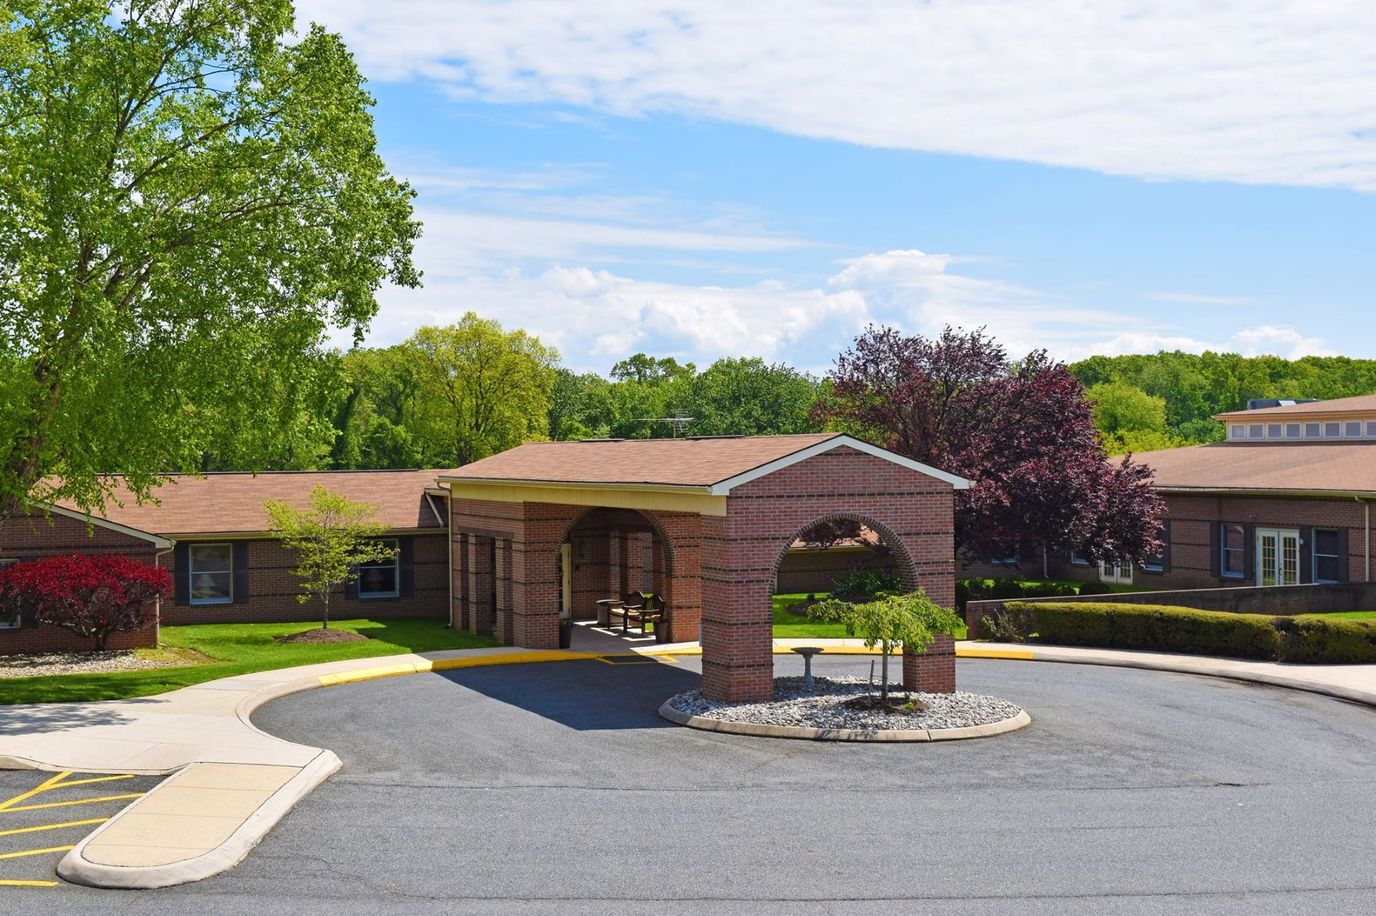
Overview of Hart Heritage Estates

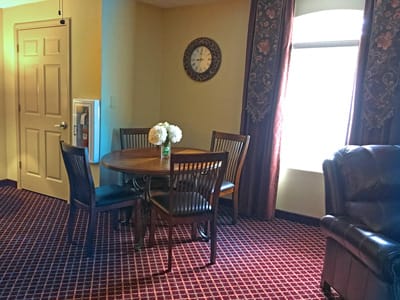
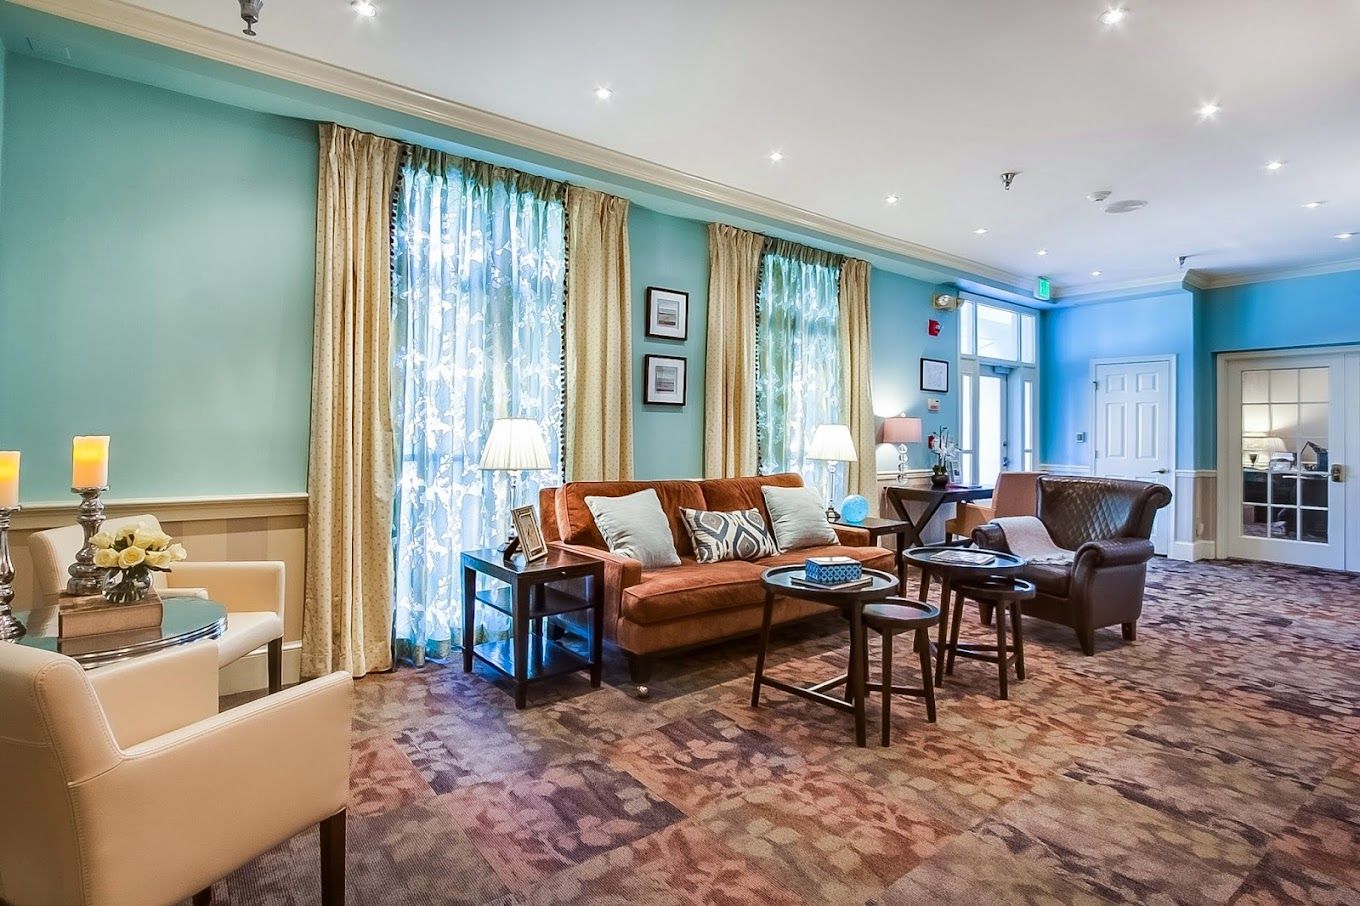
Tucked away in the tranquil neighborhood of Harford County, MD, Hart Heritage Estates is an inviting senior living community that offers assisted living, dementia care, and short-term respite care. The community features spacious and comfortable residences that provide a serene living environment for relaxing personal times or hosting families and friends. Residents are guaranteed to receive compassionate and extensive care services with a team of hardworking licensed management, Registered Nurses, and Certified Medication Technicians.
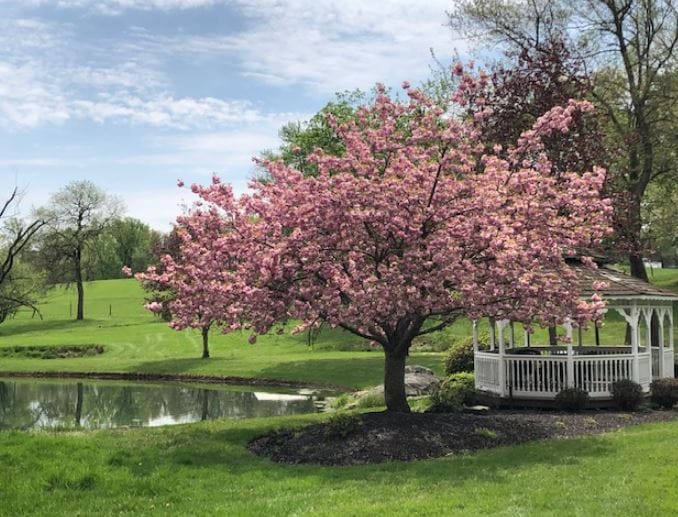
Each day is an opportunity to live well and vibrantly with the help of dedicated activity coordinators that thoroughly curates an array of engaging and stimulating activities, events, and programs. The community also offers plenty of relaxing spaces for gathering with friends and family, such as a beautiful gazebo and spacious living rooms with a large-screen TV for movie nights. A number of specialists are available to provide added services and support that residents may require, such as physical, occupational and speech therapist, a consulting psychiatrist and psychologist, podiatrist, and a dentist.
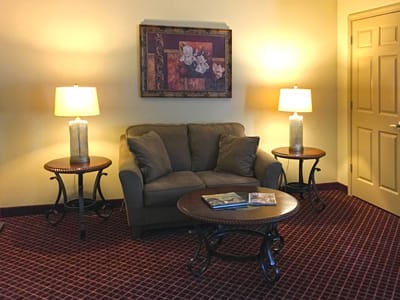
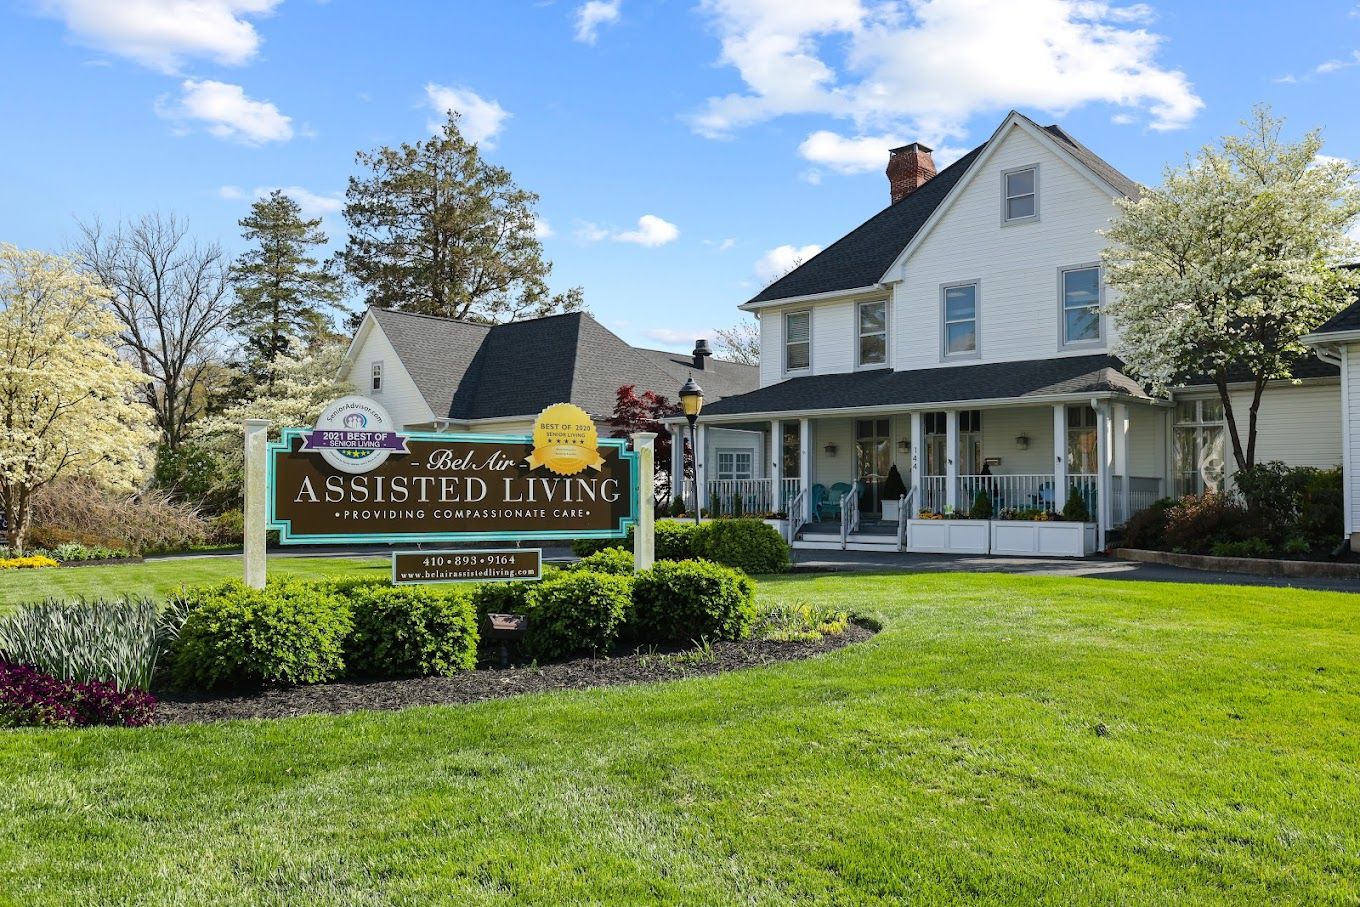
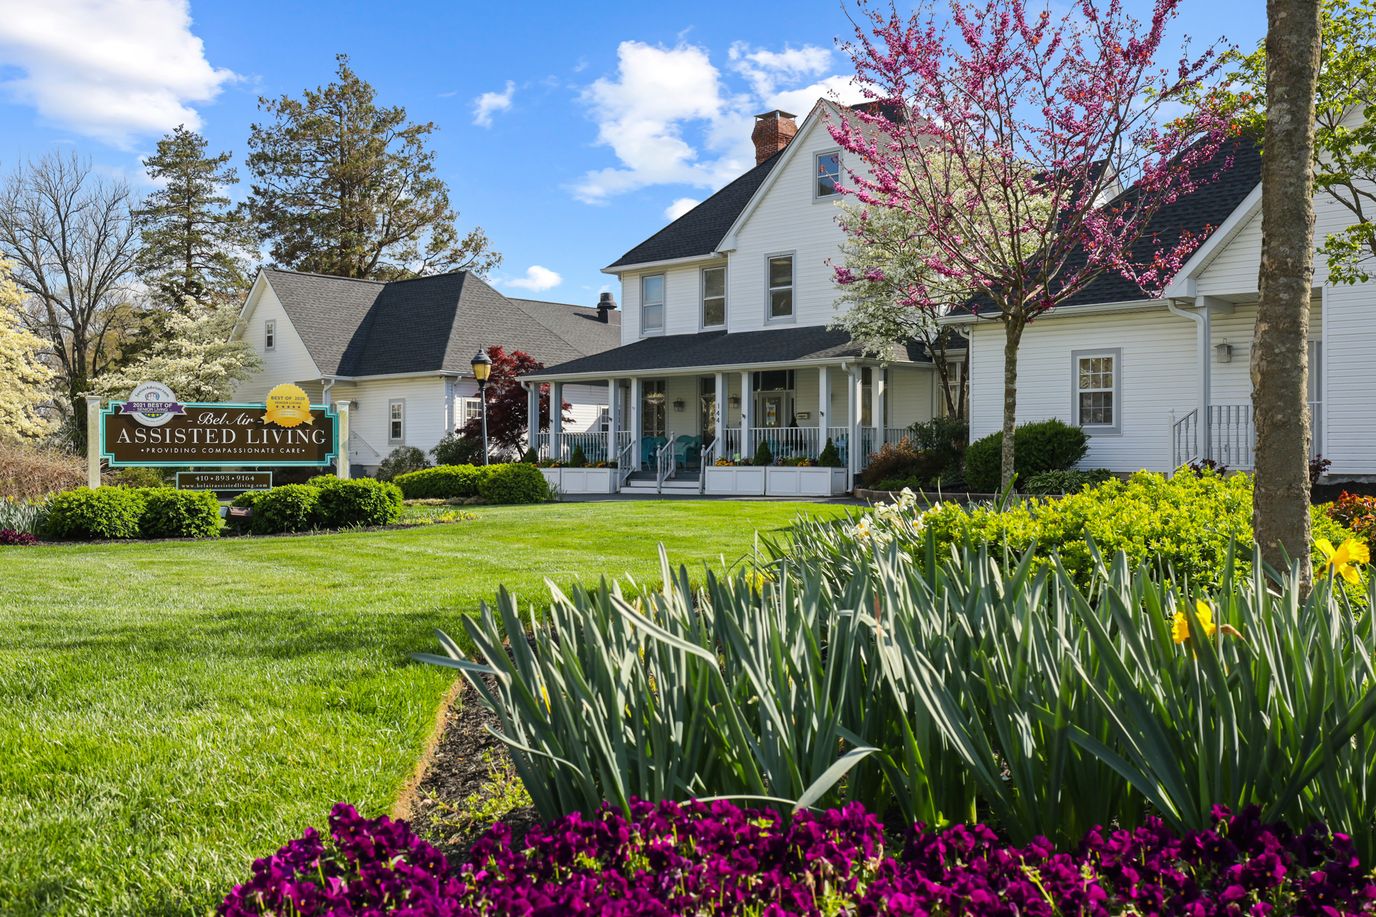
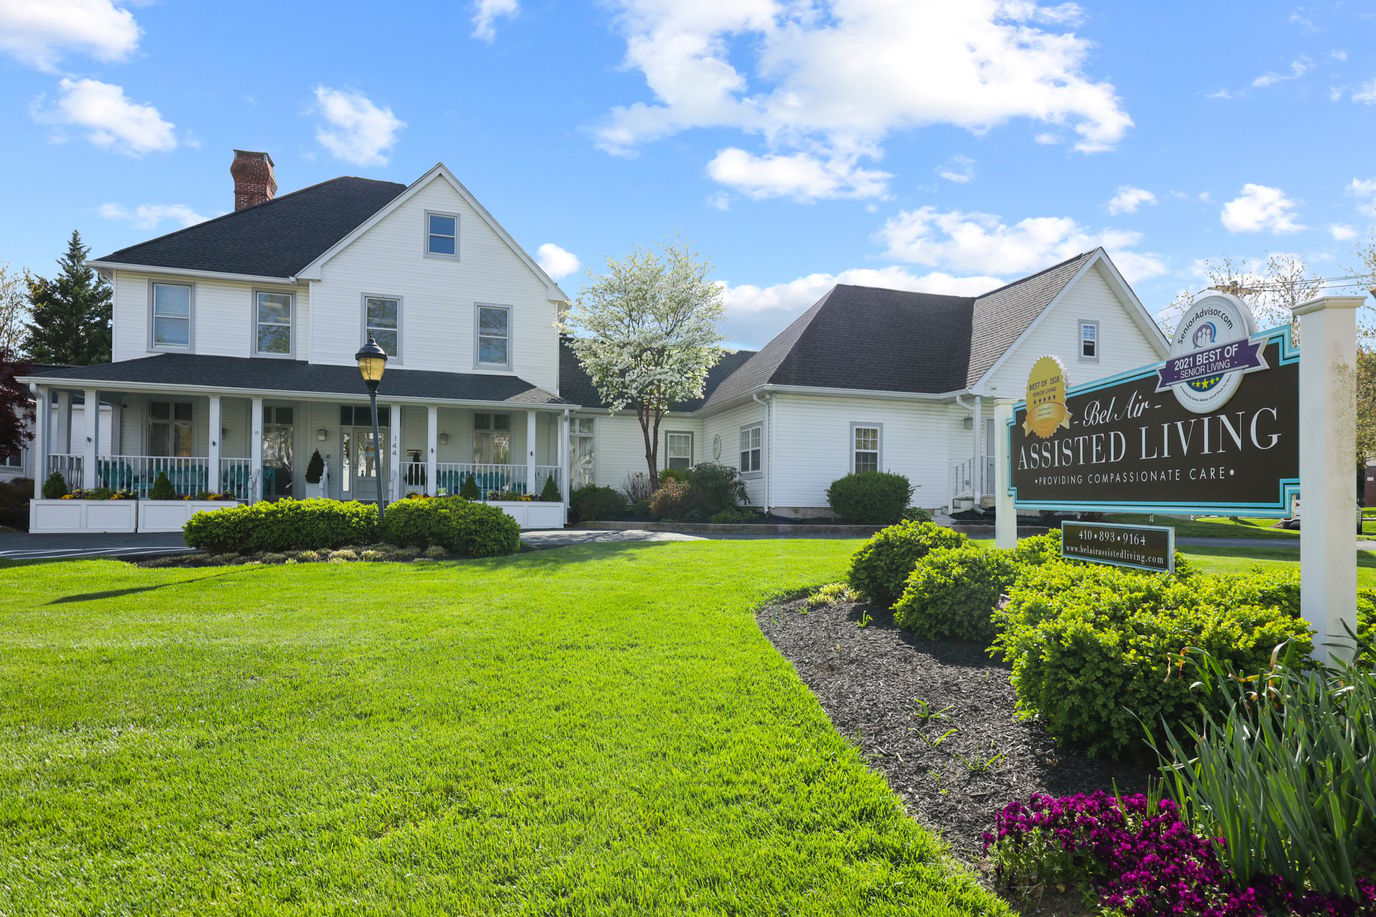
Overview of Bel Air Assisted Living | Senior Living & Memory Care

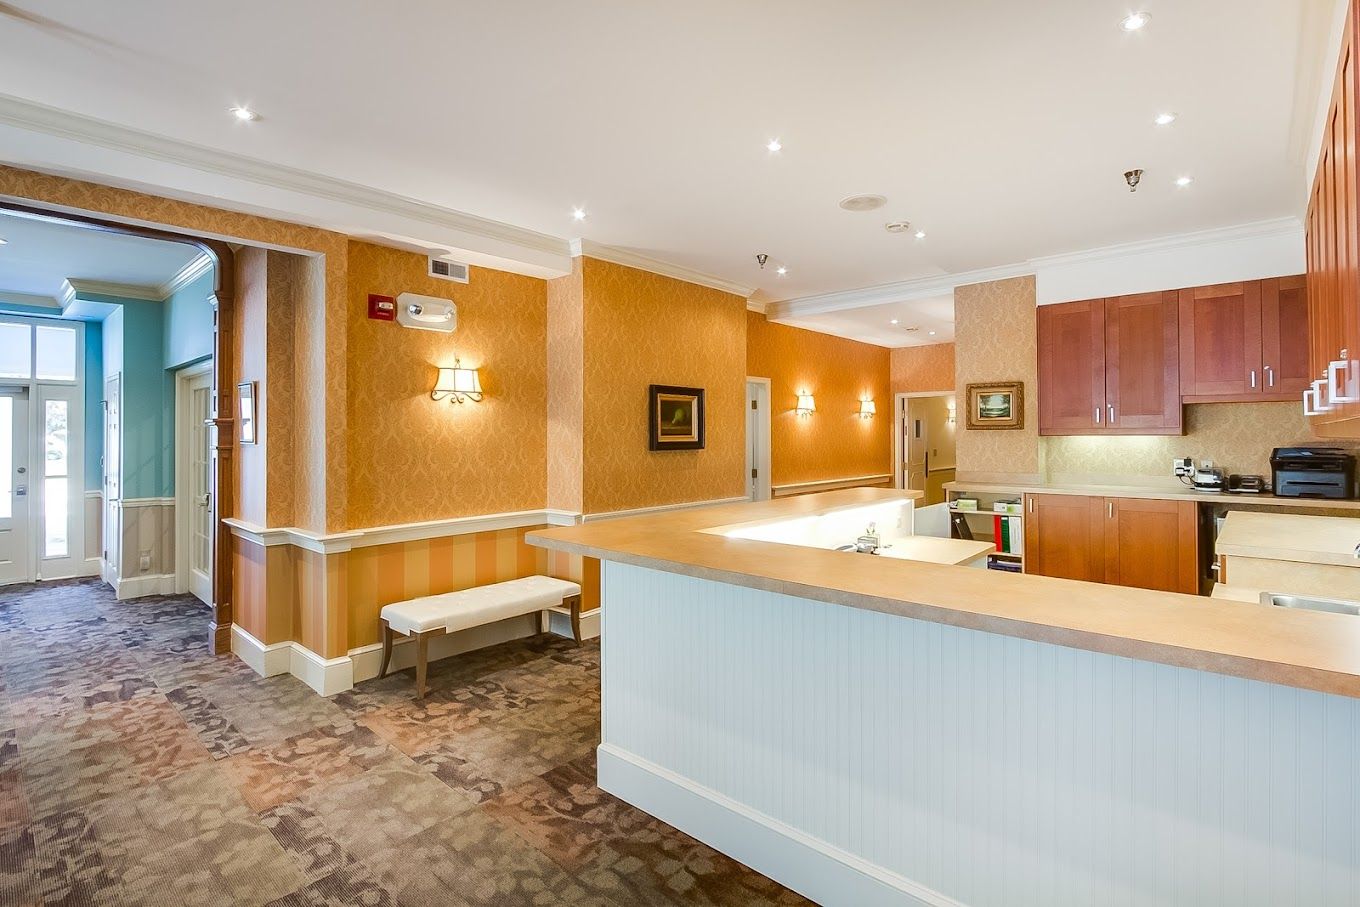
Dedicated to providing the highest quality of care, Bel Air Assisted Living in North Hickory Avenue, Bel Air, MD, is a respected senior living community offering assisted living, independent living, memory care, rehabilitation services, respite care, and hospice care. Seniors let go of their worries with a hardworking and specially trained team taking care of their daily living activities around the clock. The community also features accessible and senior-friendly accommodations and amenities to ensure a comfortable and convenient lifestyle.
Enrich retirement with stimulating activities and fun programs that are carefully curated to highlight residents’ interests and strengths. Have a delightful dining experience with healthy and delicious meals catering to nutritional needs and preferences. Bel Air Assisted Living is ideal for seniors looking to find all the care they need within one place with its comprehensive care and incredible amenities.
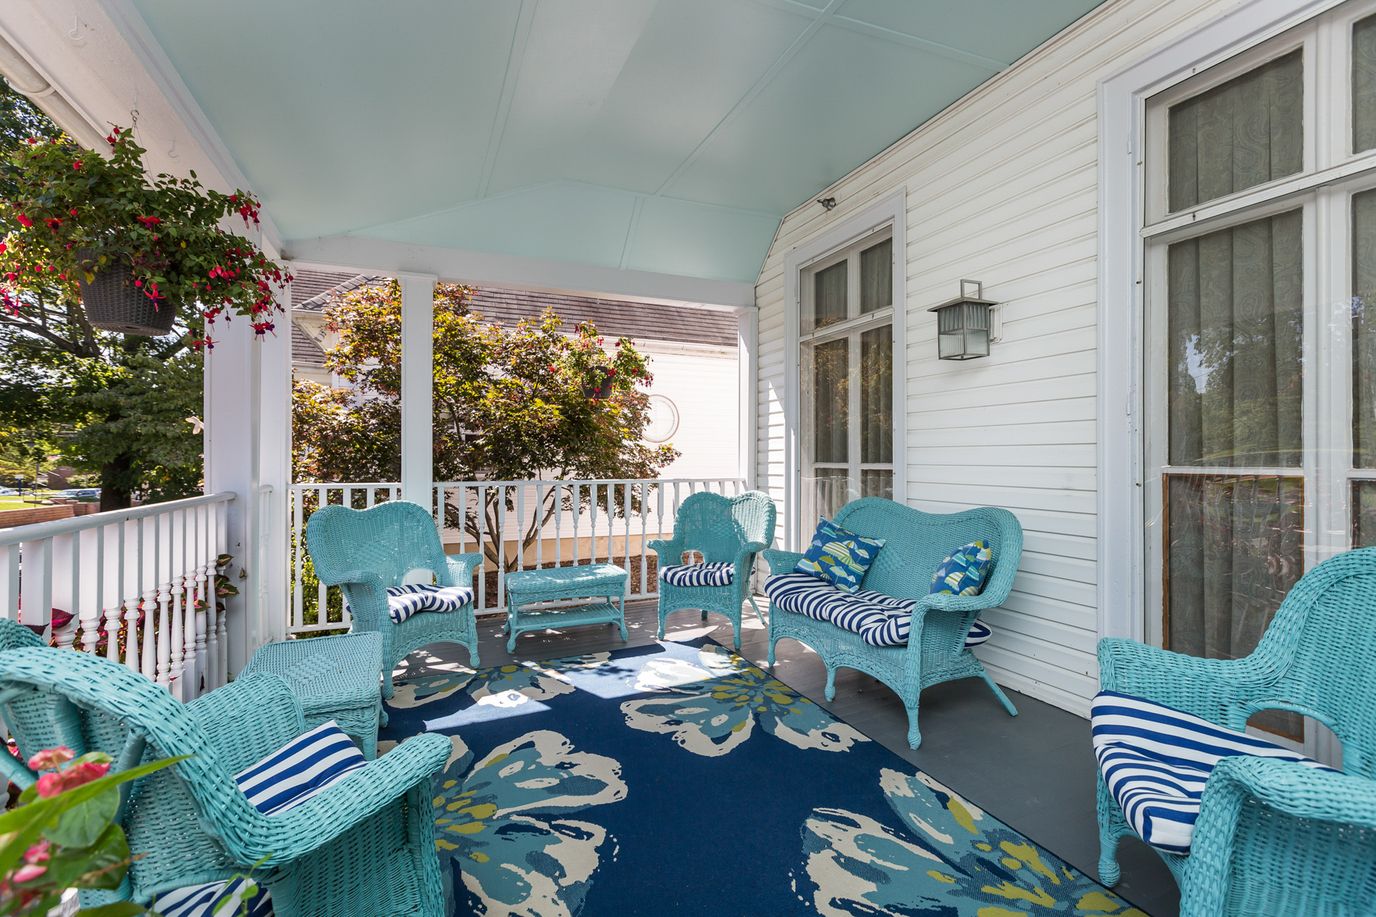
Create lasting moments with the trusted senior living community of Forest Hill Heights in Colgate Drive, Forest Hill, MD, offering assisted living, enhanced care, and memory care. With top-notch care and support 24/7, seniors can rest assured of receiving the care and support they need and prefer. Promoting a vibrant and welcoming environment, the community encourages seniors to mingle with friends and make every moment count.
With plenty of things to experience, the community empowers residents to keep learning and lead a meaningful life. Meals do not only satisfy dietary needs but also foster comfort for residents to enjoy satisfactory dining. Forest Hill strives to provide a safe place for seniors to experience a wondrous retirement with its incredible amenities and genuine care.
Ranking Methodology
How we rank these assisted living communities
Every community above is evaluated across six weighted categories using public data including state inspection records, review platforms, BBB profiles, and operator-published materials.
Weighting overview
- 35%Resident Experience
- 25%Regulatory
- 15%Visual Media
- 10%Website
- 10%Stability
- 5%Environment
01
Resident & Family Experience 35%
The single largest share of every ranking. Aggregated review sentiment and volume from major platforms — the closest signal to real resident experience.
- Includes
- Review Sentiment
- Review Volume
02
Regulatory & Safety Record 25%
State inspection records, citations, and complaint visits. We weight per-inspection rates more heavily than raw counts.
- Includes
- State Inspections
- Citations/Inspection
- % Inspections w/ Citations
- Complaint Visits
- Accreditations
- BBB Rating
03
Visual Media & Transparency 15%
Communities that publish high-quality visuals give families a real preview. No photos or tours = a negative transparency signal.
- Includes
- Video Tours
- Virtual Walkthroughs
- Photo Quantity
- Photo Quality
04
Website & Operator Transparency 10%
Site quality and whether the operator publishes basic accountability information — staff names, contact details, ownership.
- Includes
- Website Content
- Mobile Usability
- Staff Info Available
- Owner Info Available
05
Community Stability 10%
Operational signals indicating whether a community is well-run and meeting demand.
- Includes
- Occupancy Rate
- Bed Options
06
Environment & Pricing 5%
Walkability and pricing transparency. Walk Score is weighted higher for Independent Living than for Memory Care, where most residents do not leave unaccompanied.
- Includes
- Walk Score
- Pricing Transparency
Who we are
Your Senior Care Partner, Every Step of the Way
We help families find affordable senior communities and unlock same day discounts, Medicaid, and Medicare options tailored to your needs.
Contact us Today
Frequently Asked Questions about Assisted Living in Forest Hill, MD
What is the average cost of assisted living in Forest Hill, MD?
The average monthly cost of assisted living in Forest Hill, MD is approximately $5,300. Actual rates vary by community, level of care, and floorplan.
What is the price range for assisted living in Forest Hill, MD?
Assisted living in Forest Hill, MD typically ranges from $4,800–$7,400 per month, depending on the community, room type, and care needs.
What is the typical staff-to-resident ratio at assisted living facilities in Forest Hill, MD?
Assisted living facilities in Forest Hill, MD typically operate with a staff-to-resident ratio in the range of 1:6 to 1:12.
What's the difference between assisted living and memory care in Maryland?
Assisted living in Maryland supports residents with daily activities (bathing, dressing, medication management) while preserving independence. Memory care is a specialized form of assisted living for residents living with Alzheimer's or dementia, and adds 24/7 secured environments, dementia-trained staff, and structured routines designed to reduce confusion and wandering.
What's the difference between assisted living and a nursing home in Maryland?
Assisted living in Maryland is a residential model focused on housing, hospitality, and help with daily activities. Nursing homes (skilled nursing facilities) provide 24/7 medical care from licensed nurses for residents with significant health needs, and are regulated more strictly under both state and federal CMS rules.
Does Maryland Medicaid cover assisted living?
Maryland Medicaid does not directly pay room-and-board for assisted living, but most states (including Maryland) offer Home and Community-Based Services (HCBS) waivers that can offset the cost of care services delivered inside a licensed community. Eligibility, waitlists, and covered services vary — check directly with the state Medicaid agency.
What is assisted living?
Assisted living combines private or semi-private apartments with help on activities of daily living (meals, bathing, dressing, medication management) and a social calendar — for residents who need some support but do not need 24/7 medical care.
Updated on
