


Compare Assisted Living around Rockville
Info below is compiled from the MD Dept. of Health (OHCQ), senior community websites & trusted data sources such as Walk Score & BBB.
Communities are listed from highest to lowest based on our ranking methodology.
| Sunrise of Rockville | AL HOS MC | Rockville (Baltimore Road) | 89
Facility
89
MD AVG
42
Rank
#150 / 685 | Yes |
89
Facility
89
MD AVG
43
Rank
#32 / 985 | Studio / 1 Bed / 2 Bed | 45
Facility
45
MD AVG
20
Rank
#3 / 210 |
23% Male Residents — State Benchmarked 23% of residents are male, compared to the Maryland average of 31%. This facility caters to a majority female resident pool (77% female), consistent with the broader assisted living trend where women significantly outnumber men. |
77% Female Residents — State Benchmarked 77% of residents are female, compared to the Maryland average of 69%. Women comprise the large majority, consistent with national assisted living demographics where women live longer and enter care facilities at higher rates. |
87% White Residents — State Benchmarked 87% of residents are reported as White, compared to the Maryland average of 81%. Close to the average for this category among assisted living facilities in Maryland with reported race/ethnicity data. |
2% African American Residents — State Benchmarked 2% of residents are reported as African American or Black, compared to the Maryland average of 13%. A lower African American share than is typical in Maryland; local markets still vary widely. |
11% Other Ethnicity Residents — State Benchmarked 11% of residents fall into categories other than White or African American (combined), compared to the Maryland average of 6%. This column aggregates Hispanic, Asian, multiracial, and any other labeled groups that are not classified as White or African American. Reported subgroups in this total: Mixed Race (6%), Hispanic (3%), Asian (2%). |
3% Residents Age 65–74 — State Benchmarked 3% of residents are 65–74, compared to the Maryland average of 13%. Fewer younger seniors suggests the resident population skews older, likely requiring higher acuity care and more hands-on support. |
31% Residents Age 75–84 — State Benchmarked 31% of residents are 75–84, compared to the Maryland average of 31%. This is the second most common age bracket in assisted living, representing residents with moderate care needs. |
56% Residents Age 85–94 — State Benchmarked 56% of residents are 85–94, compared to the Maryland average of 44%. A high concentration of very elderly residents signals a higher-acuity facility with experience caring for advanced age-related needs. |
10% Residents Age 95+ — State Benchmarked 10% of residents are 95 or older, compared to the Maryland average of 16%. Most residents here have not yet reached the oldest-old bracket, suggesting a younger overall community. |
| Ingleside at King Farm | AL IL MC NH SNF | Rockville (King Farm) | 45
Facility
45
MD AVG
42
Rank
#219 / 685 | Yes |
73
Facility
73
MD AVG
43
Rank
#152 / 985 | 1 Bed / 2 Bed | - | - | - | - | - | - | - | - | - | - |
| Revitz House | AL HC IL MC NH SNF | Rockville | 558
Facility
558
MD AVG
42
Rank
#1 / 685 | Yes |
81
Facility
81
MD AVG
43
Rank
#86 / 985 | 1 Bed | - | - | - | - | - | - | - | - | - | - |
| Landow House | AL HC IL MC NH SNF | Rockville (Rollins Park) | 98
Facility
98
MD AVG
42
Rank
#126 / 685 | Yes |
59
Facility
59
MD AVG
43
Rank
#327 / 985 | 1 Bed / 2 Bed | 31
Facility
31
MD AVG
20
Rank
#37 / 210 |
31% Male Residents — State Benchmarked 31% of residents are male, compared to the Maryland average of 31%. This facility caters to a majority female resident pool (69% female), consistent with the broader assisted living trend where women significantly outnumber men. |
69% Female Residents — State Benchmarked 69% of residents are female, compared to the Maryland average of 69%. Women comprise the large majority, consistent with national assisted living demographics where women live longer and enter care facilities at higher rates. |
99% White Residents — State Benchmarked 99% of residents are reported as White, compared to the Maryland average of 81%. A higher White share than is typical for assisted living in Maryland in this dataset — compare with peer facilities for local context. |
0% African American Residents — State Benchmarked 0% of residents are reported as African American or Black, compared to the Maryland average of 13%. A lower African American share than is typical in Maryland; local markets still vary widely. |
1% Other Ethnicity Residents — State Benchmarked 1% of residents fall into categories other than White or African American (combined), compared to the Maryland average of 6%. This column aggregates Hispanic, Asian, multiracial, and any other labeled groups that are not classified as White or African American. Reported subgroups in this total: Asian (1%). |
7% Residents Age 65–74 — State Benchmarked 7% of residents are 65–74, compared to the Maryland average of 13%. Fewer younger seniors suggests the resident population skews older, likely requiring higher acuity care and more hands-on support. |
20% Residents Age 75–84 — State Benchmarked 20% of residents are 75–84, compared to the Maryland average of 31%. Below the state norm — the resident mix may skew either younger or older than this typical middle bracket. |
49% Residents Age 85–94 — State Benchmarked 49% of residents are 85–94, compared to the Maryland average of 44%. A high concentration of very elderly residents signals a higher-acuity facility with experience caring for advanced age-related needs. |
24% Residents Age 95+ — State Benchmarked 24% of residents are 95 or older, compared to the Maryland average of 16%. A high proportion of the oldest-old suggests strong end-of-life care experience and very-high-acuity capabilities. |
| Brightview West End | AL IL MC | Rockville | 98
Facility
98
MD AVG
42
Rank
#126 / 685 | Yes |
89
Facility
89
MD AVG
43
Rank
#32 / 985 | Studio / 1 Bed / 2 Bed | 8
Facility
8
MD AVG
20
Rank
#163 / 210 |
32% Male Residents — State Benchmarked 32% of residents are male, compared to the Maryland average of 31%. This facility caters to a majority female resident pool (68% female), consistent with the broader assisted living trend where women significantly outnumber men. |
68% Female Residents — State Benchmarked 68% of residents are female, compared to the Maryland average of 69%. Women comprise the large majority, consistent with national assisted living demographics where women live longer and enter care facilities at higher rates. |
84% White Residents — State Benchmarked 84% of residents are reported as White, compared to the Maryland average of 81%. Close to the average for this category among assisted living facilities in Maryland with reported race/ethnicity data. |
4% African American Residents — State Benchmarked 4% of residents are reported as African American or Black, compared to the Maryland average of 13%. A lower African American share than is typical in Maryland; local markets still vary widely. |
12% Other Ethnicity Residents — State Benchmarked 12% of residents fall into categories other than White or African American (combined), compared to the Maryland average of 6%. This column aggregates Hispanic, Asian, multiracial, and any other labeled groups that are not classified as White or African American. Reported subgroups in this total: Other (5%), Asian (4%), Mixed Race (4%). |
14% Residents Age 65–74 — State Benchmarked 14% of residents are 65–74, compared to the Maryland average of 13%. In line with the statewide profile for this youngest senior bracket in assisted living. |
37% Residents Age 75–84 — State Benchmarked 37% of residents are 75–84, compared to the Maryland average of 31%. A high concentration in this mid-range bracket, where residents typically need moderate support with daily activities. |
33% Residents Age 85–94 — State Benchmarked 33% of residents are 85–94, compared to the Maryland average of 44%. The population here skews younger than the statewide norm, which may indicate a more active, lower-acuity community. |
16% Residents Age 95+ — State Benchmarked 16% of residents are 95 or older, compared to the Maryland average of 16%. In line with the statewide profile for the oldest resident bracket. |
| Brightview Fallsgrove | AL MC | Rockville (Glenora Hills) | 100
Facility
100
MD AVG
42
Rank
#109 / 685 | No |
34
Facility
34
MD AVG
43
Rank
#590 / 985 | Studio / 1 Bed | 13
Facility
13
MD AVG
20
Rank
#141 / 210 |
19% Male Residents — State Benchmarked 19% of residents are male, compared to the Maryland average of 31%. This facility caters to a majority female resident pool (81% female), consistent with the broader assisted living trend where women significantly outnumber men. |
81% Female Residents — State Benchmarked 81% of residents are female, compared to the Maryland average of 69%. Women comprise the large majority, consistent with national assisted living demographics where women live longer and enter care facilities at higher rates. |
91% White Residents — State Benchmarked 91% of residents are reported as White, compared to the Maryland average of 81%. A higher White share than is typical for assisted living in Maryland in this dataset — compare with peer facilities for local context. |
2% African American Residents — State Benchmarked 2% of residents are reported as African American or Black, compared to the Maryland average of 13%. A lower African American share than is typical in Maryland; local markets still vary widely. |
7% Other Ethnicity Residents — State Benchmarked 7% of residents fall into categories other than White or African American (combined), compared to the Maryland average of 6%. This column aggregates Hispanic, Asian, multiracial, and any other labeled groups that are not classified as White or African American. Reported subgroups in this total: Asian (5%), Other (2%). |
2% Residents Age 65–74 — State Benchmarked 2% of residents are 65–74, compared to the Maryland average of 13%. Fewer younger seniors suggests the resident population skews older, likely requiring higher acuity care and more hands-on support. |
35% Residents Age 75–84 — State Benchmarked 35% of residents are 75–84, compared to the Maryland average of 31%. This is the second most common age bracket in assisted living, representing residents with moderate care needs. |
39% Residents Age 85–94 — State Benchmarked 39% of residents are 85–94, compared to the Maryland average of 44%. This is typically the most common age bracket in assisted living — this facility is in line with the statewide norm. |
19% Residents Age 95+ — State Benchmarked 19% of residents are 95 or older, compared to the Maryland average of 16%. In line with the statewide profile for the oldest resident bracket. |
| The Seneca Rockville | AL MC | Rockville (King Farm) | 156
Facility
156
MD AVG
42
Rank
#36 / 685 | Yes |
45
Facility
45
MD AVG
43
Rank
#475 / 985 | Studio / 1 Bed / 2 Bed | 4
Facility
4
MD AVG
20
Rank
#194 / 210 |
32% Male Residents — State Benchmarked 32% of residents are male, compared to the Maryland average of 31%. This facility caters to a majority female resident pool (68% female), consistent with the broader assisted living trend where women significantly outnumber men. |
68% Female Residents — State Benchmarked 68% of residents are female, compared to the Maryland average of 69%. Women comprise the large majority, consistent with national assisted living demographics where women live longer and enter care facilities at higher rates. |
87% White Residents — State Benchmarked 87% of residents are reported as White, compared to the Maryland average of 81%. Close to the average for this category among assisted living facilities in Maryland with reported race/ethnicity data. |
2% African American Residents — State Benchmarked 2% of residents are reported as African American or Black, compared to the Maryland average of 13%. A lower African American share than is typical in Maryland; local markets still vary widely. |
11% Other Ethnicity Residents — State Benchmarked 11% of residents fall into categories other than White or African American (combined), compared to the Maryland average of 6%. This column aggregates Hispanic, Asian, multiracial, and any other labeled groups that are not classified as White or African American. Reported subgroups in this total: Asian (10%), Hispanic (2%). |
8% Residents Age 65–74 — State Benchmarked 8% of residents are 65–74, compared to the Maryland average of 13%. Fewer younger seniors suggests the resident population skews older, likely requiring higher acuity care and more hands-on support. |
34% Residents Age 75–84 — State Benchmarked 34% of residents are 75–84, compared to the Maryland average of 31%. This is the second most common age bracket in assisted living, representing residents with moderate care needs. |
45% Residents Age 85–94 — State Benchmarked 45% of residents are 85–94, compared to the Maryland average of 44%. This is typically the most common age bracket in assisted living — this facility is in line with the statewide norm. |
13% Residents Age 95+ — State Benchmarked 13% of residents are 95 or older, compared to the Maryland average of 16%. In line with the statewide profile for the oldest resident bracket. |
| Raphael House | AL HOS PC | Rockville (Dunster Road) | 15
Facility
15
MD AVG
42
Rank
#263 / 685 | Yes |
19
Facility
19
MD AVG
43
Rank
#746 / 985 | Studio | 34
Facility
34
MD AVG
20
Rank
#20 / 210 |
13% Male Residents — State Benchmarked 13% of residents are male, compared to the Maryland average of 31%. This facility caters to a majority female resident pool (87% female), consistent with the broader assisted living trend where women significantly outnumber men. |
87% Female Residents — State Benchmarked 87% of residents are female, compared to the Maryland average of 69%. Women comprise the large majority, consistent with national assisted living demographics where women live longer and enter care facilities at higher rates. |
80% White Residents — State Benchmarked 80% of residents are reported as White, compared to the Maryland average of 81%. Close to the average for this category among assisted living facilities in Maryland with reported race/ethnicity data. |
0% African American Residents — State Benchmarked 0% of residents are reported as African American or Black, compared to the Maryland average of 13%. A lower African American share than is typical in Maryland; local markets still vary widely. |
20% Other Ethnicity Residents — State Benchmarked 20% of residents fall into categories other than White or African American (combined), compared to the Maryland average of 6%. This column aggregates Hispanic, Asian, multiracial, and any other labeled groups that are not classified as White or African American. Reported subgroups in this total: Asian (13%), Hispanic (7%). | - |
13% Residents Age 75–84 — State Benchmarked 13% of residents are 75–84, compared to the Maryland average of 31%. Below the state norm — the resident mix may skew either younger or older than this typical middle bracket. |
60% Residents Age 85–94 — State Benchmarked 60% of residents are 85–94, compared to the Maryland average of 44%. A high concentration of very elderly residents signals a higher-acuity facility with experience caring for advanced age-related needs. |
27% Residents Age 95+ — State Benchmarked 27% of residents are 95 or older, compared to the Maryland average of 16%. A high proportion of the oldest-old suggests strong end-of-life care experience and very-high-acuity capabilities. |
| AlfredHouse V | AL MC RC | Rockville | 16
Facility
16
MD AVG
42
Rank
#246 / 685 | No |
12
Facility
12
MD AVG
43
Rank
#802 / 985 | Private Rooms | 33
Facility
33
MD AVG
20
Rank
#23 / 210 |
33% Male Residents — State Benchmarked 33% of residents are male, compared to the Maryland average of 31%. This facility caters to a majority female resident pool (67% female), consistent with the broader assisted living trend where women significantly outnumber men. |
67% Female Residents — State Benchmarked 67% of residents are female, compared to the Maryland average of 69%. Women comprise the large majority, consistent with national assisted living demographics where women live longer and enter care facilities at higher rates. |
92% White Residents — State Benchmarked 92% of residents are reported as White, compared to the Maryland average of 81%. A higher White share than is typical for assisted living in Maryland in this dataset — compare with peer facilities for local context. |
8% African American Residents — State Benchmarked 8% of residents are reported as African American or Black, compared to the Maryland average of 13%. In line with the Maryland average for African American residents among facilities reporting this breakdown. |
0% Other Ethnicity Residents — State Benchmarked 0% of residents fall into categories other than White or African American (combined), compared to the Maryland average of 6%. This column aggregates Hispanic, Asian, multiracial, and any other labeled groups that are not classified as White or African American. | - |
58% Residents Age 75–84 — State Benchmarked 58% of residents are 75–84, compared to the Maryland average of 31%. A high concentration in this mid-range bracket, where residents typically need moderate support with daily activities. |
42% Residents Age 85–94 — State Benchmarked 42% of residents are 85–94, compared to the Maryland average of 44%. This is typically the most common age bracket in assisted living — this facility is in line with the statewide norm. | - |
| Charles E. Smith Life Communities | AL HC IL MC NH SNF | Rockville (Montrose Road) | - | Yes |
68
Facility
68
MD AVG
43
Rank
#214 / 985 | Apartments / Cottages | - | - | - | - | - | - | - | - | - | - |
| AlfredHouse Symphony | AL HOS MC RC | Derwood | 34
Facility
34
MD AVG
42
Rank
#235 / 685 | No |
6
Facility
6
MD AVG
43
Rank
#891 / 985 | Private Rooms | 9
Facility
9
MD AVG
20
Rank
#160 / 210 |
40% Male Residents — State Benchmarked 40% of residents are male, compared to the Maryland average of 31%. A relatively balanced gender mix for assisted living, where facilities typically skew heavily female. |
60% Female Residents — State Benchmarked 60% of residents are female, compared to the Maryland average of 69%. Closer to an even gender split than most assisted living facilities, which typically have 65–75% female residents. |
84% White Residents — State Benchmarked 84% of residents are reported as White, compared to the Maryland average of 81%. Close to the average for this category among assisted living facilities in Maryland with reported race/ethnicity data. |
16% African American Residents — State Benchmarked 16% of residents are reported as African American or Black, compared to the Maryland average of 13%. In line with the Maryland average for African American residents among facilities reporting this breakdown. |
0% Other Ethnicity Residents — State Benchmarked 0% of residents fall into categories other than White or African American (combined), compared to the Maryland average of 6%. This column aggregates Hispanic, Asian, multiracial, and any other labeled groups that are not classified as White or African American. |
28% Residents Age 65–74 — State Benchmarked 28% of residents are 65–74, compared to the Maryland average of 13%. A higher share of younger seniors often signals a more independent, active resident community with lower acuity care needs. |
32% Residents Age 75–84 — State Benchmarked 32% of residents are 75–84, compared to the Maryland average of 31%. This is the second most common age bracket in assisted living, representing residents with moderate care needs. |
40% Residents Age 85–94 — State Benchmarked 40% of residents are 85–94, compared to the Maryland average of 44%. This is typically the most common age bracket in assisted living — this facility is in line with the statewide norm. | - |
| Village at Rockville | AL HC IL MC NH RC SNF | Rockville | 57
Facility
57
MD AVG
42
Rank
#201 / 685 | No |
94
Facility
94
MD AVG
43
Rank
#9 / 985 | - | 13
Facility
13
MD AVG
20
Rank
#141 / 210 | - | - | - | - | - | - | - | - | - |
| Cadence Living Olney | AL IL MC | Olney (Cherry Valley) | - | Yes |
48
Facility
48
MD AVG
43
Rank
#448 / 985 | Studio / 1 Bed | - | - | - | - | - | - | - | - | - | - |
| AlfredHouse Andrus | AL HOS MC RC | Rockville | 15
Facility
15
MD AVG
42
Rank
#263 / 685 | No |
49
Facility
49
MD AVG
43
Rank
#431 / 985 | Private Rooms | 10
Facility
10
MD AVG
20
Rank
#156 / 210 |
33% Male Residents — State Benchmarked 33% of residents are male, compared to the Maryland average of 31%. This facility caters to a majority female resident pool (67% female), consistent with the broader assisted living trend where women significantly outnumber men. |
67% Female Residents — State Benchmarked 67% of residents are female, compared to the Maryland average of 69%. Women comprise the large majority, consistent with national assisted living demographics where women live longer and enter care facilities at higher rates. |
92% White Residents — State Benchmarked 92% of residents are reported as White, compared to the Maryland average of 81%. A higher White share than is typical for assisted living in Maryland in this dataset — compare with peer facilities for local context. |
8% African American Residents — State Benchmarked 8% of residents are reported as African American or Black, compared to the Maryland average of 13%. In line with the Maryland average for African American residents among facilities reporting this breakdown. |
0% Other Ethnicity Residents — State Benchmarked 0% of residents fall into categories other than White or African American (combined), compared to the Maryland average of 6%. This column aggregates Hispanic, Asian, multiracial, and any other labeled groups that are not classified as White or African American. |
25% Residents Age 65–74 — State Benchmarked 25% of residents are 65–74, compared to the Maryland average of 13%. A higher share of younger seniors often signals a more independent, active resident community with lower acuity care needs. |
75% Residents Age 75–84 — State Benchmarked 75% of residents are 75–84, compared to the Maryland average of 31%. A high concentration in this mid-range bracket, where residents typically need moderate support with daily activities. | - | - |
| Arden Courts of Kensington | AL IL MC RC | Rockville | - | No |
83
Facility
83
MD AVG
43
Rank
#70 / 985 | - | - | - | - | - | - | - | - | - | - | - |
Rows per page:

View all Nearby Homes
Make the most of your best years at La Familia Assisted Living, a blissful retreat in Rockville, MD, offering assisted living. Residents can ease their worries with a compassionate and well-trained team helping with their daily living activities and personal needs 24/7. The community also offers specially designed and secure accommodations, ensuring residents are comfortable and safe.
For residents’ happiness and wellness, a variety of engaging activities and enriching programs are conducted. Healthy meals are important for residents’ well-being, so delicious and well-balanced dining options are served to meet their nutritional needs and preferences. With its dedicated services and state-of-the-art amenities, residents are guaranteed the finest retirement experience.
Conveniently located in the harmonious residential area of East Jefferson Street, Rockville, MD, Ring House Independent Living Apartments is a blissful retreat that offers independent living. Featuring cozy and specially designed studio to two-bedroom floor plans, residents are guaranteed to find the accommodation that best matches their preferences. The community also offers round-the-clock concierge to assist residents with their day-to-day activities.
With a carefully curated calendar of fun activities and enriching programs, residents gain meaningful experiences and meet new friends. Therapy services, including physical, occupational, and speech therapy, are also available in the community with its rehab suite. Here, residents retain their independence while doing the things they love, surrounded by the community’s welcoming spaces.
Overview of Cedar Glen Memory Care Home


Rockville families looking at Cedar Glen Memory Care Home will find it on Pipestem Court, in a single-story building where every resident has a private room. Cars are the main way to get around this part of town. A Walk Score of 23 backs that up, marking the area as car-dependent, with most errands out of easy walking distance.
Morning staffing runs at one caregiver for every three residents. That number changes by evening, when it becomes one caregiver for every four. Day or night, someone is always on duty. Nursing services run alongside a doctor who is on staff. When residents need it, rehabilitation services and respite care are also available to them.
Families facing end-of-life care will find a program built specifically for that stage. Rather than sticking to a fixed schedule, staff shape daily activities around what each resident already likes to do. Art, music, and light exercise show up often in that mix. Every meal is home-cooked, not brought in from outside, and a large backyard garden gives residents room to sit or walk outdoors. Staff also handle the housekeeping, which frees up time and energy for residents and their families.
Medicare is accepted at Cedar Glen, something worth knowing for a family working out how to pay for care. The staffing numbers, the presence of medical support on site, and the dedicated end-of-life program point to a specific kind of resident: someone whose memory care needs call for steady, hands-on attention rather than a lighter touch.
Peacefully settled in a serene and peaceful environment in Rockville, MD, AlfredHouse III is a blissful senior living community that provides assisted living, memory care, personal care, and respite care. Featuring beautifully appointed residences with 24 hour team availability and security, the community warrants a safe, secure, and comfortable living environment. The community makes sure residents feel well cared for with access to various supportive services, including assistance with daily living activities, medication management or personal care assistance.
Lively and engaging daily events, fitness programs, and emotional support and therapy are available to help residents live a fulfilling lifestyle that nurtures their mind, body, and soul. Chef-prepared meals are also offered to provide residents the nourishment they need to continue staying active and healthy. Various amenities, such as gardening spaces, reading rooms, water therapies, and salon & grooming services are available to provide residents with convenience and spaces for relaxation.
Overview of Assisted Living of Rockville II


Ideally set in the harmonious residential area of Parkland Drive, Rockville, MD, Assisted Living of Rockville II is an outstanding community that offers assisted living. The community strives to provide the highest quality of care and assistance for up to eight residents with a compassionate and highly skilled team attending to their needs around the clock. With assistance with daily living activities and household responsibilities, residents are guaranteed to enjoy the utmost care and comfort they deserve.
Here, fun activities and engaging programs are also conducted to keep residents active and socially connected. Healthy and delightful meals are served to meet residents’ dietary needs and preferences. The community also works closely with healthcare providers to coordinate residents’ healthcare needs, ensuring their needs are met. Transportation services and medication management are also also available for residents’ convenience. Enjoy your later years without worries with the community’s trusted care.
Overview of Assisted Living of Rockville III
Surrounded by convenient local amenities in Renn Street, Rockville, MD, Assisted Living of Rockville III is a unique community that offers assisted living. Here, residents receive top-notch care and support from a compassionate and well-trained team attending to their needs 24/7. With well-thought-of and cozy accommodations, residents do not have to worry about comfort and safety.
There’s no dull moment in the community with its fun programs and engaging activities, encouraging residents to remain active and well-engaged. Have the finest dining experience with healthy and delicious meals catering to dietary needs and preferences. Medication management and transportation services are also provided to ensure residents do not miss their medication and appointments. The community is a great choice for those who are in need of additional support to live their golden years without worries.
Set amidst lush green landscapes in Rockville, MD, AlfredHouse IV Villa is a welcoming senior living community that offers excellent assisted living, memory care, personal care, and respite care. Featuring only 6 well-designed residences and the standard 1:4 caregiver ratio, the community guarantees personalized assistance and focused attention in an intimate living environment. The community is equipped with 24-hour security and team members to guarantee residents’ safety and security.
In addition to extensive care and support, residents are also given plenty of opportunities for enrichment through the community’s broad array of engaging and stimulating activities and programs. The community also offers scheduled transportation to help residents freely explore the world around them. Chef-prepared meals, housekeeping services, and thoughtful amenities are also offered to make residents’ lives easier and fun.
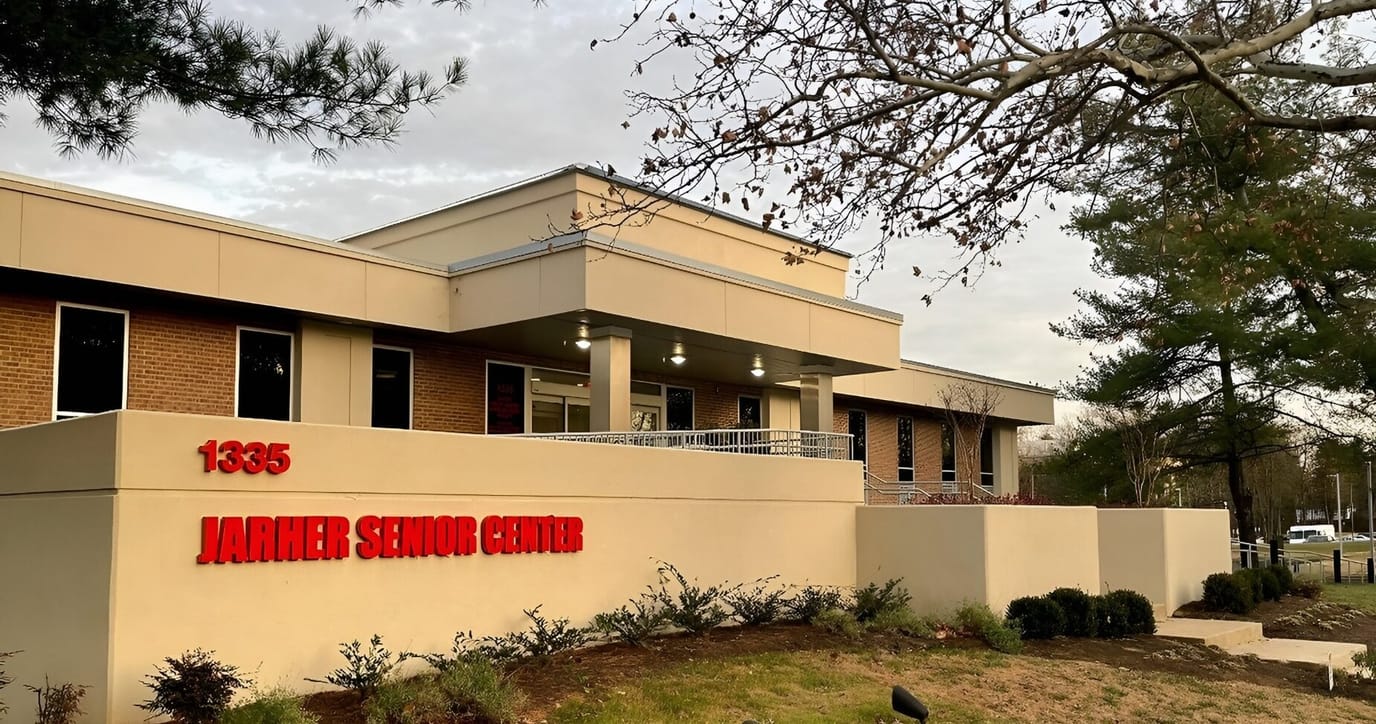
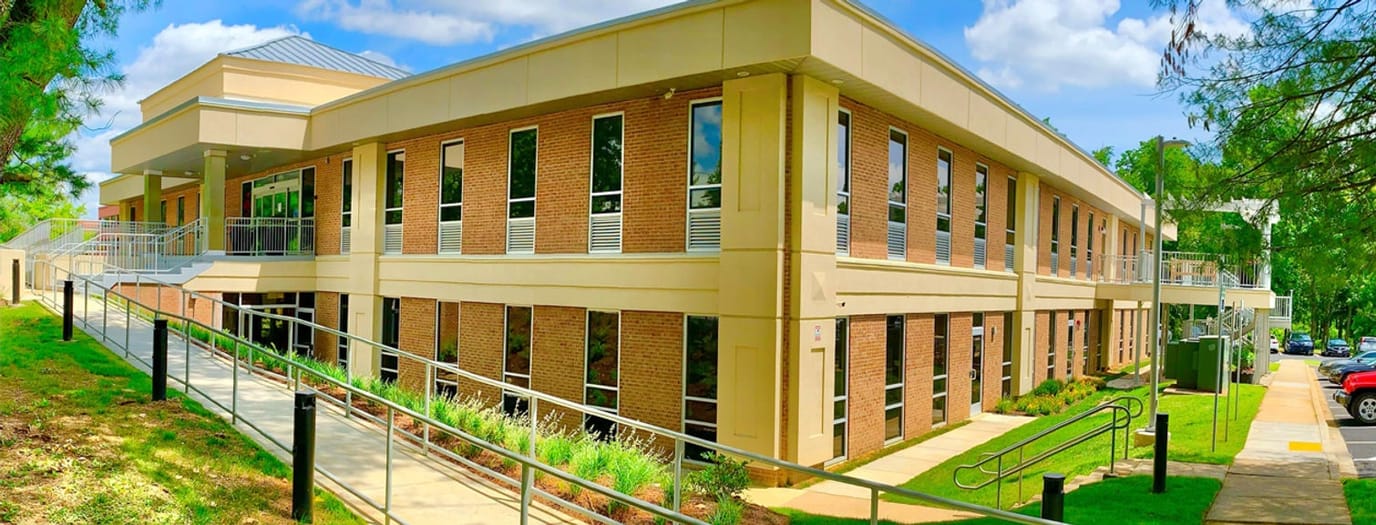
Jarher Senior Center is a senior care community in Rockville, MD, offering adult day care, assisted living, respite care and memory care. Promoting a nurturing and welcoming environment, the community ensures older adults are well-cared for. Recreational activities, assistance with daily living activities, and wellness programs are also available for residents’ social and physical wellness. The community also provides medical assistance, medical insurance, dental insurance, as well as food coupons, to ease financial burdens.
Dance, Tai Chi, planting, and handicrafts are just some of the recreational opportunities that older adults can participate in. The community also offers acupuncture, as well as physical therapy and massage for older adults’ welfare. Located in the lively neighborhood of Rockville, the community guarantees accessibility and convenience. This senior care community in Maryland a great option for older adults seeking to maintain independence in their later years.
Overview of Assisted Living of Rockville IV
Ideally situated in the harmonious residential area of Heathfield Road, Rockville, MD, Assisted Living of Rockville IV is a unique community that offers assisted living. Here, residents receive top-notch care and assistance from a highly skilled and respectful team available 24/7. The community also handles the housekeeping and laundry to ensure a worry-free retirement.
Have fun and remain actively engaged with enriching activities and stimulating programs conducted for leisure and wellness. Indulge in healthy and delicious meals, catering to dietary needs and preferences. The community also provides medication management, onsite registered nurses, and transportation services to ensure residents are well-cared for. Live a worry-free retirement with the community’s top-notch care and specially designed amenities.
Enjoy a worry-free lifestyle at La Familia II, an outstanding retreat in Rockville, MD, that offers assisted living. Residents can keep their peace of mind with a kind and well-trained team who helps with their daily living activities 24/7. A hassle-free living is also guaranteed with housekeeping and laundry services.
Residents are encouraged to interact with their surroundings and live actively with plenty of enjoyable exercises and cozy communal spaces. Mealtimes also foster comfort and satisfy dietary needs with delicious and well-balanced dining options. The community’s warm and inviting environment creates the ideal setting where residents can make the most of their best years.
Ranking Methodology
How we rank these assisted living communities
Every community above is evaluated across six weighted categories using public data including state inspection records, review platforms, BBB profiles, and operator-published materials.
Weighting overview
- 35%Resident Experience
- 25%Regulatory
- 15%Visual Media
- 10%Website
- 10%Stability
- 5%Environment
01
Resident & Family Experience 35%
The single largest share of every ranking. Aggregated review sentiment and volume from major platforms — the closest signal to real resident experience.
- Includes
- Review Sentiment
- Review Volume
02
Regulatory & Safety Record 25%
State inspection records, citations, and complaint visits. We weight per-inspection rates more heavily than raw counts.
- Includes
- State Inspections
- Citations/Inspection
- % Inspections w/ Citations
- Complaint Visits
- Accreditations
- BBB Rating
03
Visual Media & Transparency 15%
Communities that publish high-quality visuals give families a real preview. No photos or tours = a negative transparency signal.
- Includes
- Video Tours
- Virtual Walkthroughs
- Photo Quantity
- Photo Quality
04
Website & Operator Transparency 10%
Site quality and whether the operator publishes basic accountability information — staff names, contact details, ownership.
- Includes
- Website Content
- Mobile Usability
- Staff Info Available
- Owner Info Available
05
Community Stability 10%
Operational signals indicating whether a community is well-run and meeting demand.
- Includes
- Occupancy Rate
- Bed Options
06
Environment & Pricing 5%
Walkability and pricing transparency. Walk Score is weighted higher for Independent Living than for Memory Care, where most residents do not leave unaccompanied.
- Includes
- Walk Score
- Pricing Transparency
Who we are
Your Senior Care Partner, Every Step of the Way
We help families find affordable senior communities and unlock same day discounts, Medicaid, and Medicare options tailored to your needs.
Contact us Today
Frequently Asked Questions about Assisted Living in Rockville, MD
What is the average cost of assisted living in Rockville, MD?
The average monthly cost of assisted living in Rockville, MD is approximately $6,300. Actual rates vary by community, level of care, and floorplan.
What is the price range for assisted living in Rockville, MD?
Assisted living in Rockville, MD typically ranges from $5,800–$8,400 per month, depending on the community, room type, and care needs.
What is the typical staff-to-resident ratio at assisted living facilities in Rockville, MD?
Assisted living facilities in Rockville, MD typically operate with a staff-to-resident ratio in the range of 1:6 to 1:12.
What's the difference between assisted living and memory care in Maryland?
Assisted living in Maryland supports residents with daily activities (bathing, dressing, medication management) while preserving independence. Memory care is a specialized form of assisted living for residents living with Alzheimer's or dementia, and adds 24/7 secured environments, dementia-trained staff, and structured routines designed to reduce confusion and wandering.
What's the difference between assisted living and a nursing home in Maryland?
Assisted living in Maryland is a residential model focused on housing, hospitality, and help with daily activities. Nursing homes (skilled nursing facilities) provide 24/7 medical care from licensed nurses for residents with significant health needs, and are regulated more strictly under both state and federal CMS rules.
Does Maryland Medicaid cover assisted living?
Maryland Medicaid does not directly pay room-and-board for assisted living, but most states (including Maryland) offer Home and Community-Based Services (HCBS) waivers that can offset the cost of care services delivered inside a licensed community. Eligibility, waitlists, and covered services vary — check directly with the state Medicaid agency.
What is assisted living?
Assisted living combines private or semi-private apartments with help on activities of daily living (meals, bathing, dressing, medication management) and a social calendar — for residents who need some support but do not need 24/7 medical care.
Updated on
