


Compare Assisted Living around Rockville
Info below is compiled from the MD Dept. of Health (OHCQ), senior community websites & trusted data sources such as Walk Score & BBB.
Communities are listed from highest to lowest based on our ranking methodology.
| Sunrise of Rockville | AL HOS MC | Rockville (Baltimore Road) | 89
Facility
89
MD AVG
42
Rank
#150 / 685 | Yes |
89
Facility
89
MD AVG
43
Rank
#32 / 985 | Studio / 1 Bed / 2 Bed | 45
Facility
45
MD AVG
20
Rank
#3 / 210 |
23% Male Residents — State Benchmarked 23% of residents are male, compared to the Maryland average of 31%. This facility caters to a majority female resident pool (77% female), consistent with the broader assisted living trend where women significantly outnumber men. |
77% Female Residents — State Benchmarked 77% of residents are female, compared to the Maryland average of 69%. Women comprise the large majority, consistent with national assisted living demographics where women live longer and enter care facilities at higher rates. |
87% White Residents — State Benchmarked 87% of residents are reported as White, compared to the Maryland average of 81%. Close to the average for this category among assisted living facilities in Maryland with reported race/ethnicity data. |
2% African American Residents — State Benchmarked 2% of residents are reported as African American or Black, compared to the Maryland average of 13%. A lower African American share than is typical in Maryland; local markets still vary widely. |
11% Other Ethnicity Residents — State Benchmarked 11% of residents fall into categories other than White or African American (combined), compared to the Maryland average of 6%. This column aggregates Hispanic, Asian, multiracial, and any other labeled groups that are not classified as White or African American. Reported subgroups in this total: Mixed Race (6%), Hispanic (3%), Asian (2%). |
3% Residents Age 65–74 — State Benchmarked 3% of residents are 65–74, compared to the Maryland average of 13%. Fewer younger seniors suggests the resident population skews older, likely requiring higher acuity care and more hands-on support. |
31% Residents Age 75–84 — State Benchmarked 31% of residents are 75–84, compared to the Maryland average of 31%. This is the second most common age bracket in assisted living, representing residents with moderate care needs. |
56% Residents Age 85–94 — State Benchmarked 56% of residents are 85–94, compared to the Maryland average of 44%. A high concentration of very elderly residents signals a higher-acuity facility with experience caring for advanced age-related needs. |
10% Residents Age 95+ — State Benchmarked 10% of residents are 95 or older, compared to the Maryland average of 16%. Most residents here have not yet reached the oldest-old bracket, suggesting a younger overall community. |
| Ingleside at King Farm | AL IL MC NH SNF | Rockville (King Farm) | 45
Facility
45
MD AVG
42
Rank
#219 / 685 | Yes |
73
Facility
73
MD AVG
43
Rank
#152 / 985 | 1 Bed / 2 Bed | - | - | - | - | - | - | - | - | - | - |
| Revitz House | AL HC IL MC NH SNF | Rockville | 558
Facility
558
MD AVG
42
Rank
#1 / 685 | Yes |
81
Facility
81
MD AVG
43
Rank
#86 / 985 | 1 Bed | - | - | - | - | - | - | - | - | - | - |
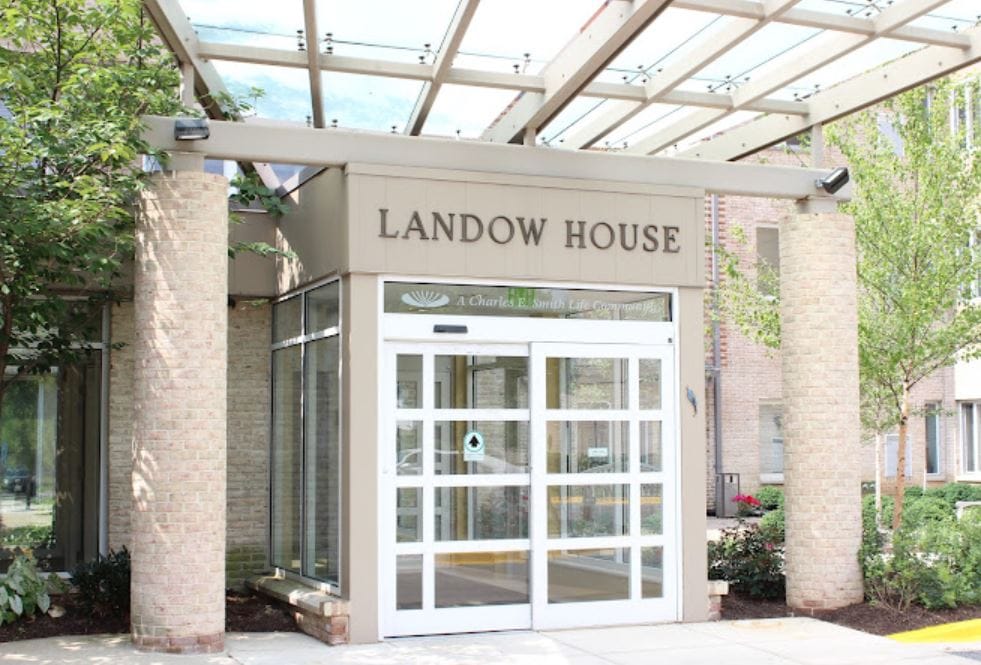
| Landow House | AL HC IL MC NH SNF | Rockville (Rollins Park) | 98
Facility
98
MD AVG
42
Rank
#126 / 685 | Yes |
59
Facility
59
MD AVG
43
Rank
#327 / 985 | 1 Bed / 2 Bed | 31
Facility
31
MD AVG
20
Rank
#37 / 210 |
31% Male Residents — State Benchmarked 31% of residents are male, compared to the Maryland average of 31%. This facility caters to a majority female resident pool (69% female), consistent with the broader assisted living trend where women significantly outnumber men. |
69% Female Residents — State Benchmarked 69% of residents are female, compared to the Maryland average of 69%. Women comprise the large majority, consistent with national assisted living demographics where women live longer and enter care facilities at higher rates. |
99% White Residents — State Benchmarked 99% of residents are reported as White, compared to the Maryland average of 81%. A higher White share than is typical for assisted living in Maryland in this dataset — compare with peer facilities for local context. |
0% African American Residents — State Benchmarked 0% of residents are reported as African American or Black, compared to the Maryland average of 13%. A lower African American share than is typical in Maryland; local markets still vary widely. |
1% Other Ethnicity Residents — State Benchmarked 1% of residents fall into categories other than White or African American (combined), compared to the Maryland average of 6%. This column aggregates Hispanic, Asian, multiracial, and any other labeled groups that are not classified as White or African American. Reported subgroups in this total: Asian (1%). |
7% Residents Age 65–74 — State Benchmarked 7% of residents are 65–74, compared to the Maryland average of 13%. Fewer younger seniors suggests the resident population skews older, likely requiring higher acuity care and more hands-on support. |
20% Residents Age 75–84 — State Benchmarked 20% of residents are 75–84, compared to the Maryland average of 31%. Below the state norm — the resident mix may skew either younger or older than this typical middle bracket. |
49% Residents Age 85–94 — State Benchmarked 49% of residents are 85–94, compared to the Maryland average of 44%. A high concentration of very elderly residents signals a higher-acuity facility with experience caring for advanced age-related needs. |
24% Residents Age 95+ — State Benchmarked 24% of residents are 95 or older, compared to the Maryland average of 16%. A high proportion of the oldest-old suggests strong end-of-life care experience and very-high-acuity capabilities. |
| Brightview West End | AL IL MC | Rockville | 98
Facility
98
MD AVG
42
Rank
#126 / 685 | Yes |
89
Facility
89
MD AVG
43
Rank
#32 / 985 | Studio / 1 Bed / 2 Bed | 8
Facility
8
MD AVG
20
Rank
#163 / 210 |
32% Male Residents — State Benchmarked 32% of residents are male, compared to the Maryland average of 31%. This facility caters to a majority female resident pool (68% female), consistent with the broader assisted living trend where women significantly outnumber men. |
68% Female Residents — State Benchmarked 68% of residents are female, compared to the Maryland average of 69%. Women comprise the large majority, consistent with national assisted living demographics where women live longer and enter care facilities at higher rates. |
84% White Residents — State Benchmarked 84% of residents are reported as White, compared to the Maryland average of 81%. Close to the average for this category among assisted living facilities in Maryland with reported race/ethnicity data. |
4% African American Residents — State Benchmarked 4% of residents are reported as African American or Black, compared to the Maryland average of 13%. A lower African American share than is typical in Maryland; local markets still vary widely. |
12% Other Ethnicity Residents — State Benchmarked 12% of residents fall into categories other than White or African American (combined), compared to the Maryland average of 6%. This column aggregates Hispanic, Asian, multiracial, and any other labeled groups that are not classified as White or African American. Reported subgroups in this total: Other (5%), Asian (4%), Mixed Race (4%). |
14% Residents Age 65–74 — State Benchmarked 14% of residents are 65–74, compared to the Maryland average of 13%. In line with the statewide profile for this youngest senior bracket in assisted living. |
37% Residents Age 75–84 — State Benchmarked 37% of residents are 75–84, compared to the Maryland average of 31%. A high concentration in this mid-range bracket, where residents typically need moderate support with daily activities. |
33% Residents Age 85–94 — State Benchmarked 33% of residents are 85–94, compared to the Maryland average of 44%. The population here skews younger than the statewide norm, which may indicate a more active, lower-acuity community. |
16% Residents Age 95+ — State Benchmarked 16% of residents are 95 or older, compared to the Maryland average of 16%. In line with the statewide profile for the oldest resident bracket. |
| Brightview Fallsgrove | AL MC | Rockville (Glenora Hills) | 100
Facility
100
MD AVG
42
Rank
#109 / 685 | No |
34
Facility
34
MD AVG
43
Rank
#590 / 985 | Studio / 1 Bed | 13
Facility
13
MD AVG
20
Rank
#141 / 210 |
19% Male Residents — State Benchmarked 19% of residents are male, compared to the Maryland average of 31%. This facility caters to a majority female resident pool (81% female), consistent with the broader assisted living trend where women significantly outnumber men. |
81% Female Residents — State Benchmarked 81% of residents are female, compared to the Maryland average of 69%. Women comprise the large majority, consistent with national assisted living demographics where women live longer and enter care facilities at higher rates. |
91% White Residents — State Benchmarked 91% of residents are reported as White, compared to the Maryland average of 81%. A higher White share than is typical for assisted living in Maryland in this dataset — compare with peer facilities for local context. |
2% African American Residents — State Benchmarked 2% of residents are reported as African American or Black, compared to the Maryland average of 13%. A lower African American share than is typical in Maryland; local markets still vary widely. |
7% Other Ethnicity Residents — State Benchmarked 7% of residents fall into categories other than White or African American (combined), compared to the Maryland average of 6%. This column aggregates Hispanic, Asian, multiracial, and any other labeled groups that are not classified as White or African American. Reported subgroups in this total: Asian (5%), Other (2%). |
2% Residents Age 65–74 — State Benchmarked 2% of residents are 65–74, compared to the Maryland average of 13%. Fewer younger seniors suggests the resident population skews older, likely requiring higher acuity care and more hands-on support. |
35% Residents Age 75–84 — State Benchmarked 35% of residents are 75–84, compared to the Maryland average of 31%. This is the second most common age bracket in assisted living, representing residents with moderate care needs. |
39% Residents Age 85–94 — State Benchmarked 39% of residents are 85–94, compared to the Maryland average of 44%. This is typically the most common age bracket in assisted living — this facility is in line with the statewide norm. |
19% Residents Age 95+ — State Benchmarked 19% of residents are 95 or older, compared to the Maryland average of 16%. In line with the statewide profile for the oldest resident bracket. |
| The Seneca Rockville | AL MC | Rockville (King Farm) | 156
Facility
156
MD AVG
42
Rank
#36 / 685 | Yes |
45
Facility
45
MD AVG
43
Rank
#475 / 985 | Studio / 1 Bed / 2 Bed | 4
Facility
4
MD AVG
20
Rank
#194 / 210 |
32% Male Residents — State Benchmarked 32% of residents are male, compared to the Maryland average of 31%. This facility caters to a majority female resident pool (68% female), consistent with the broader assisted living trend where women significantly outnumber men. |
68% Female Residents — State Benchmarked 68% of residents are female, compared to the Maryland average of 69%. Women comprise the large majority, consistent with national assisted living demographics where women live longer and enter care facilities at higher rates. |
87% White Residents — State Benchmarked 87% of residents are reported as White, compared to the Maryland average of 81%. Close to the average for this category among assisted living facilities in Maryland with reported race/ethnicity data. |
2% African American Residents — State Benchmarked 2% of residents are reported as African American or Black, compared to the Maryland average of 13%. A lower African American share than is typical in Maryland; local markets still vary widely. |
11% Other Ethnicity Residents — State Benchmarked 11% of residents fall into categories other than White or African American (combined), compared to the Maryland average of 6%. This column aggregates Hispanic, Asian, multiracial, and any other labeled groups that are not classified as White or African American. Reported subgroups in this total: Asian (10%), Hispanic (2%). |
8% Residents Age 65–74 — State Benchmarked 8% of residents are 65–74, compared to the Maryland average of 13%. Fewer younger seniors suggests the resident population skews older, likely requiring higher acuity care and more hands-on support. |
34% Residents Age 75–84 — State Benchmarked 34% of residents are 75–84, compared to the Maryland average of 31%. This is the second most common age bracket in assisted living, representing residents with moderate care needs. |
45% Residents Age 85–94 — State Benchmarked 45% of residents are 85–94, compared to the Maryland average of 44%. This is typically the most common age bracket in assisted living — this facility is in line with the statewide norm. |
13% Residents Age 95+ — State Benchmarked 13% of residents are 95 or older, compared to the Maryland average of 16%. In line with the statewide profile for the oldest resident bracket. |
| Raphael House | AL HOS PC | Rockville (Dunster Road) | 15
Facility
15
MD AVG
42
Rank
#263 / 685 | Yes |
19
Facility
19
MD AVG
43
Rank
#746 / 985 | Studio | 34
Facility
34
MD AVG
20
Rank
#20 / 210 |
13% Male Residents — State Benchmarked 13% of residents are male, compared to the Maryland average of 31%. This facility caters to a majority female resident pool (87% female), consistent with the broader assisted living trend where women significantly outnumber men. |
87% Female Residents — State Benchmarked 87% of residents are female, compared to the Maryland average of 69%. Women comprise the large majority, consistent with national assisted living demographics where women live longer and enter care facilities at higher rates. |
80% White Residents — State Benchmarked 80% of residents are reported as White, compared to the Maryland average of 81%. Close to the average for this category among assisted living facilities in Maryland with reported race/ethnicity data. |
0% African American Residents — State Benchmarked 0% of residents are reported as African American or Black, compared to the Maryland average of 13%. A lower African American share than is typical in Maryland; local markets still vary widely. |
20% Other Ethnicity Residents — State Benchmarked 20% of residents fall into categories other than White or African American (combined), compared to the Maryland average of 6%. This column aggregates Hispanic, Asian, multiracial, and any other labeled groups that are not classified as White or African American. Reported subgroups in this total: Asian (13%), Hispanic (7%). | - |
13% Residents Age 75–84 — State Benchmarked 13% of residents are 75–84, compared to the Maryland average of 31%. Below the state norm — the resident mix may skew either younger or older than this typical middle bracket. |
60% Residents Age 85–94 — State Benchmarked 60% of residents are 85–94, compared to the Maryland average of 44%. A high concentration of very elderly residents signals a higher-acuity facility with experience caring for advanced age-related needs. |
27% Residents Age 95+ — State Benchmarked 27% of residents are 95 or older, compared to the Maryland average of 16%. A high proportion of the oldest-old suggests strong end-of-life care experience and very-high-acuity capabilities. |
| AlfredHouse V | AL MC RC | Rockville | 16
Facility
16
MD AVG
42
Rank
#246 / 685 | No |
12
Facility
12
MD AVG
43
Rank
#802 / 985 | Private Rooms | 33
Facility
33
MD AVG
20
Rank
#23 / 210 |
33% Male Residents — State Benchmarked 33% of residents are male, compared to the Maryland average of 31%. This facility caters to a majority female resident pool (67% female), consistent with the broader assisted living trend where women significantly outnumber men. |
67% Female Residents — State Benchmarked 67% of residents are female, compared to the Maryland average of 69%. Women comprise the large majority, consistent with national assisted living demographics where women live longer and enter care facilities at higher rates. |
92% White Residents — State Benchmarked 92% of residents are reported as White, compared to the Maryland average of 81%. A higher White share than is typical for assisted living in Maryland in this dataset — compare with peer facilities for local context. |
8% African American Residents — State Benchmarked 8% of residents are reported as African American or Black, compared to the Maryland average of 13%. In line with the Maryland average for African American residents among facilities reporting this breakdown. |
0% Other Ethnicity Residents — State Benchmarked 0% of residents fall into categories other than White or African American (combined), compared to the Maryland average of 6%. This column aggregates Hispanic, Asian, multiracial, and any other labeled groups that are not classified as White or African American. | - |
58% Residents Age 75–84 — State Benchmarked 58% of residents are 75–84, compared to the Maryland average of 31%. A high concentration in this mid-range bracket, where residents typically need moderate support with daily activities. |
42% Residents Age 85–94 — State Benchmarked 42% of residents are 85–94, compared to the Maryland average of 44%. This is typically the most common age bracket in assisted living — this facility is in line with the statewide norm. | - |
| Charles E. Smith Life Communities | AL HC IL MC NH SNF | Rockville (Montrose Road) | - | Yes |
68
Facility
68
MD AVG
43
Rank
#214 / 985 | Apartments / Cottages | - | - | - | - | - | - | - | - | - | - |
| AlfredHouse Symphony | AL HOS MC RC | Derwood | 34
Facility
34
MD AVG
42
Rank
#235 / 685 | No |
6
Facility
6
MD AVG
43
Rank
#891 / 985 | Private Rooms | 9
Facility
9
MD AVG
20
Rank
#160 / 210 |
40% Male Residents — State Benchmarked 40% of residents are male, compared to the Maryland average of 31%. A relatively balanced gender mix for assisted living, where facilities typically skew heavily female. |
60% Female Residents — State Benchmarked 60% of residents are female, compared to the Maryland average of 69%. Closer to an even gender split than most assisted living facilities, which typically have 65–75% female residents. |
84% White Residents — State Benchmarked 84% of residents are reported as White, compared to the Maryland average of 81%. Close to the average for this category among assisted living facilities in Maryland with reported race/ethnicity data. |
16% African American Residents — State Benchmarked 16% of residents are reported as African American or Black, compared to the Maryland average of 13%. In line with the Maryland average for African American residents among facilities reporting this breakdown. |
0% Other Ethnicity Residents — State Benchmarked 0% of residents fall into categories other than White or African American (combined), compared to the Maryland average of 6%. This column aggregates Hispanic, Asian, multiracial, and any other labeled groups that are not classified as White or African American. |
28% Residents Age 65–74 — State Benchmarked 28% of residents are 65–74, compared to the Maryland average of 13%. A higher share of younger seniors often signals a more independent, active resident community with lower acuity care needs. |
32% Residents Age 75–84 — State Benchmarked 32% of residents are 75–84, compared to the Maryland average of 31%. This is the second most common age bracket in assisted living, representing residents with moderate care needs. |
40% Residents Age 85–94 — State Benchmarked 40% of residents are 85–94, compared to the Maryland average of 44%. This is typically the most common age bracket in assisted living — this facility is in line with the statewide norm. | - |
| Village at Rockville | AL HC IL MC NH RC SNF | Rockville | 57
Facility
57
MD AVG
42
Rank
#201 / 685 | No |
94
Facility
94
MD AVG
43
Rank
#9 / 985 | - | 13
Facility
13
MD AVG
20
Rank
#141 / 210 | - | - | - | - | - | - | - | - | - |
| Cadence Living Olney | AL IL MC | Olney (Cherry Valley) | - | Yes |
48
Facility
48
MD AVG
43
Rank
#448 / 985 | Studio / 1 Bed | - | - | - | - | - | - | - | - | - | - |
| AlfredHouse Andrus | AL HOS MC RC | Rockville | 15
Facility
15
MD AVG
42
Rank
#263 / 685 | No |
49
Facility
49
MD AVG
43
Rank
#431 / 985 | Private Rooms | 10
Facility
10
MD AVG
20
Rank
#156 / 210 |
33% Male Residents — State Benchmarked 33% of residents are male, compared to the Maryland average of 31%. This facility caters to a majority female resident pool (67% female), consistent with the broader assisted living trend where women significantly outnumber men. |
67% Female Residents — State Benchmarked 67% of residents are female, compared to the Maryland average of 69%. Women comprise the large majority, consistent with national assisted living demographics where women live longer and enter care facilities at higher rates. |
92% White Residents — State Benchmarked 92% of residents are reported as White, compared to the Maryland average of 81%. A higher White share than is typical for assisted living in Maryland in this dataset — compare with peer facilities for local context. |
8% African American Residents — State Benchmarked 8% of residents are reported as African American or Black, compared to the Maryland average of 13%. In line with the Maryland average for African American residents among facilities reporting this breakdown. |
0% Other Ethnicity Residents — State Benchmarked 0% of residents fall into categories other than White or African American (combined), compared to the Maryland average of 6%. This column aggregates Hispanic, Asian, multiracial, and any other labeled groups that are not classified as White or African American. |
25% Residents Age 65–74 — State Benchmarked 25% of residents are 65–74, compared to the Maryland average of 13%. A higher share of younger seniors often signals a more independent, active resident community with lower acuity care needs. |
75% Residents Age 75–84 — State Benchmarked 75% of residents are 75–84, compared to the Maryland average of 31%. A high concentration in this mid-range bracket, where residents typically need moderate support with daily activities. | - | - |
| Arden Courts of Kensington | AL IL MC RC | Rockville | - | No |
83
Facility
83
MD AVG
43
Rank
#70 / 985 | - | - | - | - | - | - | - | - | - | - | - |
Rows per page:

View all Nearby Homes
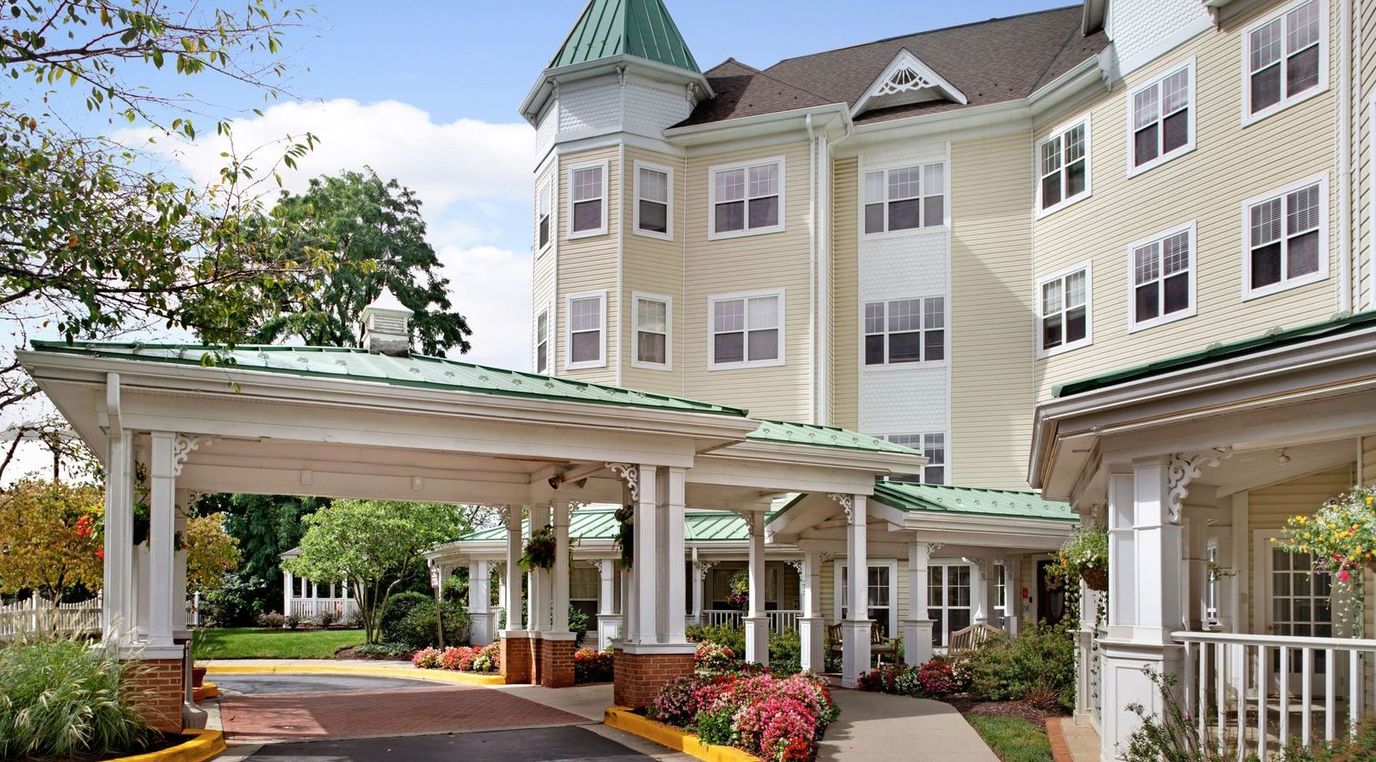
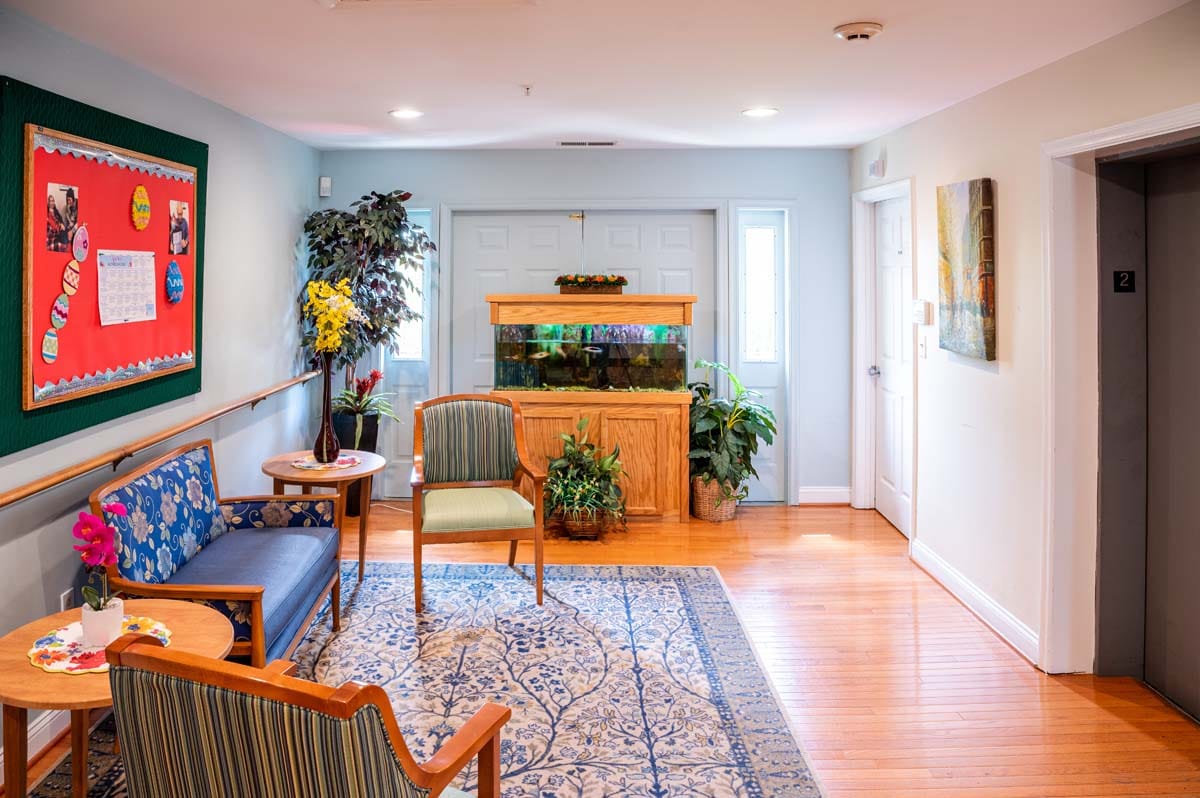
Located in Rockville, Maryland, Sunrise Senior Living is an assisted living community dedicated to tailoring services to individual preferences and needs of seniors. Sunrise embraces a comprehensive philosophy, blending consistency with personalization based on established research and aging theories. From customized programs to exquisite dining, the focus remains on the well-being of each resident, allowing them to shape their lives as they desire. Notably, Sunrise facilitates telehealth appointments, reducing external office visits and enhancing convenience.
Elevating the importance of safety, Sunrise has implemented robust measures to safeguard residents’ health during these times. Through the Sunrise CareConnect electronic health record system, physicians remotely oversee care, medication plans, and progress notes, ensuring continuous and attentive management. Sunrise Senior Living stands ready to offer a third-person-centric approach that prioritizes individual journeys, safety, and well-being of seniors.
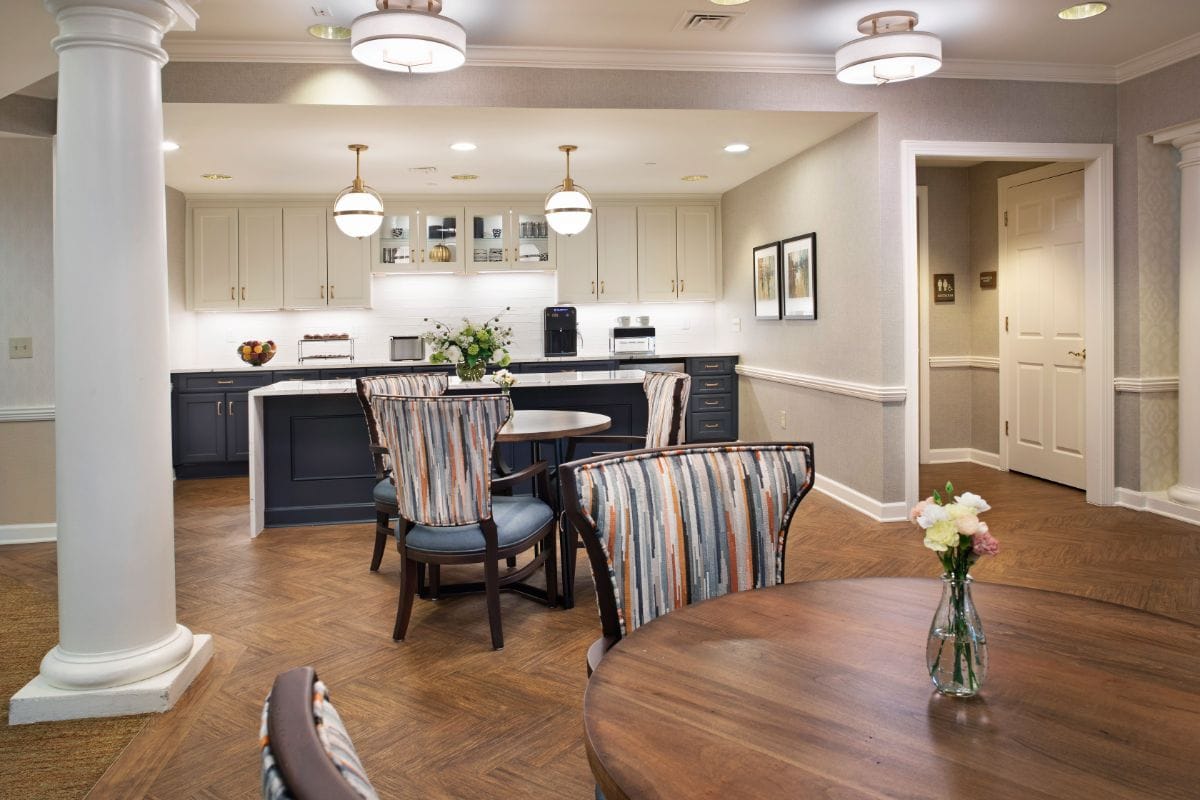
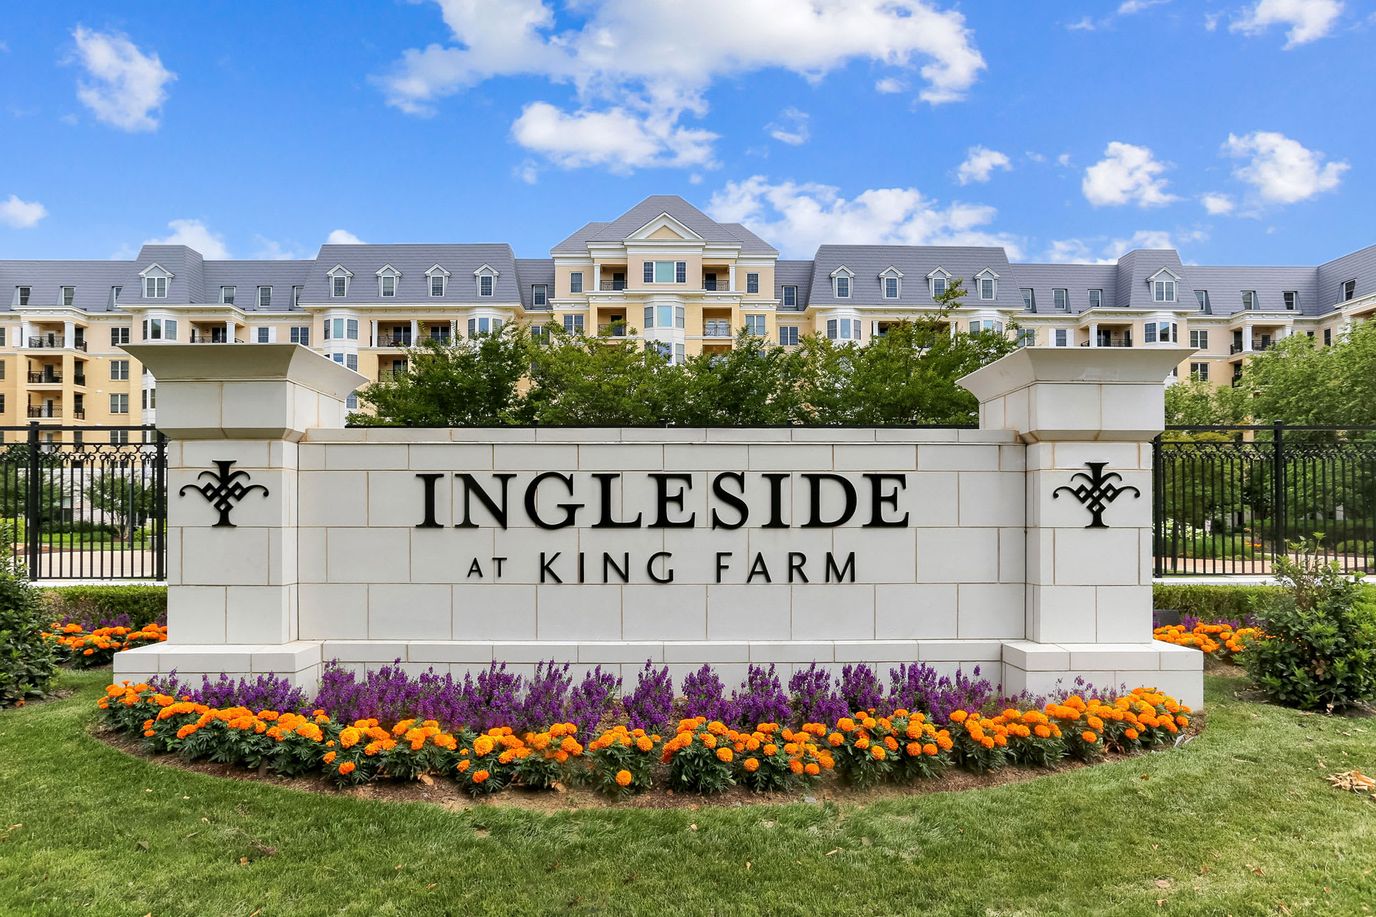
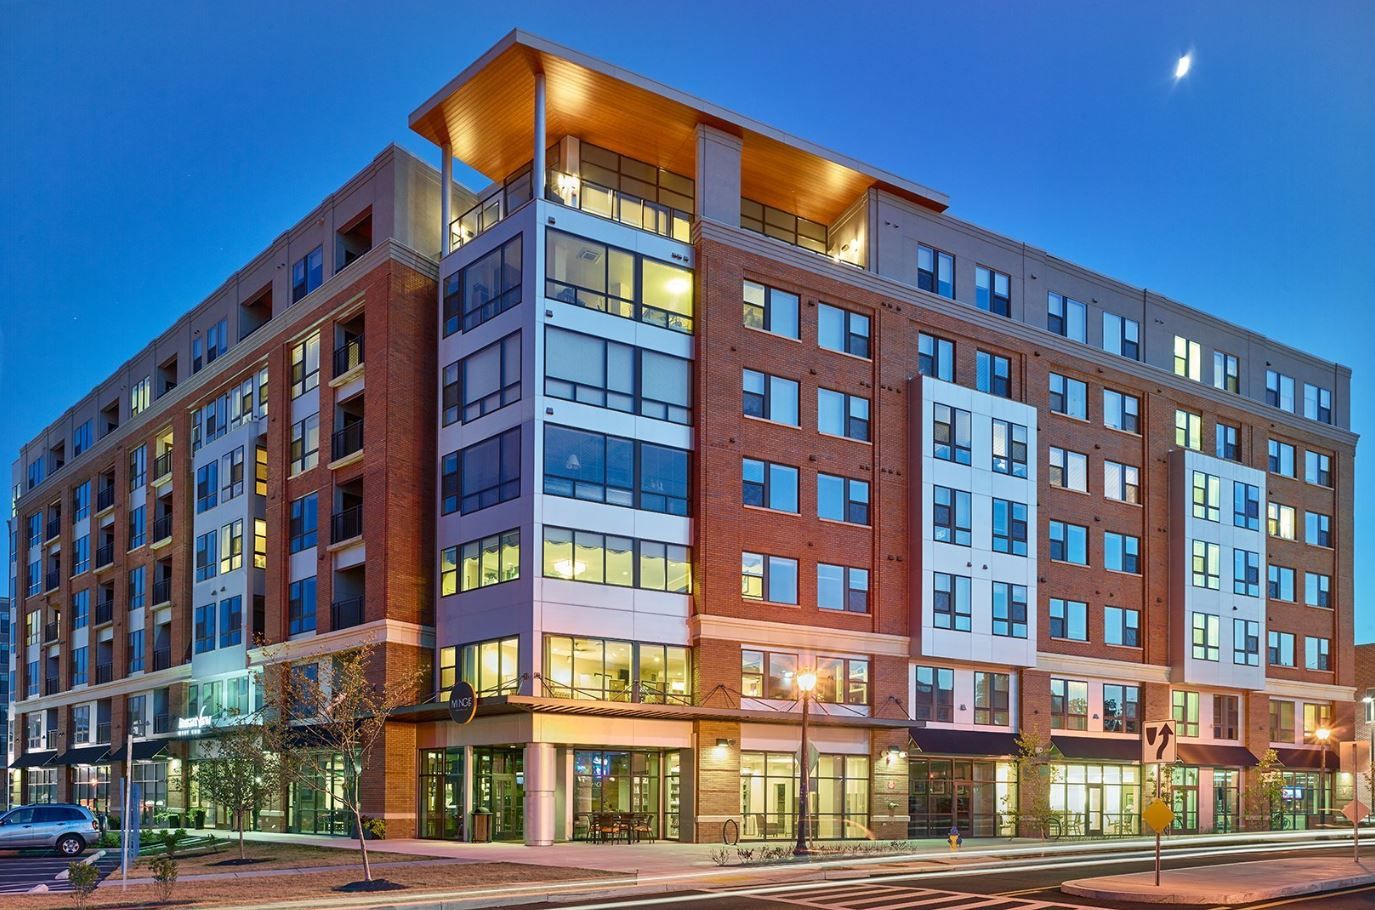
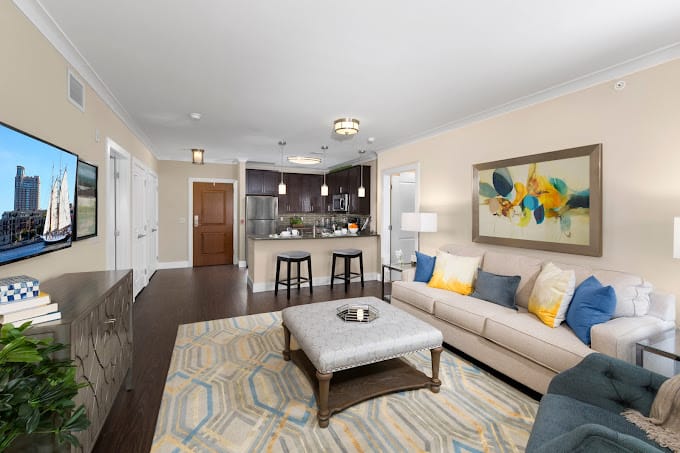
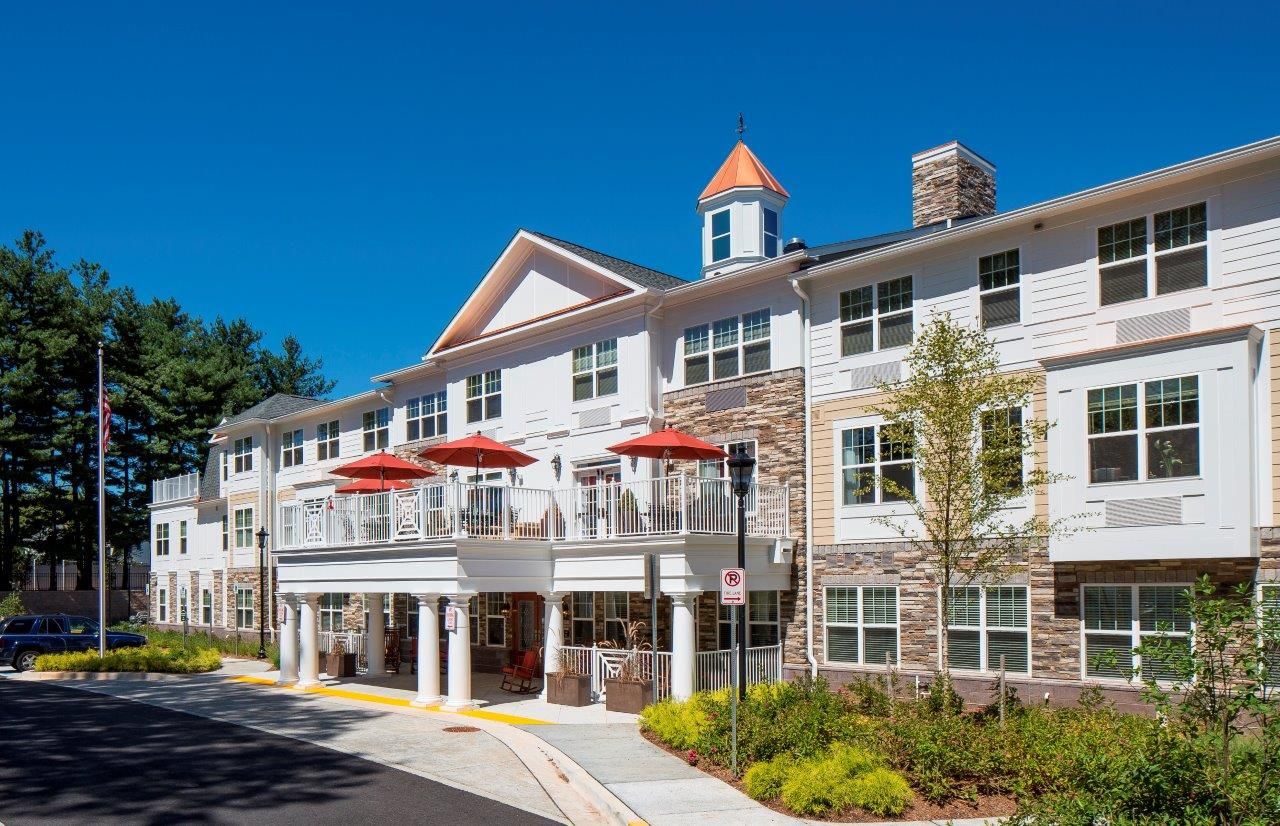
If you’re looking at Ingleside at King Farm in Rockville, you’re looking at a pretty well-organized facility. It’s located right in the King Farm neighborhood, and with a Walk Score of 73, it’s actually walkable; a rare and appreciated feature for a facility like this. Plus, it’s less than a mile and a half from Adventist HealthCare Shady Grove Medical Center, which is a major comfort factor if health needs shift suddenly.
The facility itself is a 45-bed building managed by the Westminster Ingleside King Farm team. They handle everything from nursing and assisted living to memory care and independent living, which is helpful because you don’t have to move if your care needs change. Their occupancy is at 92.2%, and the average stay is 139 days, suggesting they balance short-term rehab with long-term residents.
Most telling are the care hours: they provide 6 hours and 21 minutes of nursing care per resident every day. That’s a significant amount of attention for a facility this size. Kenya Bryant, the Executive Director, is currently working toward her license as a nursing home administrator, which adds another layer of professional oversight.
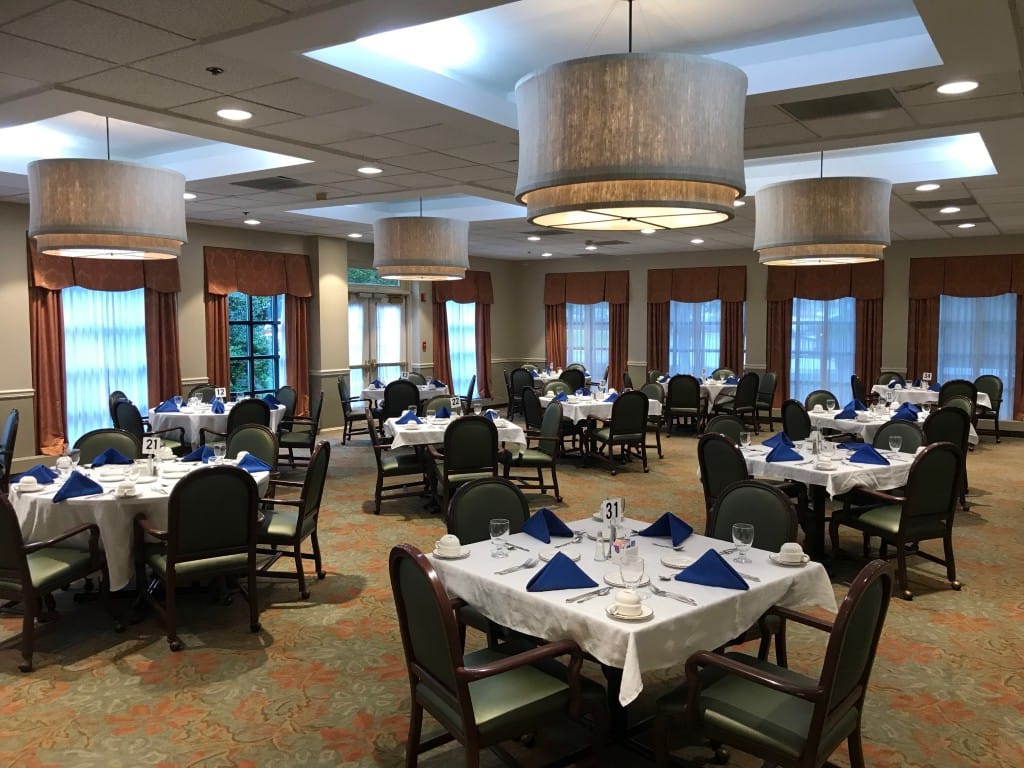
Financially, studios start at $3,638 per month, and you can scale up to $5,812 for a two-bedroom unit. They offer one-bedroom and one-bedroom-plus-den options in between, with units reaching up to 1,799 square feet. They accept both Medicare and private pay.
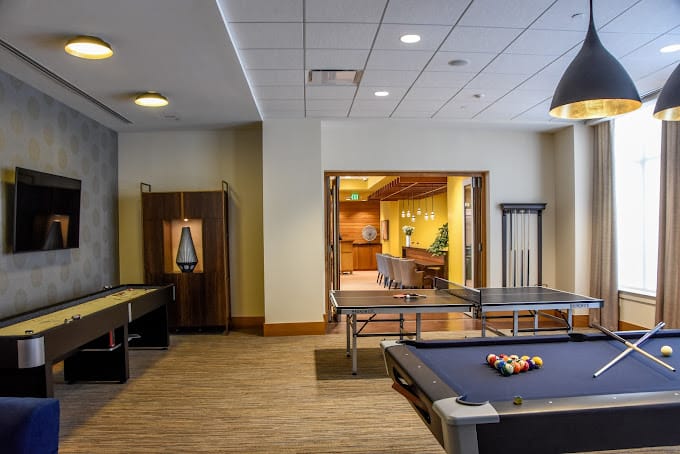
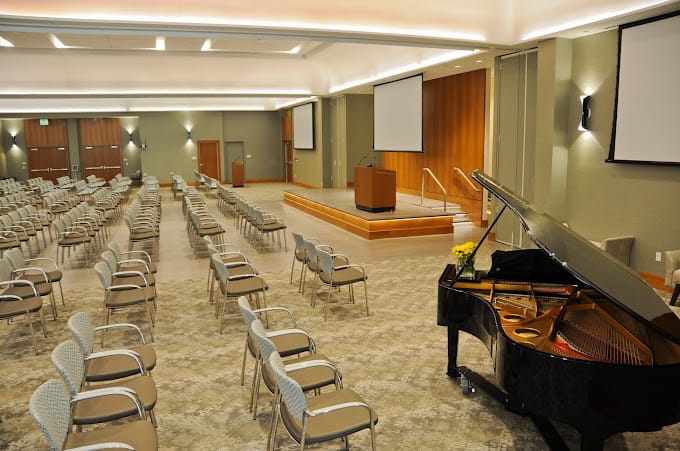
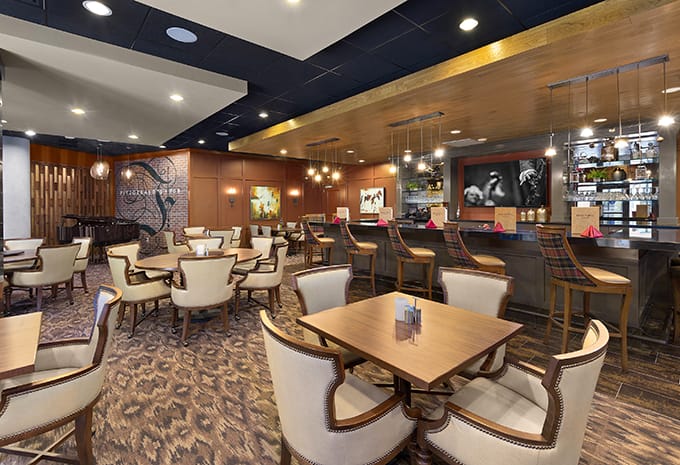
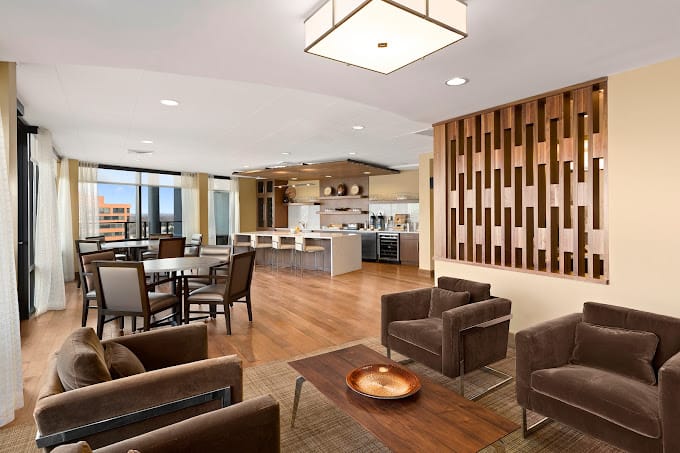
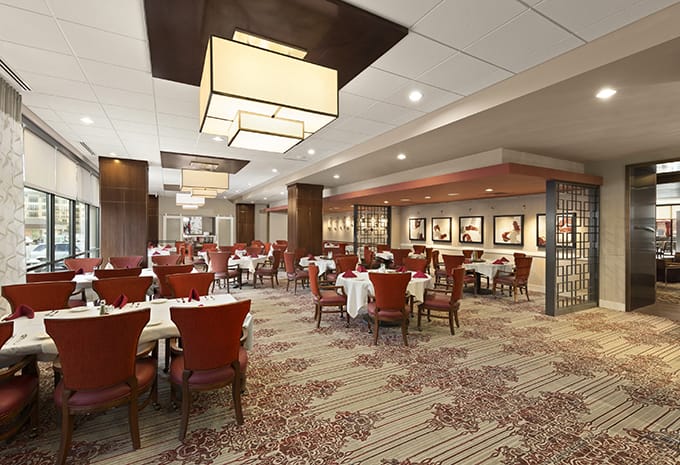
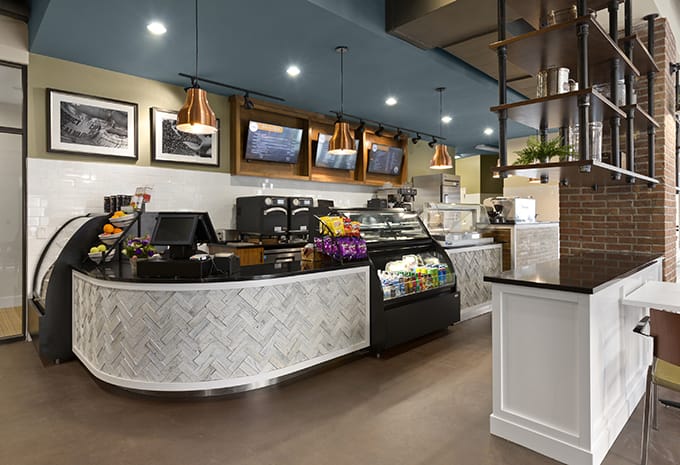
They have a heated indoor pool, a fitness center, and a cultural arts center. There’s an art studio, a library, and a dedicated meditation space. You’ll also find a coffee shop, a wellness center with an on-site doctor, and a courtyard with water features and a fire pit. It’s a pet-friendly community, and they even provide transportation and have a Social Day Program, which makes the whole living experience feel much more connected.
What really stands out, though, are the certifications. They have CARF accreditation, SageCare Platinum, and specific LGBTQ+ Long-Term Care Equality recognition. They’ve also landed on the “Great Place to Work” and “Fortune’s Best Workplaces in Aging Services” lists. If you’re prioritizing a place that has a full care continuum, keeps a dense amenity schedule, and has verified, institutional commitments to inclusive care, Ingleside is one of the more credible options in the Rockville area.
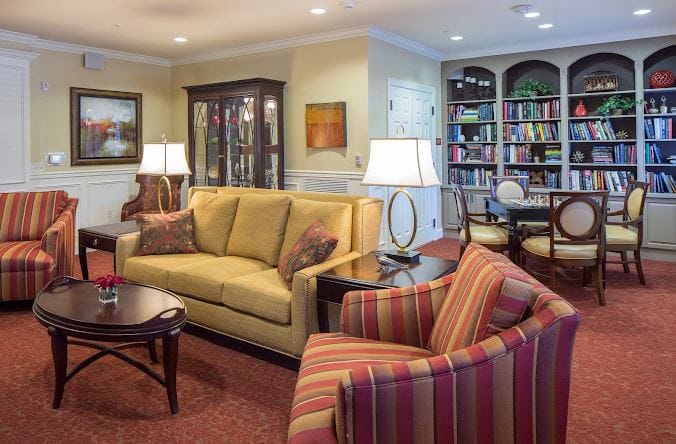
Revitz House is an esteemed community in the harmonious neighborhood of Montrose Road, North Bethesda, MD, offering independent living. With beautifully designed one-bedroom accommodations and round-the-clock concierge, residents’ comfort and convenience are guaranteed. The community’s convenient location near local amenities, combined with state-of-the-art amenities, ensures residents have easy access to their needs and wants.
Elevate your retirement with a fun-filled calendar of activities and engaging events, tailored to your enjoyment and wellness. With a personal emergency response system and a pet-friendly environment, the community strives to keep residents safe and happy. The community also collaborates with trusted care providers to meet residents’ healthcare needs. Live a blissful retirement amidst the community’s vibrant and inviting setting, while staying on a budget.
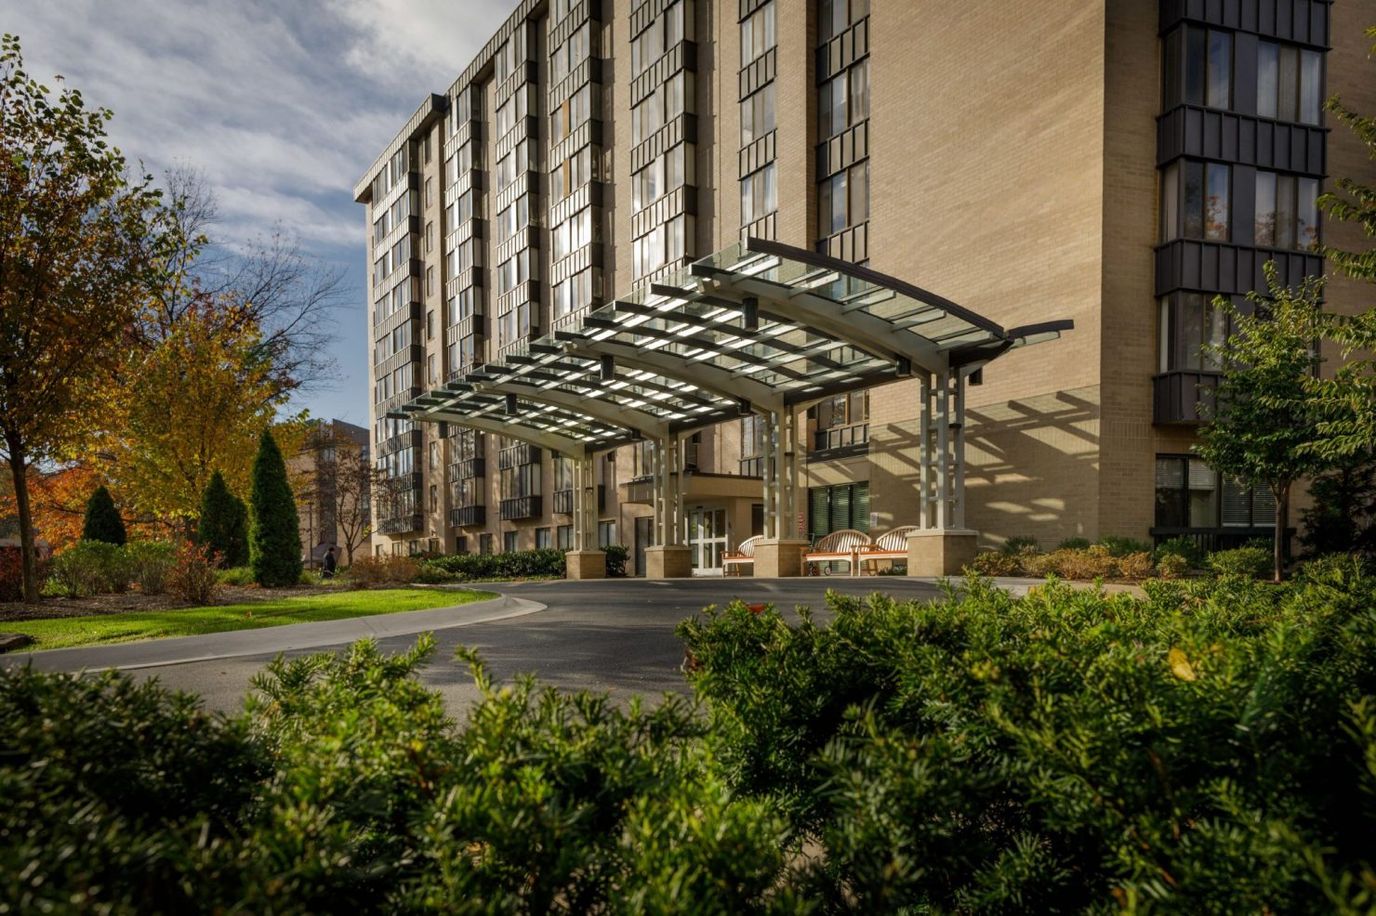
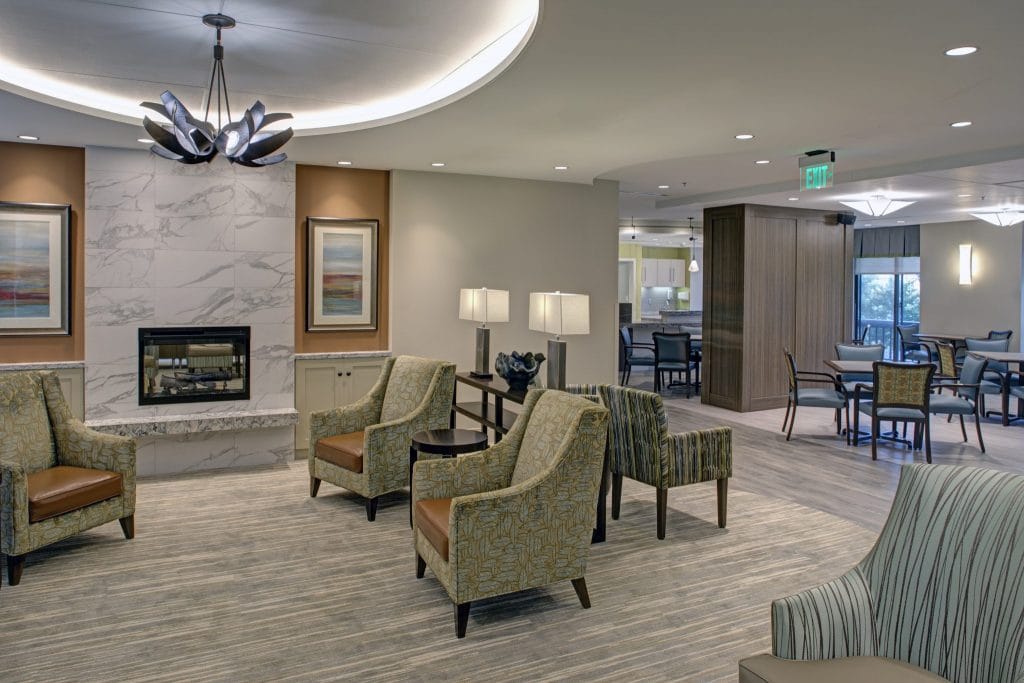
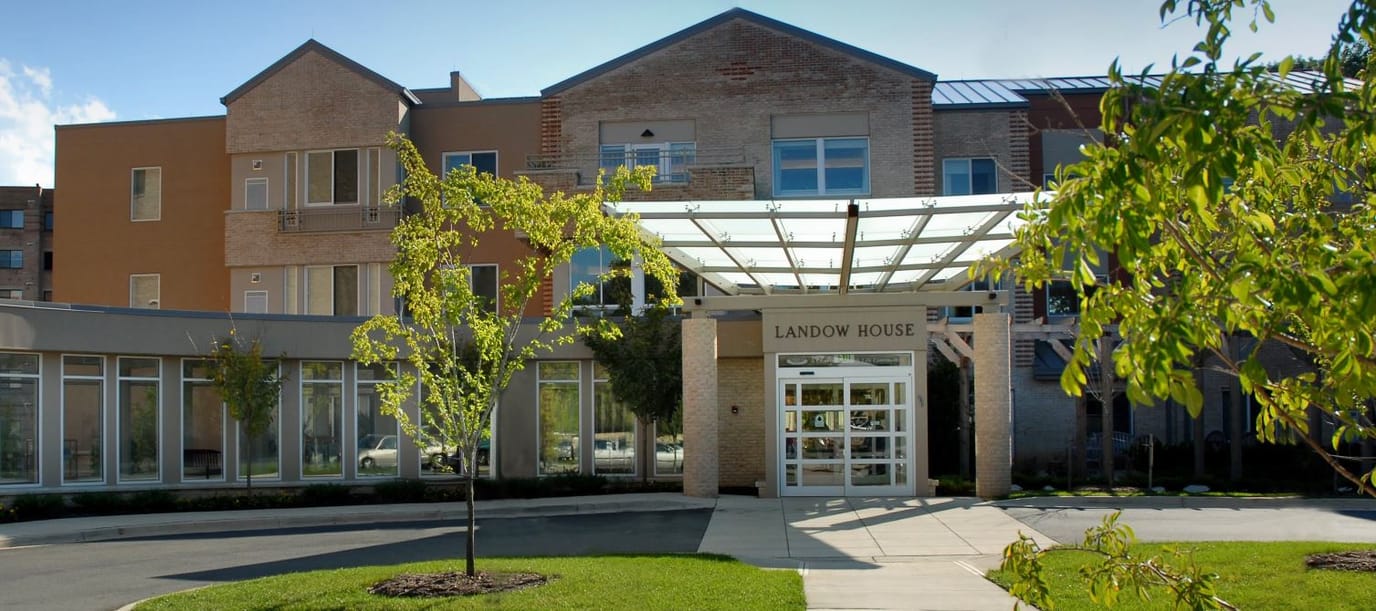
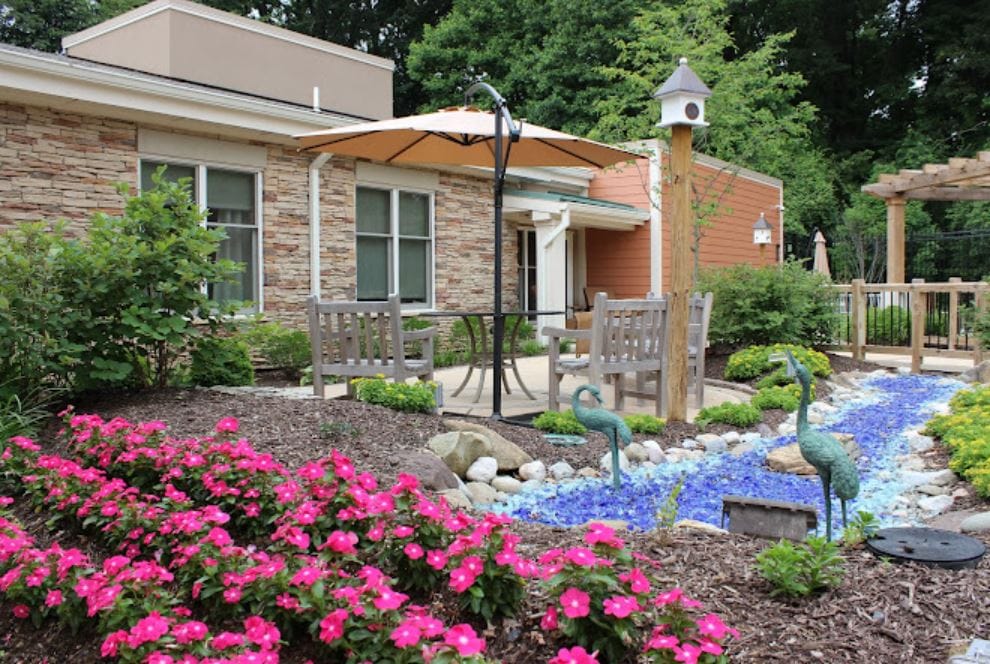
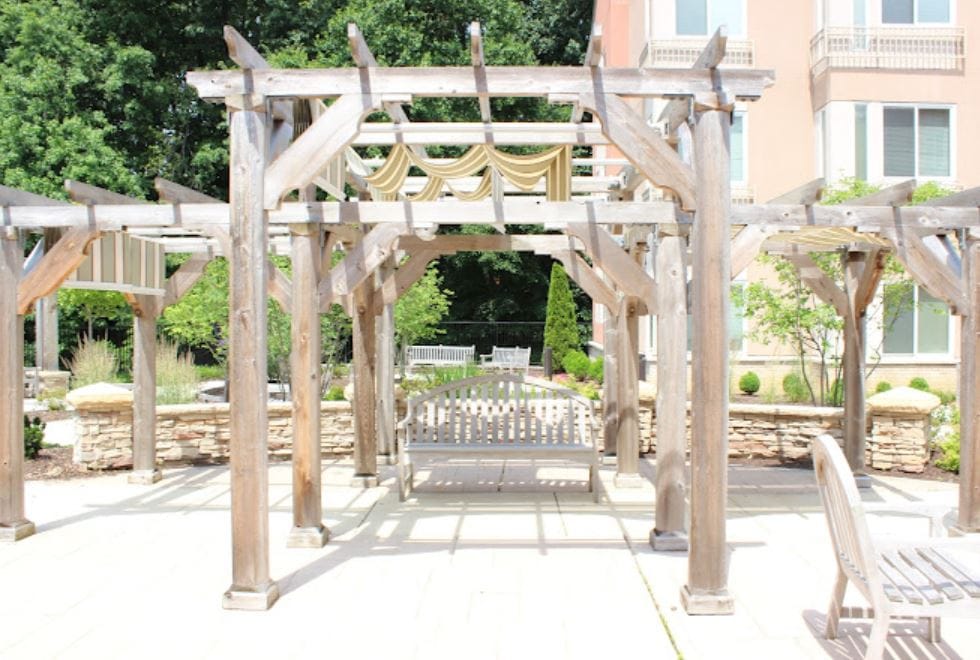
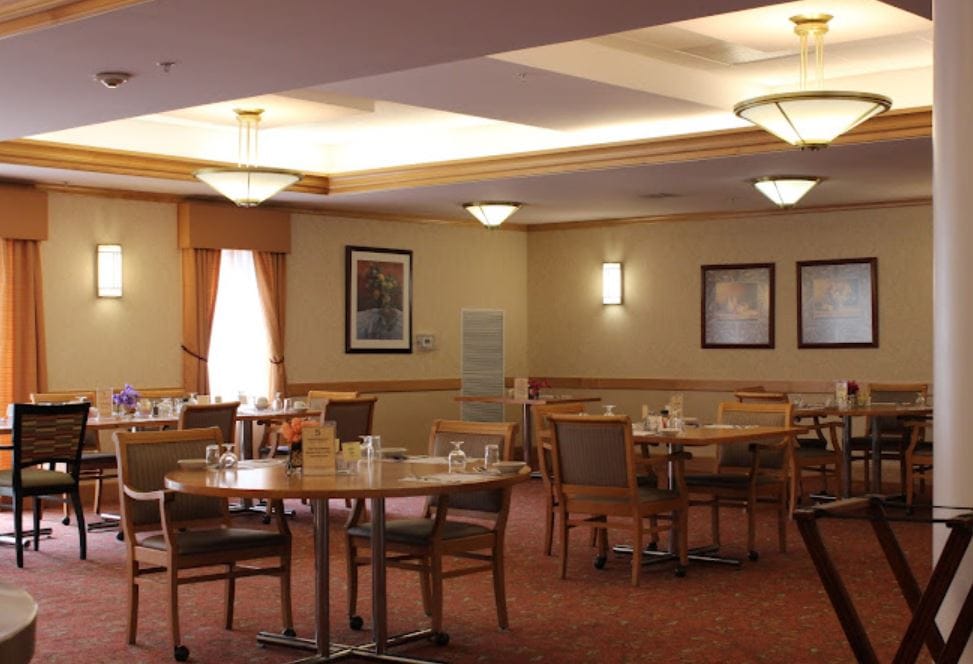
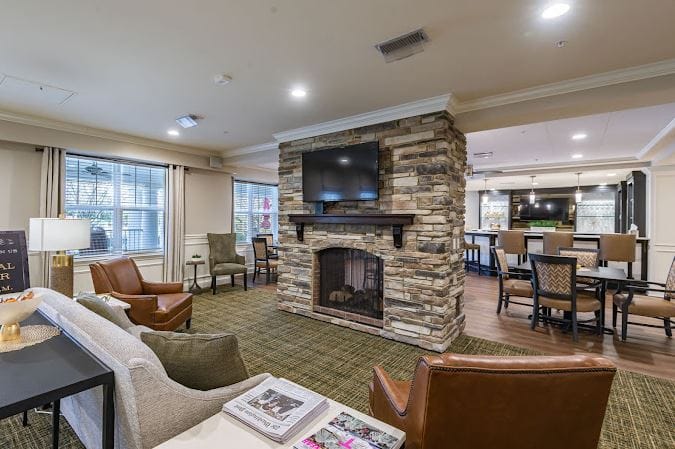
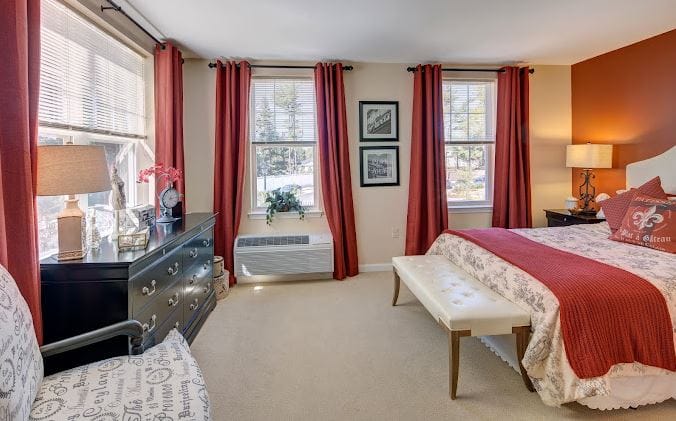
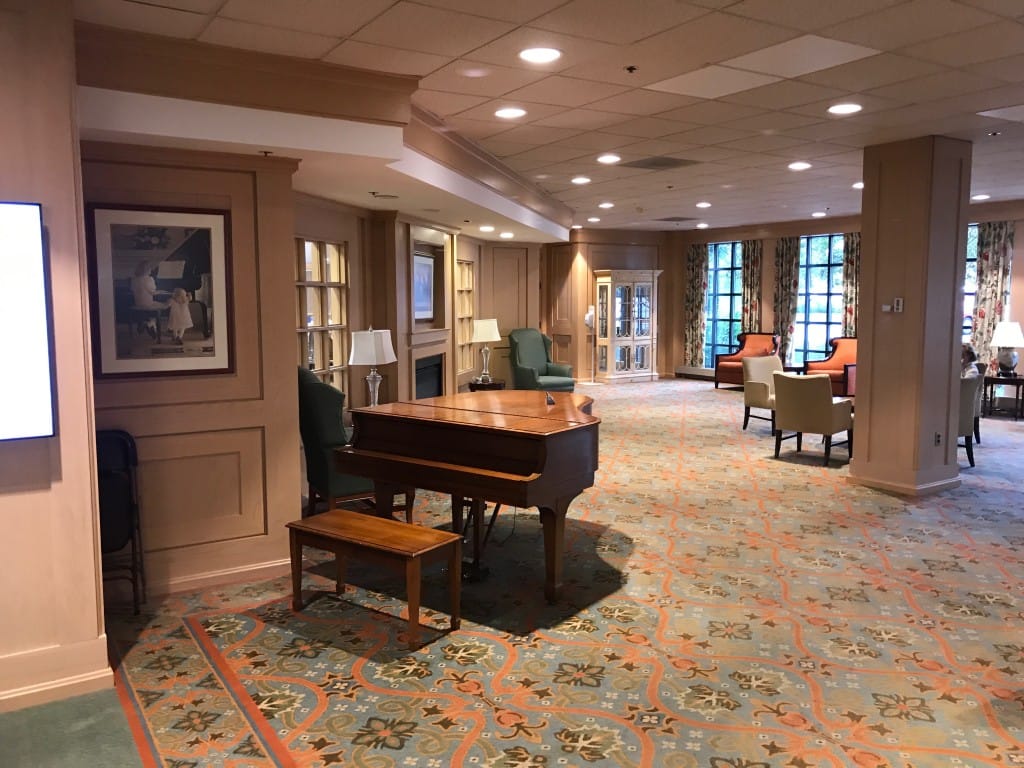
Nestled within the heart of Rockville, Maryland, Landow House stands as a haven where seniors can cherish their independence while residing in luxurious assisted living apartments. With a commitment to exceptional service, this residence offers daily assistance and provides a seamless blend of comfort and quality within its assisted living facilities. Here, residents find themselves immersed in a world of meaningful experiences that cater to their unique needs.
With the presence of an on-site licensed nurse available around the clock, as well as rigorous cleaning protocols for high-touch areas, the community fosters an environment of safety and reassurance. State-of-the-art amenities, including physical, occupational, and speech therapy services, further enhance the quality of life here. Physician services are conveniently offered on campus, and a diverse array of floor plans for assisted living apartments cater to individual preferences. From engaging leisure activities to delightful dining options, Landow House features a future movie theater, an inviting library, an art gallery, an outdoor garden, and more, creating a multi-awarded community that continues to exceed expectations in its commitment to excellence.
Set in the bustling city of Rockville, MD, Brightview West End is a dedicated senior living community that offers independent living, assisted living, memory care, or enhanced care for residents needing a higher level of care. Residents can comfortably enjoy their personal time in the comfort of beautifully designed apartments, ranging from deluxe studios to one and two bedroom apartments. The community makes residents’ lives much easier through their wide array of services, including 24-hour concierge services, housekeeping and maintenance.
At Brightview West End, residents stay connected with a wide range of activities and amenities. Residents enjoy spending their time playing cards, doing movie marathons with friends, or reading their favorite book at the comfort of their apartments. With emergency call systems, secured entry systems, and 24-hour on-site team members, residents have peace of mind knowing they are in a safe and secured environment.
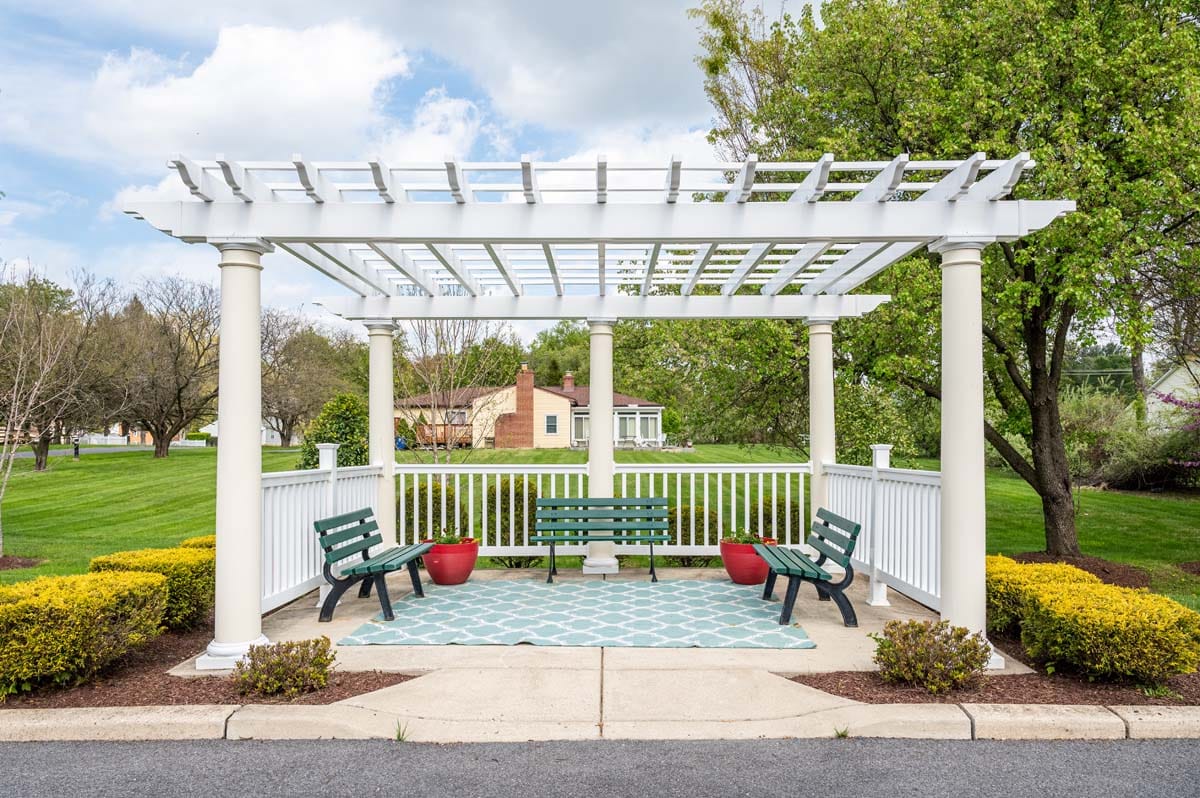
Located within the charming Rockville, Maryland, Brightview Fallsgrove offers a captivating blend of assisted living and memory care services, making it a beacon of exceptional care for seniors. Its enchanting surroundings are adorned with an on-site conservation area, highlighted by the presence of Rockville’s oldest tree, creating a tranquil atmosphere. Serenity beckons with winding walking paths, while the community boasts additional delights such as a cozy Café and a well-stocked library. The calendar brims with a myriad of engaging events, inviting residents to embrace a vibrant and fulfilling lifestyle. Notably, an on-site public art gallery adds an extra touch of cultural enrichment to the community’s offerings.
With a rich history spanning over two decades, Brightview Fallsgrove has become synonymous with trust and expertise in senior living. Its distinguished reputation is a testament to its enduring commitment to providing top-notch amenities and services, each designed to cater to the unique preferences of its cherished residents. From its stunning environment to its thoughtfully curated events and unwavering dedication to seniors’ well-being, Brightview Fallsgrove stands as a true haven of comfort, where every detail is carefully orchestrated to ensure a life enriched with fulfillment.
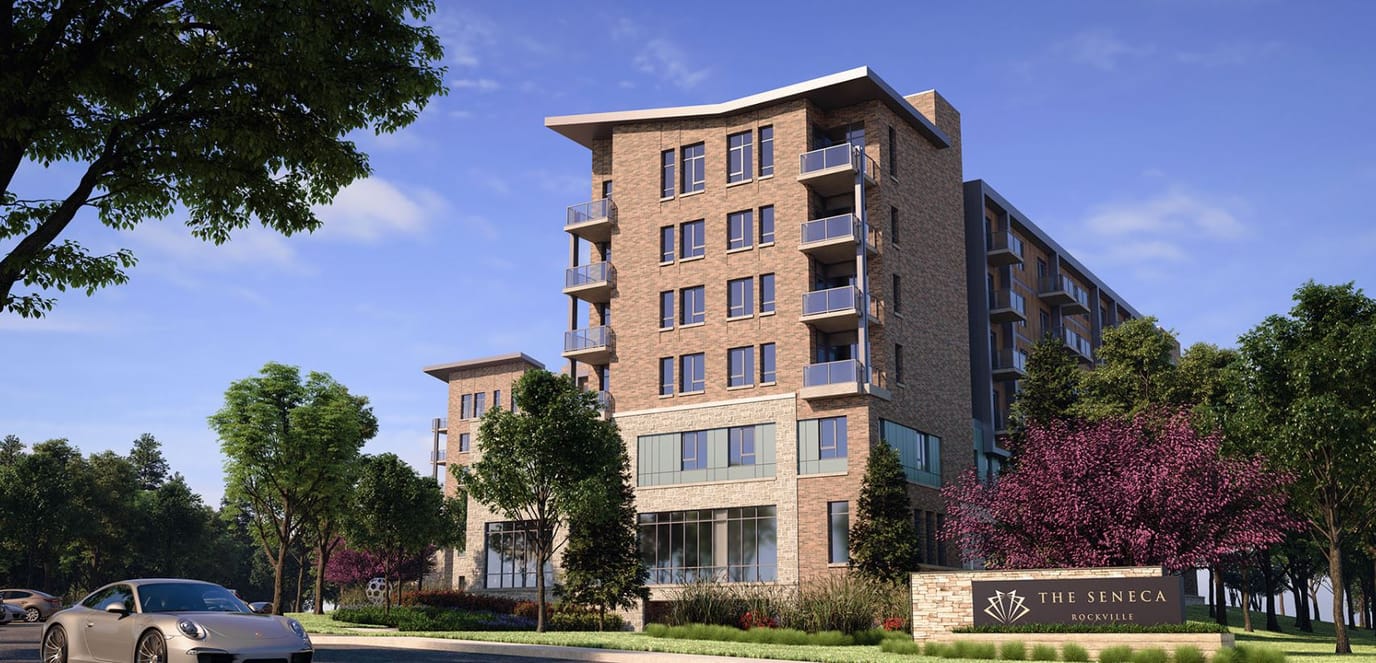
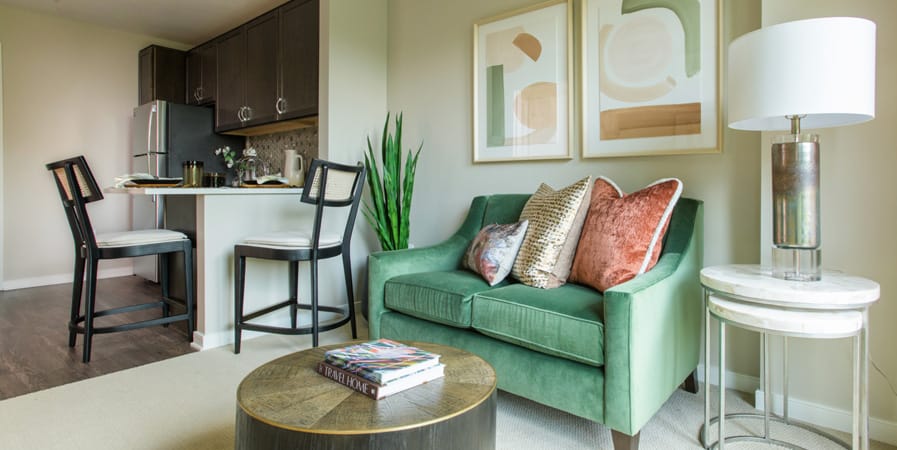
The Seneca Rockville is a lively Assisted Living and Memory Care community that warmly welcomes residents. Conveniently located in the heart of Montgomery County, it’s close to the renowned King Farm community and the tranquil King Farm Stream Valley Park. Nestled beside the serene park, The Seneca offers innovative senior living.
Senior residents get to experience the luxury of a rental community with exceptional hospitality. With a perfect balance of personalized support, residents can choose from Assisted Living, Bridge Program, or Memory Care living options. Every facet is meticulously designed to foster thriving, tailor-made for each individual. This assisted living community also offers expert-led programs, local culture, and personalized care.
Introducing Raphael House, where assisted living residents are embraced by an engaging and fulfilling lifestyle, surrounded by the familiarity and ease of home. With a dedication to providing comfort and convenience, Raphael House relieves residents of daily tasks, offering delectable meals and attentive housekeeping services. This thoughtful approach grants residents the freedom to connect with others, partake in recreational pursuits, or simply relish a moment with a captivating book.
Amid the tranquil surroundings of Raphael House in Rockville, Maryland, residents find reassurance in knowing that compassionate staff members are readily available to provide support whenever needed. Take on a journey of enriched living, where each day unfolds with possibilities and the comfort of a nurturing community.
Located in the serene neighborhood of Rockville, MD, AlfredHouse V is a warm and inviting senior living community that offers an array of care services, including personal care, assisted living, memory care, and respite care. The community features 16 carefully designed accommodations with spacious and inviting community spaces and beautiful architecture. Residents are guaranteed to enjoy personalized care and support thanks to the community’s dedicated caregivers and a standard 1:4 caregiver ratio.
A broad array of engaging daily activities and fitness programs are available to provide residents plenty of opportunities to live an active and fulfilling life. Residents are also provided access to amenities such as reading rooms and gardening spaces for relaxation and leisure. With round the clock team members and security, residents are able to live confidently knowing they are cared for in a safe and secure environment.
Age gracefully at Charles E. Smith Life Communities-Revitz House, a distinguished community located in the harmonious neighborhood of Rockville, MD, offering independent living. Beautifully designed one-bedroom floor plans are provided in a warm and welcoming environment, ensuring residents are comfortable and safe. A 24-hour concierge and a personal emergency response system are available for residents’ safety.
Residents will not run out of things to do, with plenty of recreational opportunities and engaging programs. Delightful dining options are also available, ensuring residents have the finest dining experience that caters to their dietary needs and preferences. Filled with state-of-the-art amenities and exceptional services, the community ensures residents have the finest retirement experience.
Ranking Methodology
How we rank these assisted living communities
Every community above is evaluated across six weighted categories using public data including state inspection records, review platforms, BBB profiles, and operator-published materials.
Weighting overview
- 35%Resident Experience
- 25%Regulatory
- 15%Visual Media
- 10%Website
- 10%Stability
- 5%Environment
01
Resident & Family Experience 35%
The single largest share of every ranking. Aggregated review sentiment and volume from major platforms — the closest signal to real resident experience.
- Includes
- Review Sentiment
- Review Volume
02
Regulatory & Safety Record 25%
State inspection records, citations, and complaint visits. We weight per-inspection rates more heavily than raw counts.
- Includes
- State Inspections
- Citations/Inspection
- % Inspections w/ Citations
- Complaint Visits
- Accreditations
- BBB Rating
03
Visual Media & Transparency 15%
Communities that publish high-quality visuals give families a real preview. No photos or tours = a negative transparency signal.
- Includes
- Video Tours
- Virtual Walkthroughs
- Photo Quantity
- Photo Quality
04
Website & Operator Transparency 10%
Site quality and whether the operator publishes basic accountability information — staff names, contact details, ownership.
- Includes
- Website Content
- Mobile Usability
- Staff Info Available
- Owner Info Available
05
Community Stability 10%
Operational signals indicating whether a community is well-run and meeting demand.
- Includes
- Occupancy Rate
- Bed Options
06
Environment & Pricing 5%
Walkability and pricing transparency. Walk Score is weighted higher for Independent Living than for Memory Care, where most residents do not leave unaccompanied.
- Includes
- Walk Score
- Pricing Transparency
Who we are
Your Senior Care Partner, Every Step of the Way
We help families find affordable senior communities and unlock same day discounts, Medicaid, and Medicare options tailored to your needs.
Contact us Today
Frequently Asked Questions about Assisted Living in Rockville, MD
What is the average cost of assisted living in Rockville, MD?
The average monthly cost of assisted living in Rockville, MD is approximately $6,300. Actual rates vary by community, level of care, and floorplan.
What is the price range for assisted living in Rockville, MD?
Assisted living in Rockville, MD typically ranges from $5,800–$8,400 per month, depending on the community, room type, and care needs.
What is the typical staff-to-resident ratio at assisted living facilities in Rockville, MD?
Assisted living facilities in Rockville, MD typically operate with a staff-to-resident ratio in the range of 1:6 to 1:12.
What's the difference between assisted living and memory care in Maryland?
Assisted living in Maryland supports residents with daily activities (bathing, dressing, medication management) while preserving independence. Memory care is a specialized form of assisted living for residents living with Alzheimer's or dementia, and adds 24/7 secured environments, dementia-trained staff, and structured routines designed to reduce confusion and wandering.
What's the difference between assisted living and a nursing home in Maryland?
Assisted living in Maryland is a residential model focused on housing, hospitality, and help with daily activities. Nursing homes (skilled nursing facilities) provide 24/7 medical care from licensed nurses for residents with significant health needs, and are regulated more strictly under both state and federal CMS rules.
Does Maryland Medicaid cover assisted living?
Maryland Medicaid does not directly pay room-and-board for assisted living, but most states (including Maryland) offer Home and Community-Based Services (HCBS) waivers that can offset the cost of care services delivered inside a licensed community. Eligibility, waitlists, and covered services vary — check directly with the state Medicaid agency.
What is assisted living?
Assisted living combines private or semi-private apartments with help on activities of daily living (meals, bathing, dressing, medication management) and a social calendar — for residents who need some support but do not need 24/7 medical care.
Updated on
