Compare Independent Living around Baltimore (Metro Area)
| Pickersgill Retirement Community | IL AL NH SNF | Baltimore (Chestnut Hill) | 138
Facility
138
MD AVG
43
Rank
#58 / 697 | No |
45
Facility
45
MD AVG
43
Rank
#475 / 985 | - | - | A+ |
24% Male Residents — State Benchmarked 24% of residents are male, compared to the Maryland average of 31%. This facility caters to a majority female resident pool (76% female), consistent with the broader assisted living trend where women significantly outnumber men. |
76% Female Residents — State Benchmarked 76% of residents are female, compared to the Maryland average of 69%. Women comprise the large majority, consistent with national assisted living demographics where women live longer and enter care facilities at higher rates. |
95% White Residents — State Benchmarked 95% of residents are reported as White, compared to the Maryland average of 81%. A higher White share than is typical for assisted living in Maryland in this dataset — compare with peer facilities for local context. |
4% Other Ethnicity Residents — State Benchmarked 4% of residents fall into categories other than White or African American (combined), compared to the Maryland average of 6%. This column aggregates Hispanic, Asian, multiracial, and any other labeled groups that are not classified as White or African American. Reported subgroups in this total: Asian (4%). |
3% Residents Age 65–74 — State Benchmarked 3% of residents are 65–74, compared to the Maryland average of 13%. Fewer younger seniors suggests the resident population skews older, likely requiring higher acuity care and more hands-on support. |
27% Residents Age 75–84 — State Benchmarked 27% of residents are 75–84, compared to the Maryland average of 31%. This is the second most common age bracket in assisted living, representing residents with moderate care needs. |
55% Residents Age 85–94 — State Benchmarked 55% of residents are 85–94, compared to the Maryland average of 44%. A high concentration of very elderly residents signals a higher-acuity facility with experience caring for advanced age-related needs. |
15% Residents Age 95+ — State Benchmarked 15% of residents are 95 or older, compared to the Maryland average of 16%. In line with the statewide profile for the oldest resident bracket. |
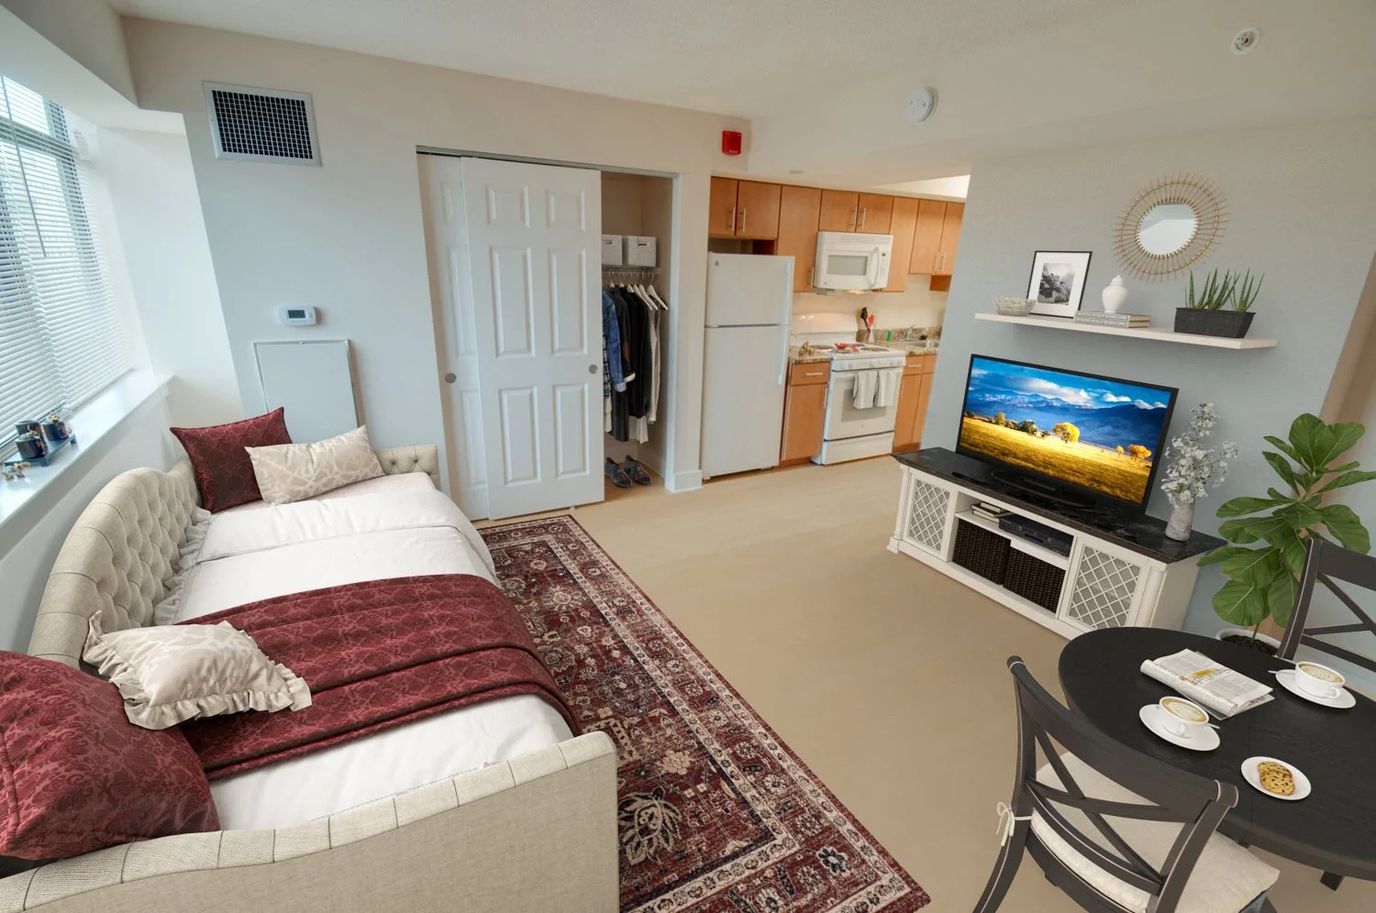
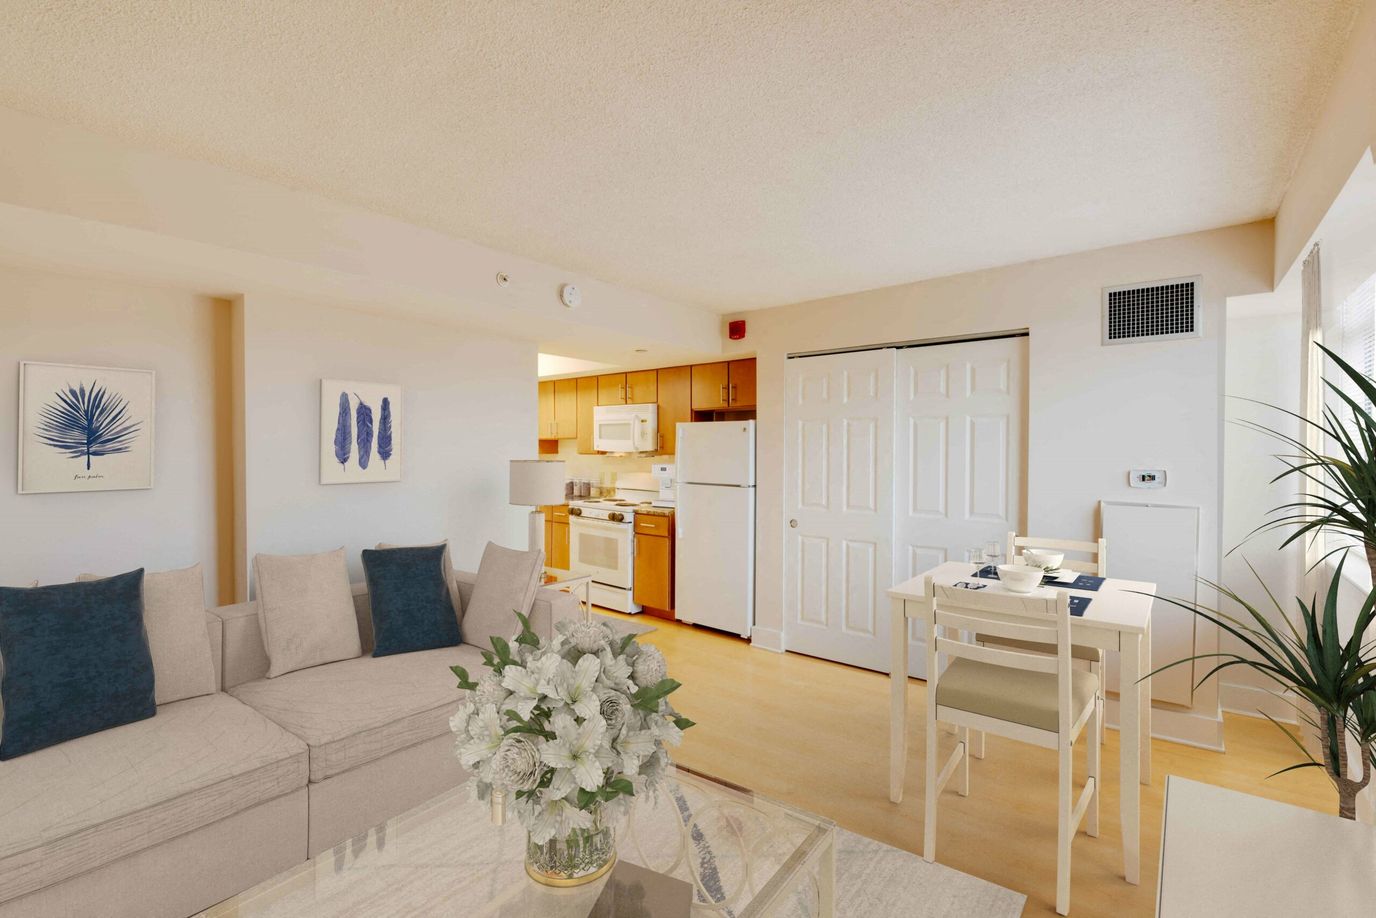
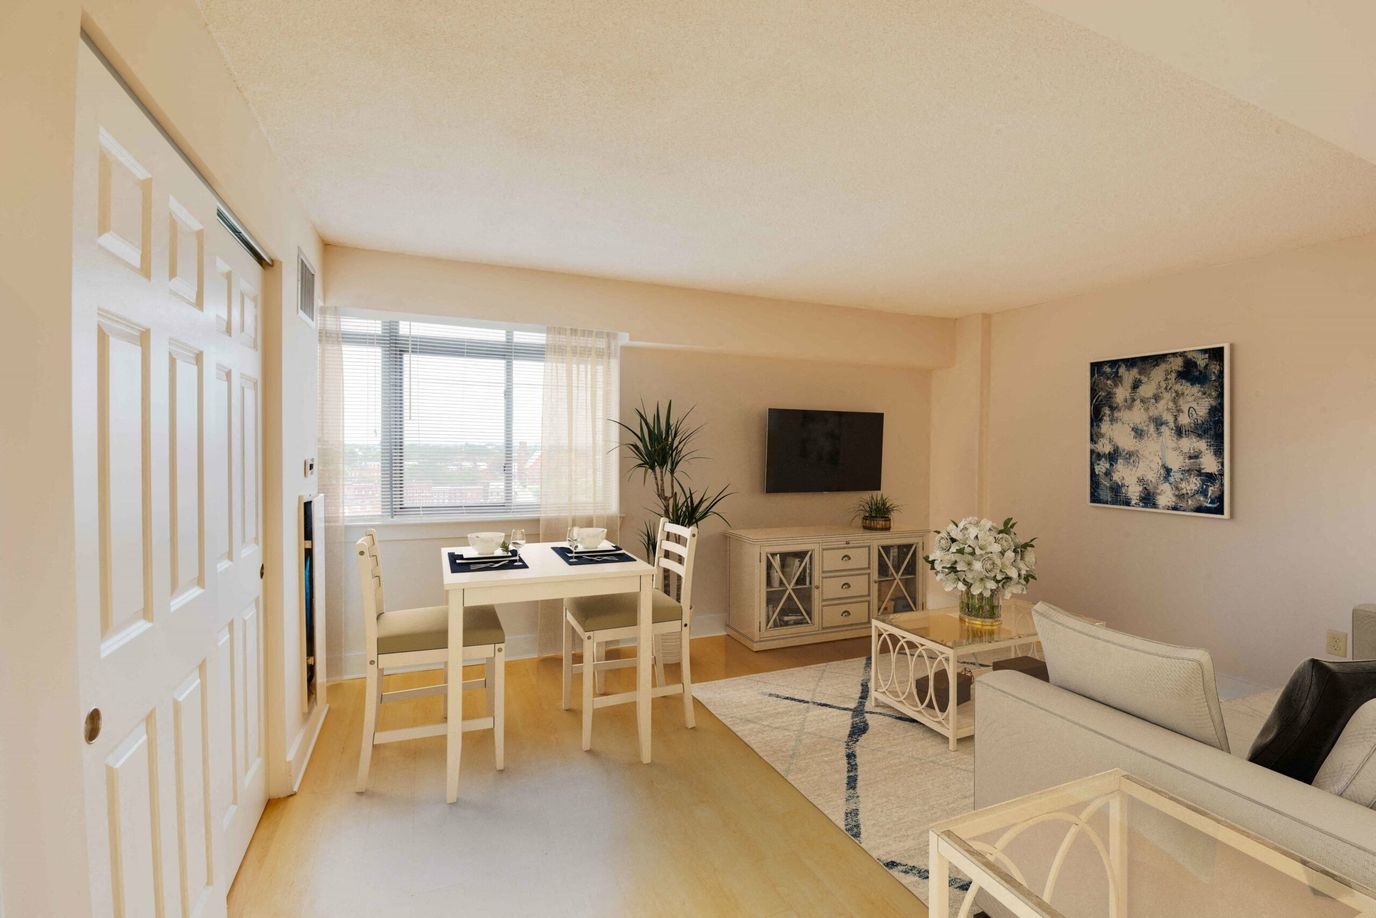
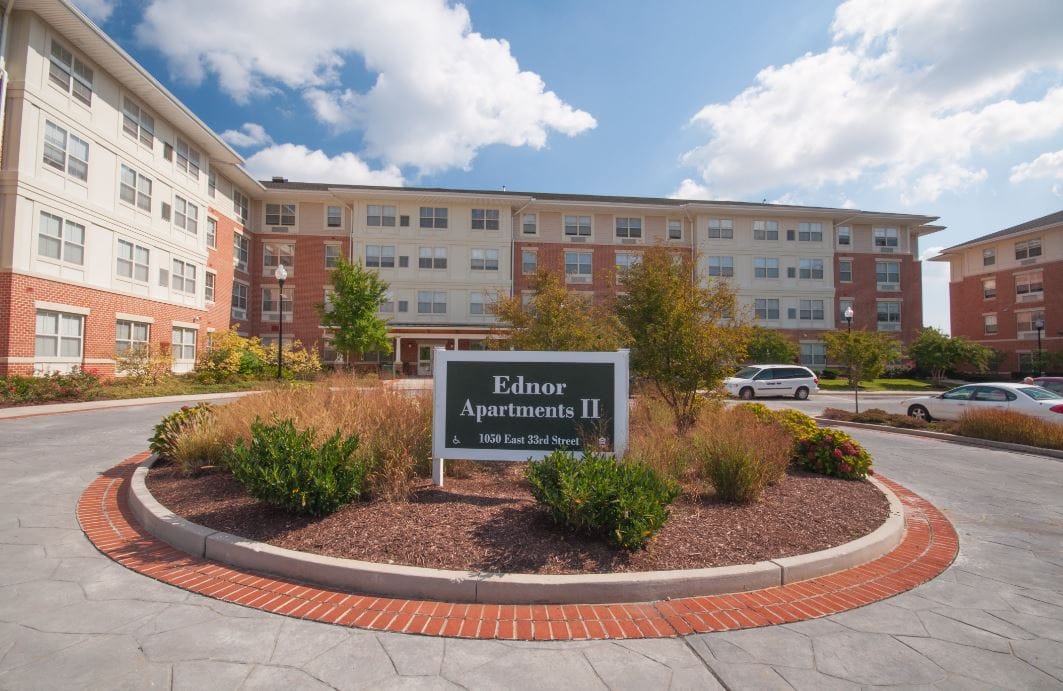
| Ednor Apartments II | IL NH | Baltimore (Ednor Gardens-Lakeside) | 49
Facility
49
MD AVG
43
Rank
#226 / 697 | Yes |
69
Facility
69
MD AVG
43
Rank
#199 / 985 | 1 Bed / 2 Bed | - | - | - | - | - | - | - | - | - | - |
| Resorts of Augsburg | IL AL NH SNF | Baltimore (Gwynn Oak) | 131
Facility
131
MD AVG
43
Rank
#64 / 697 | No |
18
Facility
18
MD AVG
43
Rank
#756 / 985 | Studio / 1 Bed / 2 Bed | - | - | - | - | - | - | - | - | - | - |
| Heritage at Augsburg Independent Living | IL NH | Baltimore (Gwynn Oak) | 131
Facility
131
MD AVG
43
Rank
#64 / 697 | No |
16
Facility
16
MD AVG
43
Rank
#772 / 985 | - | - | - | - | - | - | - | - | - | - | - |
| Brightview Mays Chapel Ridge | IL AL MC | Timonium (Dixon Hill) | 89
Facility
89
MD AVG
43
Rank
#160 / 697 | No |
52
Facility
52
MD AVG
43
Rank
#402 / 985 | Studio / 1 Bed / 2 Bed | 50
Facility
50
MD AVG
21
Rank
#1 / 208 | A+ |
13% Male Residents — State Benchmarked 13% of residents are male, compared to the Maryland average of 31%. This facility caters to a majority female resident pool (87% female), consistent with the broader assisted living trend where women significantly outnumber men. |
87% Female Residents — State Benchmarked 87% of residents are female, compared to the Maryland average of 69%. Women comprise the large majority, consistent with national assisted living demographics where women live longer and enter care facilities at higher rates. |
99% White Residents — State Benchmarked 99% of residents are reported as White, compared to the Maryland average of 81%. A higher White share than is typical for assisted living in Maryland in this dataset — compare with peer facilities for local context. |
1% Other Ethnicity Residents — State Benchmarked 1% of residents fall into categories other than White or African American (combined), compared to the Maryland average of 6%. This column aggregates Hispanic, Asian, multiracial, and any other labeled groups that are not classified as White or African American. Reported subgroups in this total: Asian (1%). |
3% Residents Age 65–74 — State Benchmarked 3% of residents are 65–74, compared to the Maryland average of 13%. Fewer younger seniors suggests the resident population skews older, likely requiring higher acuity care and more hands-on support. |
30% Residents Age 75–84 — State Benchmarked 30% of residents are 75–84, compared to the Maryland average of 31%. This is the second most common age bracket in assisted living, representing residents with moderate care needs. |
48% Residents Age 85–94 — State Benchmarked 48% of residents are 85–94, compared to the Maryland average of 44%. This is typically the most common age bracket in assisted living — this facility is in line with the statewide norm. |
18% Residents Age 95+ — State Benchmarked 18% of residents are 95 or older, compared to the Maryland average of 16%. In line with the statewide profile for the oldest resident bracket. |
| Springwell Senior Living Community | IL AL MC | Baltimore (West Rogers Avenue) | 151
Facility
151
MD AVG
43
Rank
#45 / 697 | No |
30
Facility
30
MD AVG
43
Rank
#627 / 985 | Studio / 1 Bed / 2 Bed | - | A+ |
20% Male Residents — State Benchmarked 20% of residents are male, compared to the Maryland average of 31%. This facility caters to a majority female resident pool (80% female), consistent with the broader assisted living trend where women significantly outnumber men. |
80% Female Residents — State Benchmarked 80% of residents are female, compared to the Maryland average of 69%. Women comprise the large majority, consistent with national assisted living demographics where women live longer and enter care facilities at higher rates. |
91% White Residents — State Benchmarked 91% of residents are reported as White, compared to the Maryland average of 81%. A higher White share than is typical for assisted living in Maryland in this dataset — compare with peer facilities for local context. |
3% Other Ethnicity Residents — State Benchmarked 3% of residents fall into categories other than White or African American (combined), compared to the Maryland average of 6%. This column aggregates Hispanic, Asian, multiracial, and any other labeled groups that are not classified as White or African American. Reported subgroups in this total: Hispanic (2%), Asian (1%). |
8% Residents Age 65–74 — State Benchmarked 8% of residents are 65–74, compared to the Maryland average of 13%. Fewer younger seniors suggests the resident population skews older, likely requiring higher acuity care and more hands-on support. |
30% Residents Age 75–84 — State Benchmarked 30% of residents are 75–84, compared to the Maryland average of 31%. This is the second most common age bracket in assisted living, representing residents with moderate care needs. |
45% Residents Age 85–94 — State Benchmarked 45% of residents are 85–94, compared to the Maryland average of 44%. This is typically the most common age bracket in assisted living — this facility is in line with the statewide norm. |
15% Residents Age 95+ — State Benchmarked 15% of residents are 95 or older, compared to the Maryland average of 16%. In line with the statewide profile for the oldest resident bracket. |
| Viva Senior Living at Cockeysville | IL AL MC RC | Cockeysville (Knoll Brook) | 32
Facility
32
MD AVG
43
Rank
#250 / 697 | Yes |
44
Facility
44
MD AVG
43
Rank
#489 / 985 | Private / Companion Suite | - | A+ | - | - | - | - | - | - | - | - |
| Brightview Westminster Ridge | IL AL MC | Westminster (Brightview Westminster Ridge) | 75
Facility
75
MD AVG
43
Rank
#186 / 697 | No |
30
Facility
30
MD AVG
43
Rank
#627 / 985 | 1 Bed / 2 Bed | 20
Facility
20
MD AVG
21
Rank
#111 / 208 | - |
17% Male Residents — State Benchmarked 17% of residents are male, compared to the Maryland average of 31%. This facility caters to a majority female resident pool (83% female), consistent with the broader assisted living trend where women significantly outnumber men. |
83% Female Residents — State Benchmarked 83% of residents are female, compared to the Maryland average of 69%. Women comprise the large majority, consistent with national assisted living demographics where women live longer and enter care facilities at higher rates. |
98% White Residents — State Benchmarked 98% of residents are reported as White, compared to the Maryland average of 81%. A higher White share than is typical for assisted living in Maryland in this dataset — compare with peer facilities for local context. |
2% Other Ethnicity Residents — State Benchmarked 2% of residents fall into categories other than White or African American (combined), compared to the Maryland average of 6%. This column aggregates Hispanic, Asian, multiracial, and any other labeled groups that are not classified as White or African American. Reported subgroups in this total: Other (2%). |
3% Residents Age 65–74 — State Benchmarked 3% of residents are 65–74, compared to the Maryland average of 13%. Fewer younger seniors suggests the resident population skews older, likely requiring higher acuity care and more hands-on support. |
17% Residents Age 75–84 — State Benchmarked 17% of residents are 75–84, compared to the Maryland average of 31%. Below the state norm — the resident mix may skew either younger or older than this typical middle bracket. |
67% Residents Age 85–94 — State Benchmarked 67% of residents are 85–94, compared to the Maryland average of 44%. A high concentration of very elderly residents signals a higher-acuity facility with experience caring for advanced age-related needs. |
10% Residents Age 95+ — State Benchmarked 10% of residents are 95 or older, compared to the Maryland average of 16%. Most residents here have not yet reached the oldest-old bracket, suggesting a younger overall community. |
| Brightview Perry Hall | IL AL MC | Nottingham | 70
Facility
70
MD AVG
43
Rank
#191 / 697 | No |
22
Facility
22
MD AVG
43
Rank
#719 / 985 | Studio / 1 Bed / 2 Bed | 12
Facility
12
MD AVG
21
Rank
#151 / 208 | - |
21% Male Residents — State Benchmarked 21% of residents are male, compared to the Maryland average of 31%. This facility caters to a majority female resident pool (79% female), consistent with the broader assisted living trend where women significantly outnumber men. |
79% Female Residents — State Benchmarked 79% of residents are female, compared to the Maryland average of 69%. Women comprise the large majority, consistent with national assisted living demographics where women live longer and enter care facilities at higher rates. |
97% White Residents — State Benchmarked 97% of residents are reported as White, compared to the Maryland average of 81%. A higher White share than is typical for assisted living in Maryland in this dataset — compare with peer facilities for local context. |
3% Other Ethnicity Residents — State Benchmarked 3% of residents fall into categories other than White or African American (combined), compared to the Maryland average of 6%. This column aggregates Hispanic, Asian, multiracial, and any other labeled groups that are not classified as White or African American. Reported subgroups in this total: Asian (2%), Hawaiian/Pacific Islander (2%). |
3% Residents Age 65–74 — State Benchmarked 3% of residents are 65–74, compared to the Maryland average of 13%. Fewer younger seniors suggests the resident population skews older, likely requiring higher acuity care and more hands-on support. |
54% Residents Age 75–84 — State Benchmarked 54% of residents are 75–84, compared to the Maryland average of 31%. A high concentration in this mid-range bracket, where residents typically need moderate support with daily activities. |
37% Residents Age 85–94 — State Benchmarked 37% of residents are 85–94, compared to the Maryland average of 44%. The population here skews younger than the statewide norm, which may indicate a more active, lower-acuity community. |
6% Residents Age 95+ — State Benchmarked 6% of residents are 95 or older, compared to the Maryland average of 16%. Most residents here have not yet reached the oldest-old bracket, suggesting a younger overall community. |
| Brightview Avondell | IL AL | Bel Air (West Ring Factory Road) | 36
Facility
36
MD AVG
43
Rank
#244 / 697 | Yes |
19
Facility
19
MD AVG
43
Rank
#746 / 985 | Studio / 1 Bed / 2 Bed | 19
Facility
19
MD AVG
21
Rank
#116 / 208 | - |
31% Male Residents — State Benchmarked 31% of residents are male, compared to the Maryland average of 31%. This facility caters to a majority female resident pool (69% female), consistent with the broader assisted living trend where women significantly outnumber men. |
69% Female Residents — State Benchmarked 69% of residents are female, compared to the Maryland average of 69%. Women comprise the large majority, consistent with national assisted living demographics where women live longer and enter care facilities at higher rates. |
96% White Residents — State Benchmarked 96% of residents are reported as White, compared to the Maryland average of 81%. A higher White share than is typical for assisted living in Maryland in this dataset — compare with peer facilities for local context. |
4% Other Ethnicity Residents — State Benchmarked 4% of residents fall into categories other than White or African American (combined), compared to the Maryland average of 6%. This column aggregates Hispanic, Asian, multiracial, and any other labeled groups that are not classified as White or African American. Reported subgroups in this total: Asian (4%). | - |
12% Residents Age 75–84 — State Benchmarked 12% of residents are 75–84, compared to the Maryland average of 31%. Below the state norm — the resident mix may skew either younger or older than this typical middle bracket. |
77% Residents Age 85–94 — State Benchmarked 77% of residents are 85–94, compared to the Maryland average of 44%. A high concentration of very elderly residents signals a higher-acuity facility with experience caring for advanced age-related needs. |
12% Residents Age 95+ — State Benchmarked 12% of residents are 95 or older, compared to the Maryland average of 16%. In line with the statewide profile for the oldest resident bracket. |
| Brightview Hunt Valley | IL AL MC | Cockeysville (Hunt Valley) | 95
Facility
95
MD AVG
43
Rank
#145 / 697 | No |
49
Facility
49
MD AVG
43
Rank
#431 / 985 | Studio / 1 Bed / 2 Bed | - | - | - | - | - | - | - | - | - | - |
| Mabel‘s House | IL AL MC RC | Gwynn Oak (Central Forest Park) | 8
Facility
8
MD AVG
43
Rank
#436 / 697 | No |
70
Facility
70
MD AVG
43
Rank
#184 / 985 | Private / Semi-Private Rooms | - | - | - | - | - | - | - | - | - | - |
| Linden Park Apartments | IL | Baltimore (Bolton Hill) | - | Yes |
87
Facility
87
MD AVG
43
Rank
#46 / 985 | Studio / 1 Bed / 2 Bed | - | - | - | - | - | - | - | - | - | - |
| Weinberg Woods | IL | Baltimore (Cheswolde) | - | Yes |
36
Facility
36
MD AVG
43
Rank
#563 / 985 | 1 Bed | - | - | - | - | - | - | - | - | - | - |
Brightview Avondell undoubtedly provides the highest care for independent living, assisted living, and memory care support in Bel Air South in Maryland. Management makes it a point that seniors are given the freedom and choice given to each resident and ensures that they attend to the unique needs of each individual with kindness and compassion. The premier retirement community strives to satisfy the holistic wellness of its residents in a cozy, nurturing, and fun-filled environment.
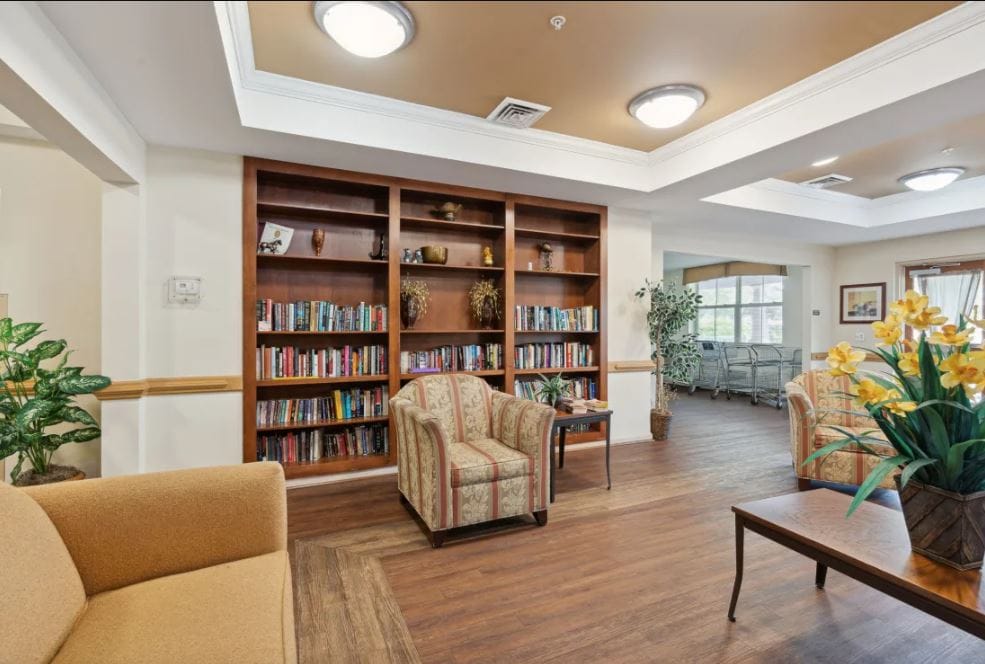
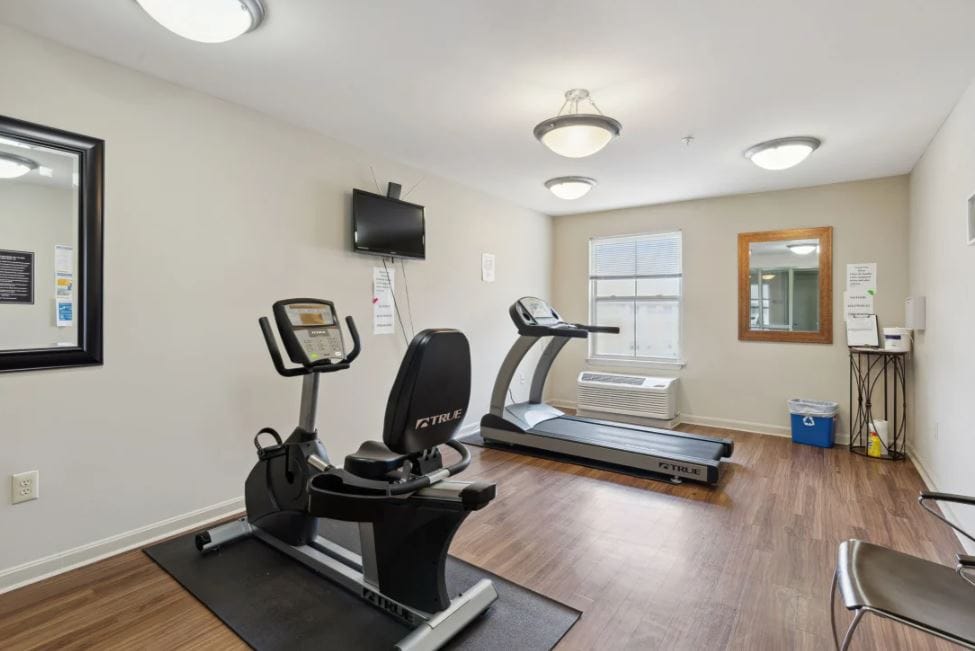
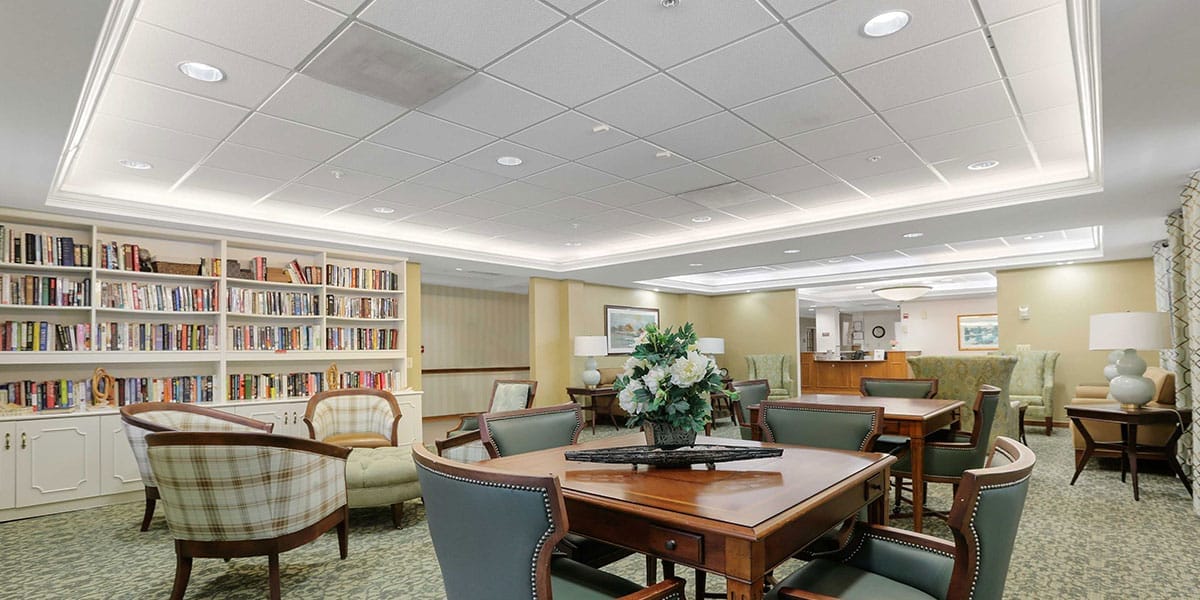
Brightview Avondell’s residential lifestyle encourages its seniors to live a fulfilling everyday life through the community’s extensive services. Some all-inclusive features include ALDs, medication management, specialized memory care programs, housekeeping, and laundry services tailored to their unique needs. Other amenities include a library, full baths, a cafe, a fitness center, and a multi-purpose room– to name a few of what the home offers.
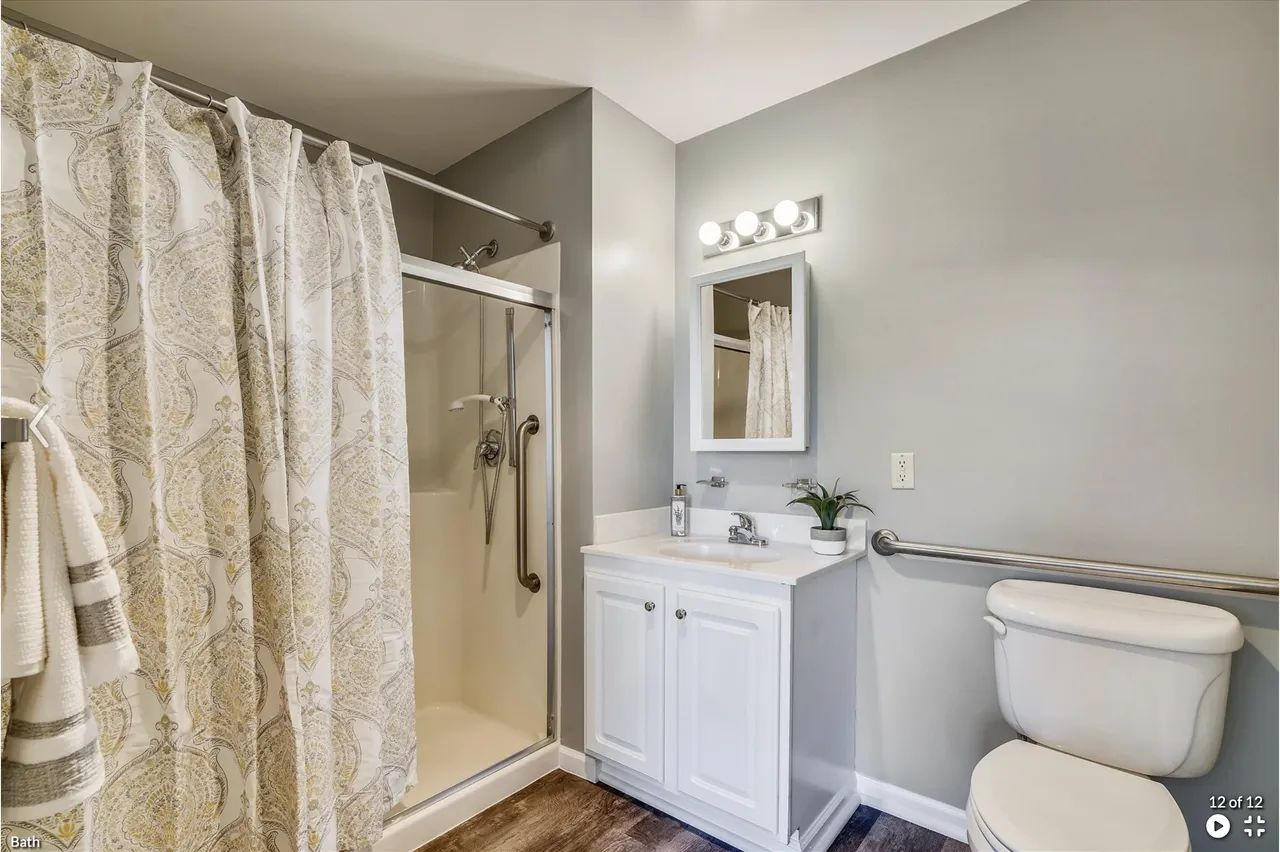
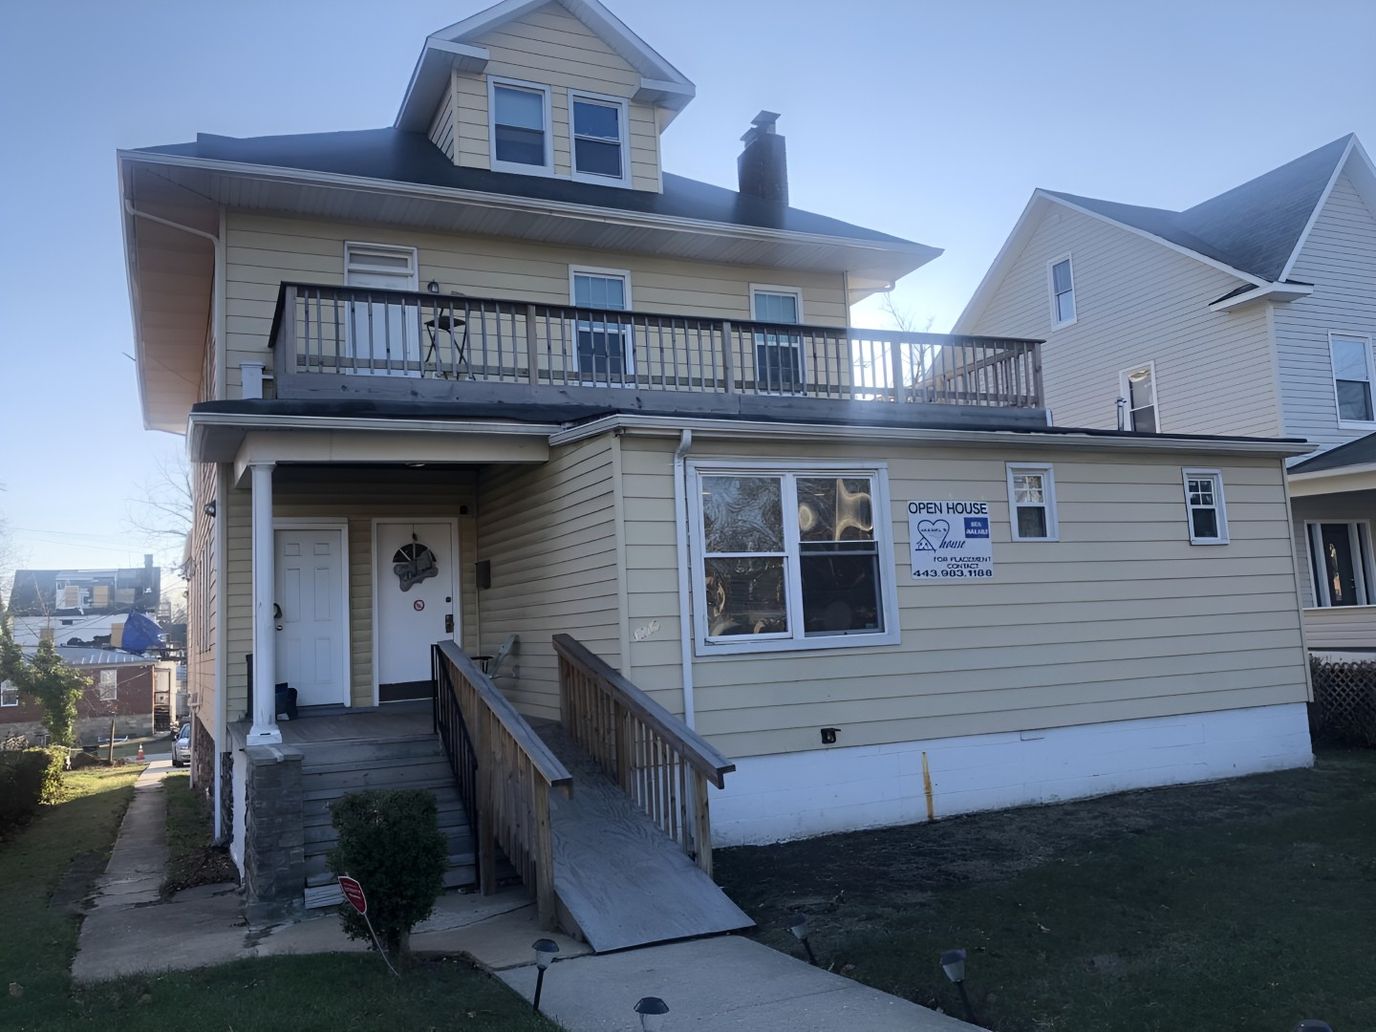
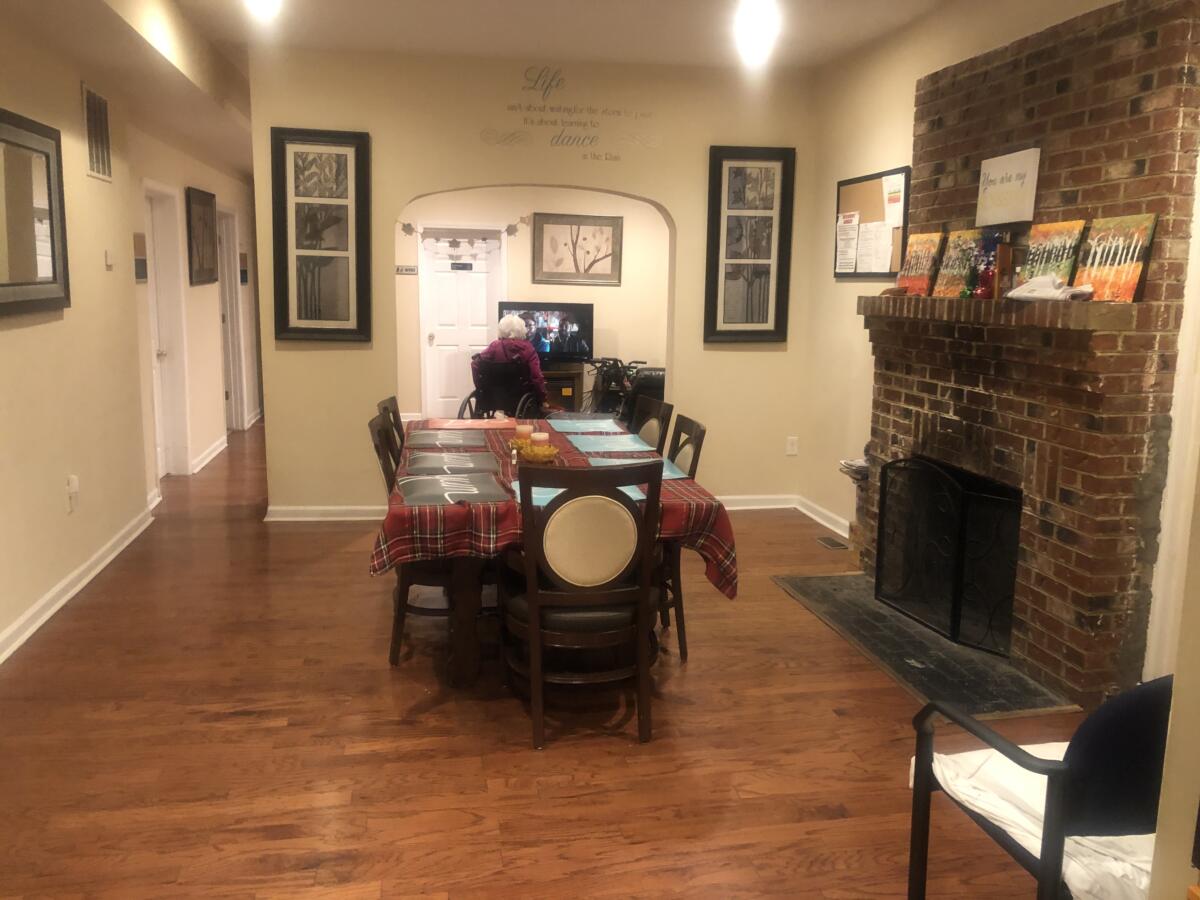
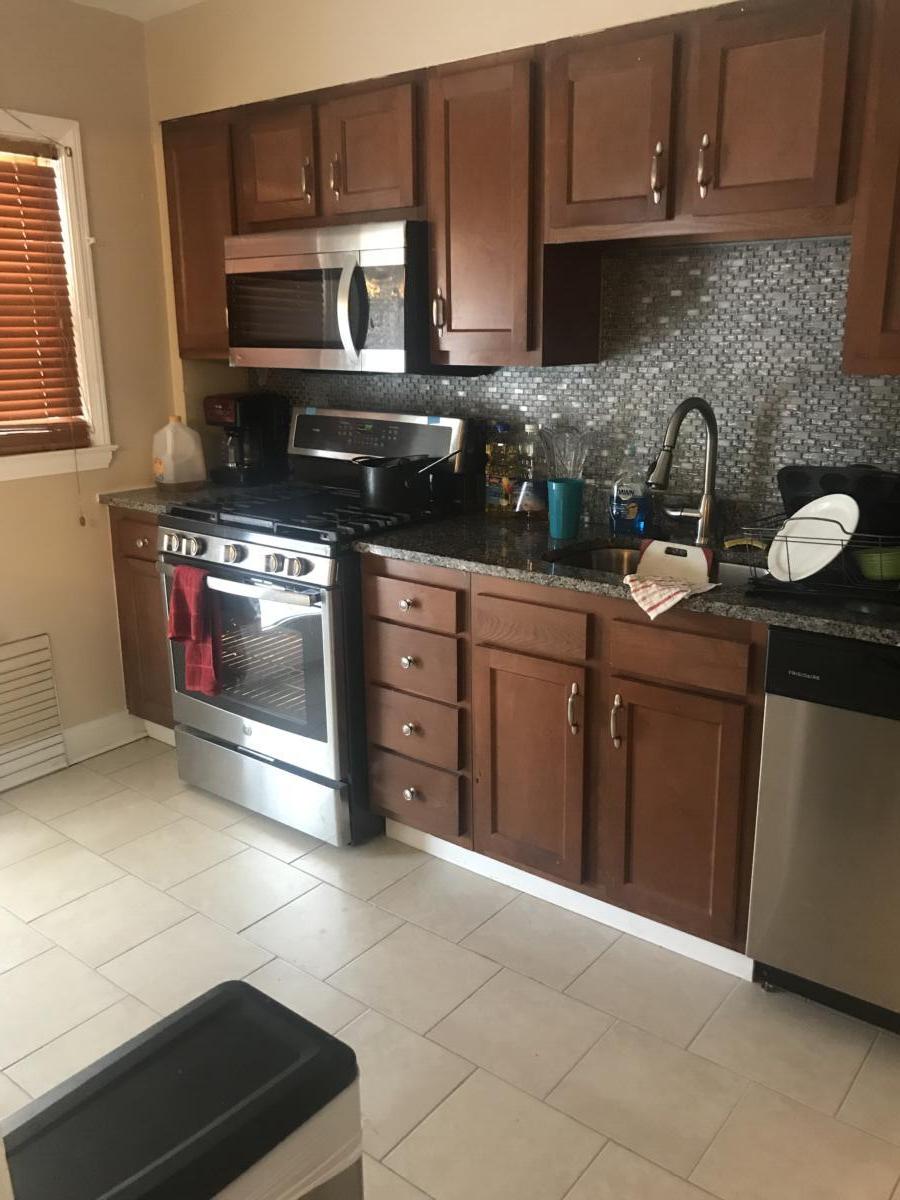
Operated by a registered nurse owner, Mabel’s House is an 8-bed assisted living and independent living community in Gwynn Oak, Maryland. The community is in a two-story residential building. It’s a small setting where personalized attention and close relationships between staff and residents are an important part of daily life. It serves older adults who need help with daily activities, those who want independent living with access to support services, residents with memory care needs, and seniors who need respite care for short-term stays.
Located on Liberty Heights Avenue, the neighborhood is very walkable. Residents have convenient access to dining, shopping, and public transportation. This location reduces isolation and makes it easier for families to visit and enjoy outings with their loved ones. The surrounding neighborhood offers the welcoming community feel that many families look for in a smaller senior living home.
Daily life at Mabel’s House focuses on engagement and maintenance-free living. Residents can join in exercise programs and culturally enriching outings based on their interests. These help them stay active and socially connected. The community offers private and semi-private rooms, comfortable shared spaces, and household services that remove the burden of daily maintenance. Around-the-clock support is also available whenever residents need assistance.
Residents and their families value the welcoming environment and the quality of care provided. The combination of registered nurse ownership, a small community setting, and a strong focus on enrichment activities makes Mabel’s House a thoughtful choice for older adults looking for a residential assisted living community in the Baltimore area.
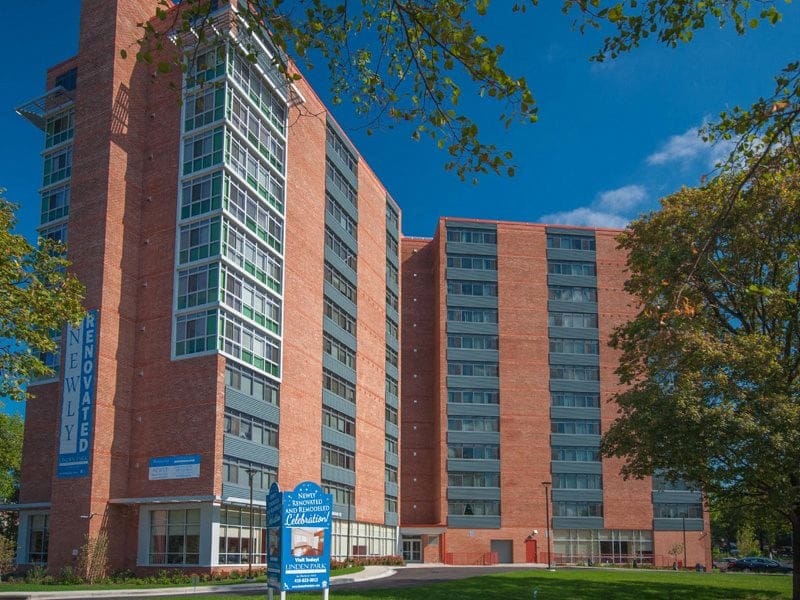
Linden Park Apartments is an independent living retirement home at 301 Mcmechen Street, Baltimore, Maryland 21217, in the Bolton Hill neighborhood, serving adults 62 and older. A high-rise with modern studio, one, and two-bedroom apartments (400, 525, and 801 square feet respectively) and city views. The home is pet-friendly. It is not CMS-certified.
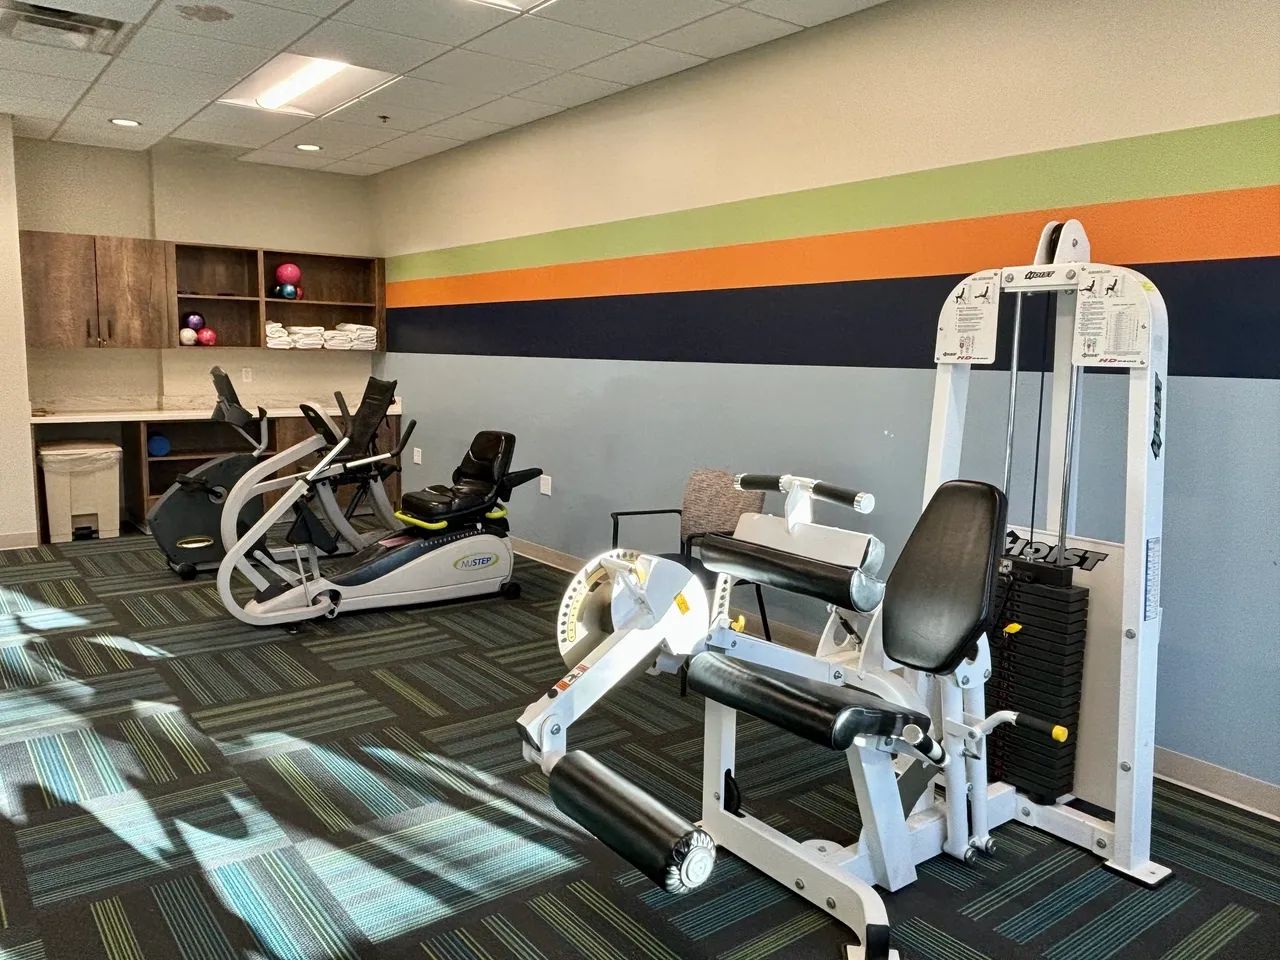
Independent living is designed for active adults seeking a maintenance-free lifestyle without assistance with daily living or medical care. Amenities include a fitness center, computer lounge, billiards room, and coordinated social activities. Transportation services are available. 24-hour emergency maintenance and on-site management ensure responsive support. The design emphasizes residential independence while eliminating homeownership maintenance.
Located 2.0 miles from downtown Baltimore in the Bolton Hill neighborhood within Baltimore’s cultural district. Walk Score 87 (very walkable). Most errands on foot. Mercy Medical Center 1.22 miles away. Public transportation, shopping, dining, and cultural venues are nearby and accessible.
Financial assistance programs available to Maryland residents include Community Options Waiver, Senior Care Program, Maryland Nursing Home Medicaid, Senior Assisted Living Subsidy Program, Veterans Aid and Attendance, Senior Prescription Drug Assistance Program, Medicare Savings Programs, and Community Personal Assistance Services. Income limits vary; families should verify with a local Area Agency on Aging.
Independent living does not involve medical licensing or facility inspection.
Prospective residents should ask about lease terms and costs, utilities, parking, guest policies, amenities, maintenance, community activities, transportation schedules, accessibility features, and facility’s financial stability.
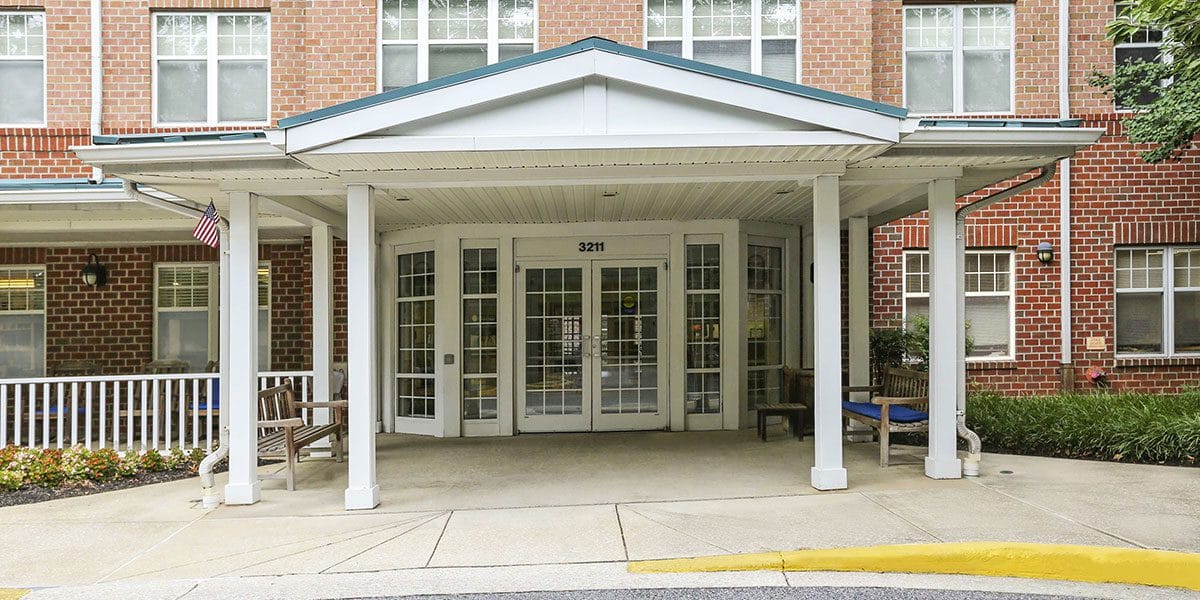
Weinberg Woods is an independent living retirement home at 3211 Clarks Lane, Baltimore, Maryland 21215, in the Cheswolde neighborhood, serving adults 62 and older. A mid-rise offering affordable one-bedroom apartments. Pet-friendly. Not CMS-certified.
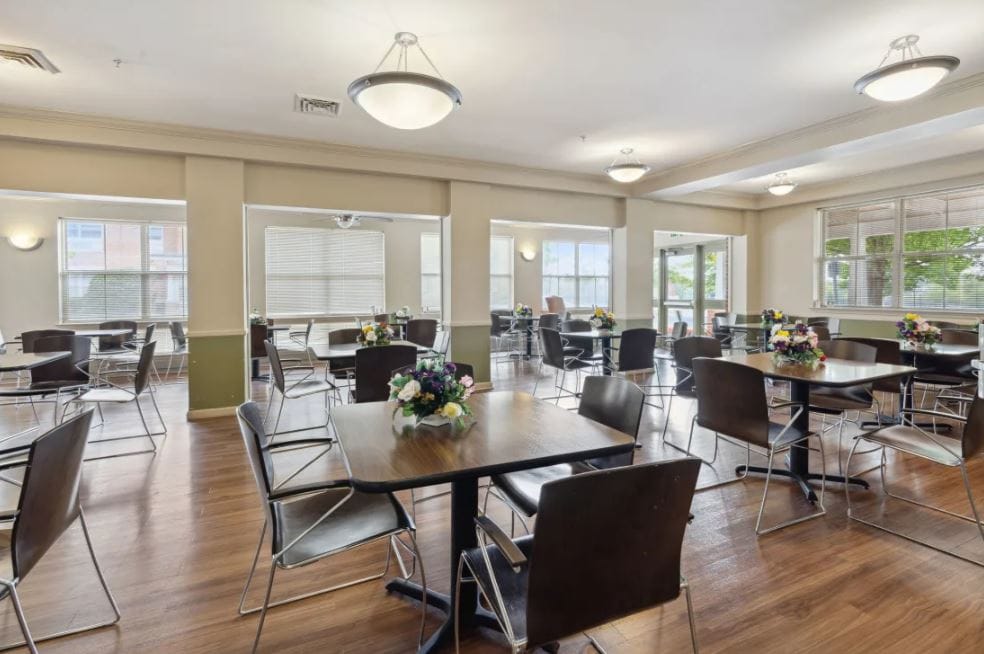
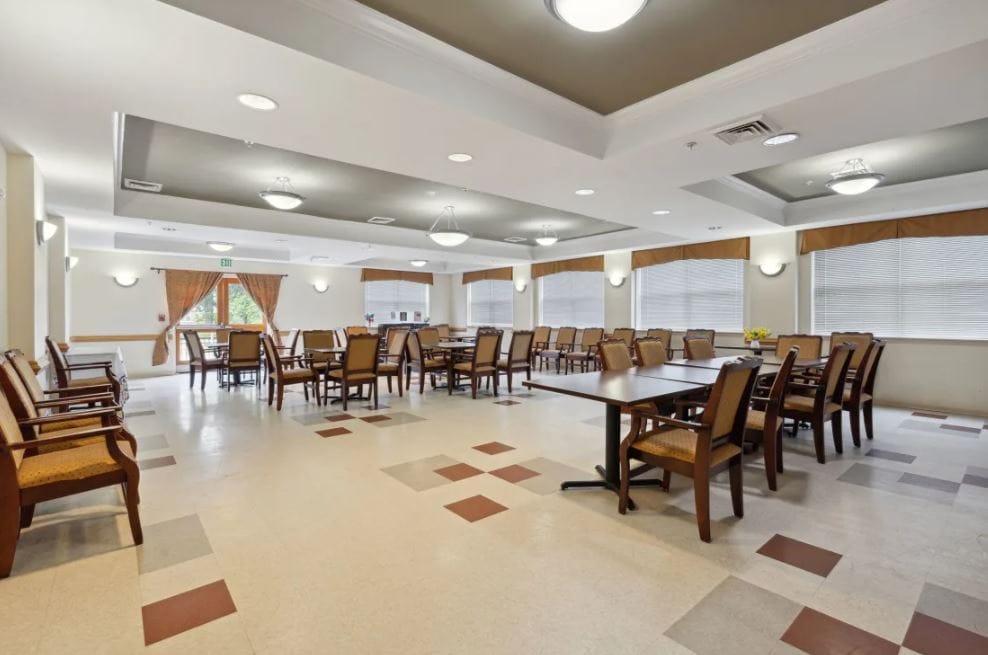
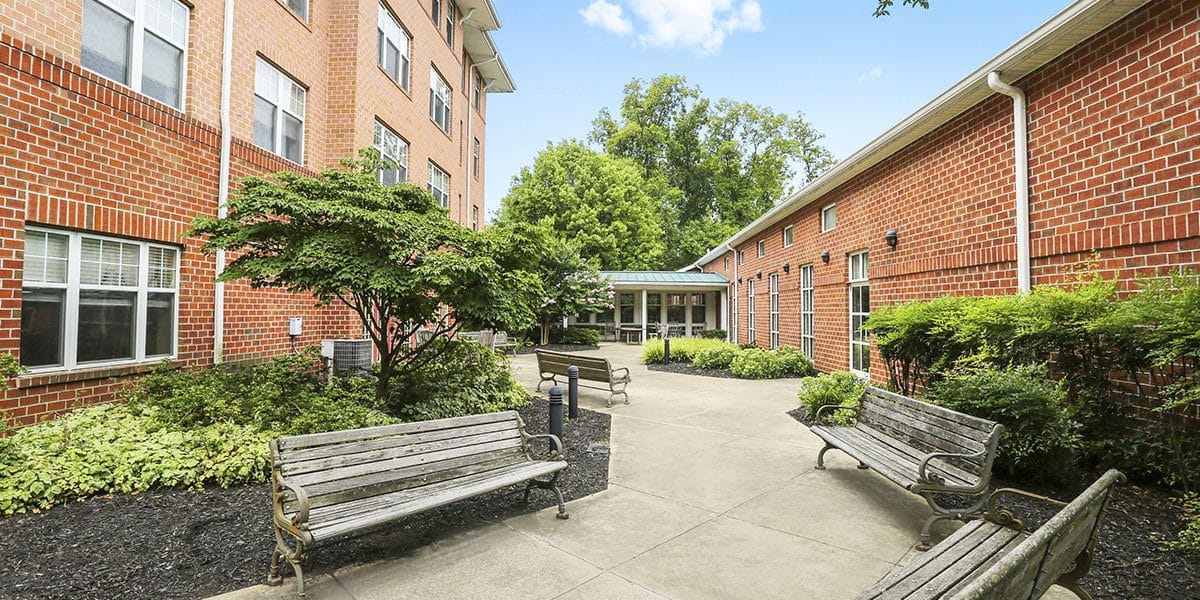
Independent living is designed for active seniors seeking a maintenance-free lifestyle without assistance with daily living or medical care. Weinberg Woods emphasizes social connection with beautifully landscaped walking paths and a service coordinator who plans regular activities. On-site amenities include a fitness center, library, media room, craft room, common area dining room, community room with kitchenette, on-site laundry, and sitting areas. A Kosher eating together program serves residents with cultural dietary preferences. Complimentary shuttle service transports residents to nearby shops, restaurants, and community centers. An active residents’ association fosters engagement. Controlled access entry and 24-hour emergency maintenance provide security and responsive support.
Operating hours: Monday through Thursday 8:45 AM to 5:00 PM, Friday 8:45 AM to 3:00 PM, Saturday and Sunday closed. Weinberg Woods is a smoke-free community.
Located 9.6 miles from downtown Baltimore in the Cheswolde neighborhood. Walk Score 36 (somewhat walkable). Most trips require transportation. Nearest hospital (Dhaval Aghera, MD) 2.02 miles away. Close to dining, restaurants, shopping, and public transportation.
Financial assistance programs available to Maryland residents include Community Options Waiver, Senior Care Program, Maryland Nursing Home Medicaid, Senior Assisted Living Subsidy Program, Veterans Aid and Attendance, Senior Prescription Drug Assistance Program, Medicare Savings Programs, and Community Personal Assistance Services. Income limits vary; families should verify with a local Area Agency on Aging.
Independent living does not involve medical licensing or facility inspection.
Prospective residents should ask about lease terms and costs, utilities, parking, guest policies, amenities, maintenance, community activities, transportation schedules, accessibility features, and facility’s financial stability.
Ranking Methodology
How we rank these independent living communities
Every community above is evaluated across six weighted categories using public data including state inspection records, review platforms, BBB profiles, and operator-published materials.
Weighting overview
- 35%Resident Experience
- 25%Regulatory
- 15%Visual Media
- 10%Website
- 10%Stability
- 5%Environment
01
Resident & Family Experience 35%
The single largest share of every ranking. Aggregated review sentiment and volume from major platforms — the closest signal to real resident experience.
- Includes
- Review Sentiment
- Review Volume
02
Regulatory & Safety Record 25%
State inspection records, citations, and complaint visits. We weight per-inspection rates more heavily than raw counts.
- Includes
- State Inspections
- Citations/Inspection
- % Inspections w/ Citations
- Complaint Visits
- Accreditations
- BBB Rating
03
Visual Media & Transparency 15%
Communities that publish high-quality visuals give families a real preview. No photos or tours = a negative transparency signal.
- Includes
- Video Tours
- Virtual Walkthroughs
- Photo Quantity
- Photo Quality
04
Website & Operator Transparency 10%
Site quality and whether the operator publishes basic accountability information — staff names, contact details, ownership.
- Includes
- Website Content
- Mobile Usability
- Staff Info Available
- Owner Info Available
05
Community Stability 10%
Operational signals indicating whether a community is well-run and meeting demand.
- Includes
- Occupancy Rate
- Bed Options
06
Environment & Pricing 5%
Walkability and pricing transparency. Walk Score is weighted higher for Independent Living than for Memory Care, where most residents do not leave unaccompanied.
- Includes
- Walk Score
- Pricing Transparency
Who we are
Your Senior Care Partner, Every Step of the Way
We help families find affordable senior communities and unlock same day discounts, Medicaid, and Medicare options tailored to your needs.
Contact us Today
Frequently Asked Questions about Independent Living in Baltimore, MD
What is the average cost of independent living in Baltimore, MD?
The average monthly cost of independent living in Baltimore, MD is approximately $1,870. Actual rates vary by community, level of care, and floorplan.
What is the price range for independent living in Baltimore, MD?
Independent living in Baltimore, MD typically ranges from $495 - $4,840 per month, depending on the community, room type, and care needs.
What is independent living?
Independent living communities are residential settings for active older adults — typically with private apartments or cottages, shared amenities (dining, fitness, activities), and no built-in medical care.
How many independent living communities are listed on this page?
This page features 14 independent living communities in Baltimore, MD. Use the filters and comparison tools above to compare ratings, amenities, and pricing.
How do I choose the right independent living community in Baltimore, MD?
Start by matching the level of care offered to the resident's current and anticipated needs, then compare licensing status, staff-to-resident ratios, recent inspection results, and pricing. Tour at least two or three communities in Baltimore, MD, talk to current residents and families, and confirm what is included in the base rate versus billed as add-on services.
What should I look for when visiting independent living communities in Baltimore, MD?
Pay attention to staff interactions with residents, cleanliness and odor, food quality at meal times, the activity calendar, and how questions about pricing and care plans are answered. Ask to see the most recent state inspection report, the move-out / level-of-care-change policy, and a sample monthly bill that lists every fee.