


The Village at Providence Point
Nursing Home, Independent Living, Memory Care & Skilled Nursing · Annapolis, MD


The Village at Providence Point
Nursing Home, Independent Living, Memory Care & Skilled Nursing · Annapolis, MD
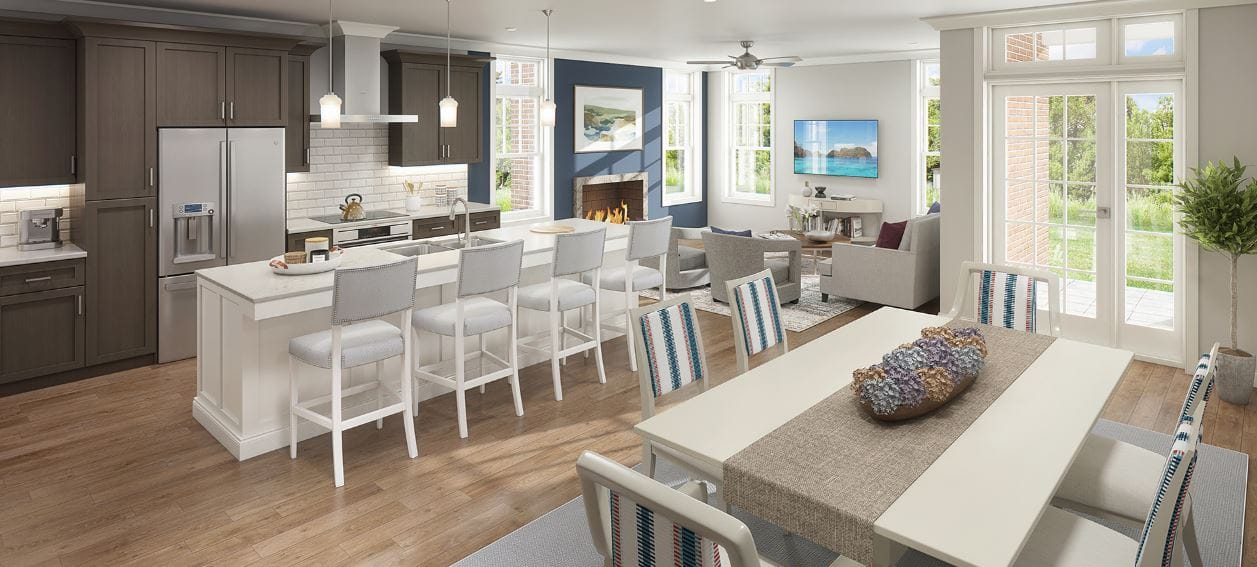
The Village at Providence Point is a highly recognized continuing care retirement community in Annapolis, MD, offering independent living, memory care, and skilled nursing. The community’s lively and welcoming environment ensures older adults can live comfortably in retirement. With restaurant-style dining, housekeeping, and transportation services, residents experience worry-free living. Alongside thoughtfully curated amenities, personalized care plans are also provided, so residents can maintain their independence with ease.
Fitness classes, book clubs, and educational programs provide residents with more opportunities to continue learning and gain meaningful experiences. A hair salon, a game room, and a health center are also available, so residents can rest and interact with their surroundings. Residents also have quick access to healthcare and leisure, with Luminis Health Anne Arundel Medical Center, shops, and bus stops nearby. This retirement community continuously provides exceptional care to help older adults age gracefully, making it a great choice for senior living in Maryland.
Walk Score: 61 / 100 Rank #301 / 985Walk Score — State benchmarkedThis home is ranked 301st out of 985 homes in Maryland for Walk Score. Shows how walkable this facility's neighborhood is compared to the average Walk Score across Maryland facilities. Higher scores benefit residents, families, and staff.Facilities with the same value for a metric share the same rank. Rankings are based only on facilities in Maryland that report data for that category. Facilities without available data are excluded from the ranking.Click the rank badge to see the full State ranking.Click here to see the full State ranking.
Moderately walkable. Some errands can be accomplished on foot, with a mix of nearby amenities.
Rehabilitation Services
State-Of-The-Art Fitness Center
On-Site Health Center
Beautifully Designed Cottages And Apartments
Cocktail Lounge
Creative Arts Studio
Card/Game Room
Hair Salon
Transportation To Shopping Centers
Doctor’s Appointments
And City Dock
Activities
Wellness Program
Specific ProgramsHealth & Wellness
Religious ServicesChapel for group and personal worship
Touring Hours8:30 a.m. - 5 p.m. Monday - Friday, Weekends by Appointment
What does this home offer?
Pets Allowed
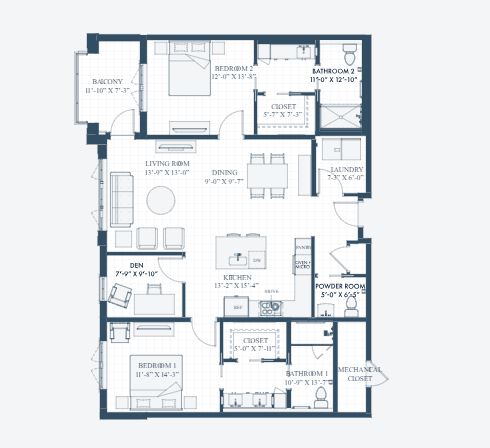
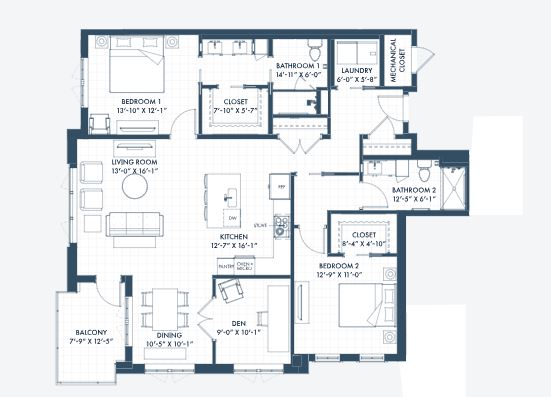
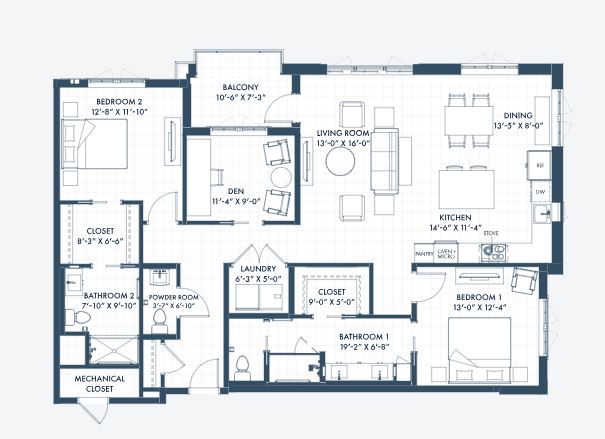
Room Sizes: 900 - 1,725 sq. ft
Housing Options: 1 Bed / 2 Bed
Building Type: Mid-rise
Transportation Services
Fitness and Recreation
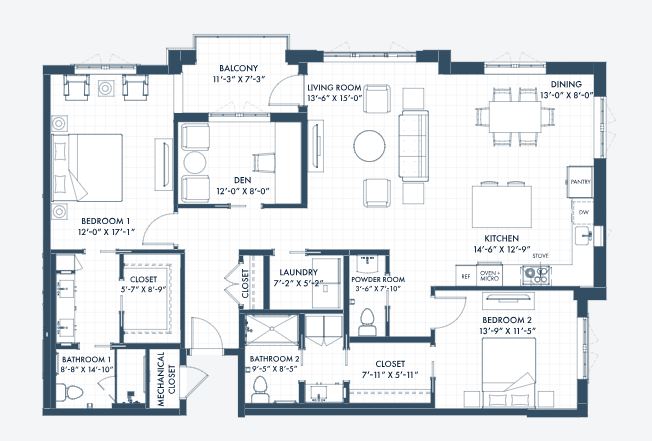
Living Spaces & Floor Plans for The Village at Providence Point
Places of interest near The Village at Providence Point
![]() 3.4 miles from city center
3.4 miles from city center
![]() Estimated distance in miles from Annapolis's city center to The Village at Providence Point's address, calculated via Google Maps.
Estimated distance in miles from Annapolis's city center to The Village at Providence Point's address, calculated via Google Maps.
Calculate Travel Distance to The Village at Providence Point
Add your location
Compare Nursing Homes around Annapolis
The information below is reported by the Maryland Department of Health, Office of Health Care Quality.
| Complete Care at Annapolis | NH HOS PC RC SNF | Annapolis | 97
Facility
97
MD AVG
43
Rank
#135 / 690 |
77.3%
Facility
77.3%
MD AVG
80.8
Rank
#75 / 104 | -4% | 3.26
Facility
3.26
MD AVG
3.77
Rank
#91 / 143 | -3% | -14% | $0
Facility
$0
MD AVG
$65.0k
Rank
#1 / 145 | 32
Facility
32
MD AVG
49.9
Rank
#41 / 145 | 10.7
Facility
10.7
MD AVG
12.8
Rank
#65 / 145 | - | 75 | - |
62
Facility
62
MD AVG
43
Rank
#286 / 985 | Pc Md5 Opco Holdco LLC | $11.7M*Fiscal year ending 12/2021These figures are from this home's most recent complete cost report — an older period than most facilities report. Compare with that in mind.
Facility
$11.7M*Fiscal year ending 12/2021These figures are from this home's most recent complete cost report — an older period than most facilities report. Compare with that in mind.
MD AVG
$18.7M
Rank
#108 / 144 | $6.1M*Fiscal year ending 12/2021These figures are from this home's most recent complete cost report — an older period than most facilities report. Compare with that in mind.
Facility
$6.1M*Fiscal year ending 12/2021These figures are from this home's most recent complete cost report — an older period than most facilities report. Compare with that in mind.
MD AVG
$6.5M
Rank
#120 / 144 | 51.8%*Fiscal year ending 12/2021These figures are from this home's most recent complete cost report — an older period than most facilities report. Compare with that in mind.
Facility
51.8%*Fiscal year ending 12/2021These figures are from this home's most recent complete cost report — an older period than most facilities report. Compare with that in mind.
MD AVG
38.5%
Rank
#87 / 144 | 215005 | ||||
| Ginger Cove | NH AL HC IL MC SNF | Annapolis (River Crescent Drive) | 96
Facility
96
MD AVG
43
Rank
#136 / 690 | - | - | 5.57
Facility
5.57
MD AVG
3.77
Rank
#8 / 143 | +25% | +47% | $0
Facility
$0
MD AVG
$65.0k
Rank
#1 / 145 | 19
Facility
19
MD AVG
49.9
Rank
#12 / 145 | 6.3
Facility
6.3
MD AVG
12.8
Rank
#12 / 145 | - | 35 | A+ |
51
Facility
51
MD AVG
43
Rank
#413 / 985 | Phyllis Boulden | $5.0MFiscal year ending 06/2024
Facility
$5.0MFiscal year ending 06/2024
MD AVG
$18.7M
Rank
#26 / 144 | $13.3MFiscal year ending 06/2024
Facility
$13.3MFiscal year ending 06/2024
MD AVG
$6.5M
Rank
#24 / 144 | 265.4%Fiscal year ending 06/2024
Facility
265.4%Fiscal year ending 06/2024
MD AVG
38.5%
Rank
#61 / 144 | 215174 | ||||
| Autumn Lake Healthcare at Crofton | NH RC SNF | Crofton (Charing Cross) | 180
Facility
180
MD AVG
43
Rank
#19 / 690 |
88.9%
Facility
88.9%
MD AVG
80.8
Rank
#46 / 104 | +10% | 3.37
Facility
3.37
MD AVG
3.77
Rank
#80 / 143 | +35% | -11% | $0
Facility
$0
MD AVG
$65.0k
Rank
#1 / 145 | 27
Facility
27
MD AVG
49.9
Rank
#25 / 145 | 6.8
Facility
6.8
MD AVG
12.8
Rank
#17 / 145 | - | 160 | - |
41
Facility
41
MD AVG
43
Rank
#508 / 985 | A&R Stern Family Cc Holdings LLC | $27.2MFiscal year ending 12/2023
Facility
$27.2MFiscal year ending 12/2023
MD AVG
$18.7M
Rank
#29 / 144 | $3.0MFiscal year ending 12/2023
Facility
$3.0MFiscal year ending 12/2023
MD AVG
$6.5M
Rank
#26 / 144 | 11.1%Fiscal year ending 12/2023
Facility
11.1%Fiscal year ending 12/2023
MD AVG
38.5%
Rank
#66 / 144 | 215120 | ||||
| Autumn Lake Healthcare at Spa Creek | NH RC SNF | Annapolis (Milkshake Lane) | 130
Facility
130
MD AVG
43
Rank
#63 / 690 |
87.5%
Facility
87.5%
MD AVG
80.8
Rank
#53 / 104 | +8% | 3.32
Facility
3.32
MD AVG
3.77
Rank
#91 / 143 | -41% | -12% | $0
Facility
$0
MD AVG
$65.0k
Rank
#1 / 145 | 65
Facility
65
MD AVG
49.9
Rank
#114 / 145 | 13.0
Facility
13.0
MD AVG
12.8
Rank
#88 / 145 | 1 | 114 | - |
48
Facility
48
MD AVG
43
Rank
#448 / 985 | 35 Milkshake Holdco LLC | $20.1MFiscal year ending 12/2023
Facility
$20.1MFiscal year ending 12/2023
MD AVG
$18.7M
Rank
#53 / 144 | $1.5MFiscal year ending 12/2023
Facility
$1.5MFiscal year ending 12/2023
MD AVG
$6.5M
Rank
#47 / 144 | 7.2%Fiscal year ending 12/2023
Facility
7.2%Fiscal year ending 12/2023
MD AVG
38.5%
Rank
#72 / 144 | 215258 |
Financial Assistance for
Nursing Home in Maryland
The Village at Providence Point is located in Annapolis, Maryland.
Here are the financial assistance programs available to residents in Maryland.
Frequently Asked Questions about The Village at Providence Point
Is The Village at Providence Point in a walkable area?
The Village at Providence Point has a walk score of 61. Moderately walkable. Some errands can be accomplished on foot, with a mix of nearby amenities.
Does The Village at Providence Point have different floorplan options?
Yes — see the floorplan options available at The Village at Providence Point on this page.
Are there photos of The Village at Providence Point?
Yes — there are 4 photos of The Village at Providence Point in the photo gallery on this page.
What is the address of The Village at Providence Point?
The Village at Providence Point is located at 1997 Annapolis Exchange Pkwy, Suite 310, Annapolis, MD 21401.
What is the phone number of The Village at Providence Point?
(410) 314-4400 will put you in contact with the team at The Village at Providence Point.
Is The Village at Providence Point Medicare or Medicaid certified?
The Village at Providence Point is not currently listed as a CMS-certified provider of Medicare or Medicaid.
Guides for Better Senior Living
Care Cost Calculator: See Prices in Your Area
Nursing Home Data Explorer
Don’t Wait Too Long: 7 Red Flag Signs Your Parent Needs Assisted Living Now
The True Cost of Assisted Living in 2025 – And How Families Are Paying For It
Understanding Senior Living Costs: Pricing Models, Discounts & Financial Assistance
Updated on
