


Compare Assisted Living around Annapolis
The information below is reported by the Maryland Department of Health, Office of Health Care Quality.
| Ginger Cove | AL HC IL MC NH SNF | Annapolis (River Crescent Drive) | 96
Facility
96
MD AVG
43
Rank
#136 / 690 | No |
51
Facility
51
MD AVG
43
Rank
#413 / 985 | 1 Bed / 2 Bed | 42
Facility
42
MD AVG
21
Rank
#8 / 210 |
40% Male Residents — State Benchmarked 40% of residents are male, compared to the Maryland average of 31%. A relatively balanced gender mix for assisted living, where facilities typically skew heavily female. |
60% Female Residents — State Benchmarked 60% of residents are female, compared to the Maryland average of 69%. Closer to an even gender split than most assisted living facilities, which typically have 65–75% female residents. |
100% White Residents — State Benchmarked 100% of residents are reported as White, compared to the Maryland average of 81%. A higher White share than is typical for assisted living in Maryland in this dataset — compare with peer facilities for local context. |
0% African American Residents — State Benchmarked 0% of residents are reported as African American or Black, compared to the Maryland average of 13%. A lower African American share than is typical in Maryland; local markets still vary widely. |
0% Other Ethnicity Residents — State Benchmarked 0% of residents fall into categories other than White or African American (combined), compared to the Maryland average of 6%. This column aggregates Hispanic, Asian, multiracial, and any other labeled groups that are not classified as White or African American. | - |
13% Residents Age 75–84 — State Benchmarked 13% of residents are 75–84, compared to the Maryland average of 31%. Below the state norm — the resident mix may skew either younger or older than this typical middle bracket. |
64% Residents Age 85–94 — State Benchmarked 64% of residents are 85–94, compared to the Maryland average of 44%. A high concentration of very elderly residents signals a higher-acuity facility with experience caring for advanced age-related needs. |
22% Residents Age 95+ — State Benchmarked 22% of residents are 95 or older, compared to the Maryland average of 16%. A high proportion of the oldest-old suggests strong end-of-life care experience and very-high-acuity capabilities. |
| Baywoods of Annapolis | AL IL MC | Annapolis (Bay Front Drive) | - | Yes |
28
Facility
28
MD AVG
43
Rank
#659 / 985 | 1 Bed / 2 Bed | 17
Facility
17
MD AVG
21
Rank
#121 / 210 | - | - | - | - | - | - | - | - | - |
| Sunrise of Annapolis | AL HOS MC | Annapolis | 106
Facility
106
MD AVG
43
Rank
#102 / 690 | Yes |
38
Facility
38
MD AVG
43
Rank
#542 / 985 | Studio / 1 Bed / 2 Bed | 30
Facility
30
MD AVG
21
Rank
#44 / 210 |
31% Male Residents — State Benchmarked 31% of residents are male, compared to the Maryland average of 31%. This facility caters to a majority female resident pool (69% female), consistent with the broader assisted living trend where women significantly outnumber men. |
69% Female Residents — State Benchmarked 69% of residents are female, compared to the Maryland average of 69%. Women comprise the large majority, consistent with national assisted living demographics where women live longer and enter care facilities at higher rates. |
90% White Residents — State Benchmarked 90% of residents are reported as White, compared to the Maryland average of 81%. A higher White share than is typical for assisted living in Maryland in this dataset — compare with peer facilities for local context. |
6% African American Residents — State Benchmarked 6% of residents are reported as African American or Black, compared to the Maryland average of 13%. In line with the Maryland average for African American residents among facilities reporting this breakdown. |
4% Other Ethnicity Residents — State Benchmarked 4% of residents fall into categories other than White or African American (combined), compared to the Maryland average of 6%. This column aggregates Hispanic, Asian, multiracial, and any other labeled groups that are not classified as White or African American. Reported subgroups in this total: American Indian (1%), Hawaiian/Pacific Islander (1%), Hispanic (1%). |
12% Residents Age 65–74 — State Benchmarked 12% of residents are 65–74, compared to the Maryland average of 13%. In line with the statewide profile for this youngest senior bracket in assisted living. |
22% Residents Age 75–84 — State Benchmarked 22% of residents are 75–84, compared to the Maryland average of 31%. Below the state norm — the resident mix may skew either younger or older than this typical middle bracket. |
65% Residents Age 85–94 — State Benchmarked 65% of residents are 85–94, compared to the Maryland average of 44%. A high concentration of very elderly residents signals a higher-acuity facility with experience caring for advanced age-related needs. | - |
| Bay Village of Annapolis | AL MC RC | Annapolis | 88
Facility
88
MD AVG
43
Rank
#157 / 690 | Yes |
75
Facility
75
MD AVG
43
Rank
#131 / 985 | Studio / 1 Bed | 5
Facility
5
MD AVG
21
Rank
#184 / 210 |
32% Male Residents — State Benchmarked 32% of residents are male, compared to the Maryland average of 31%. This facility caters to a majority female resident pool (68% female), consistent with the broader assisted living trend where women significantly outnumber men. |
68% Female Residents — State Benchmarked 68% of residents are female, compared to the Maryland average of 69%. Women comprise the large majority, consistent with national assisted living demographics where women live longer and enter care facilities at higher rates. |
99% White Residents — State Benchmarked 99% of residents are reported as White, compared to the Maryland average of 81%. A higher White share than is typical for assisted living in Maryland in this dataset — compare with peer facilities for local context. |
0% African American Residents — State Benchmarked 0% of residents are reported as African American or Black, compared to the Maryland average of 13%. A lower African American share than is typical in Maryland; local markets still vary widely. |
1% Other Ethnicity Residents — State Benchmarked 1% of residents fall into categories other than White or African American (combined), compared to the Maryland average of 6%. This column aggregates Hispanic, Asian, multiracial, and any other labeled groups that are not classified as White or African American. Reported subgroups in this total: Hispanic (1%). |
14% Residents Age 65–74 — State Benchmarked 14% of residents are 65–74, compared to the Maryland average of 13%. In line with the statewide profile for this youngest senior bracket in assisted living. |
28% Residents Age 75–84 — State Benchmarked 28% of residents are 75–84, compared to the Maryland average of 31%. This is the second most common age bracket in assisted living, representing residents with moderate care needs. |
50% Residents Age 85–94 — State Benchmarked 50% of residents are 85–94, compared to the Maryland average of 44%. A high concentration of very elderly residents signals a higher-acuity facility with experience caring for advanced age-related needs. |
8% Residents Age 95+ — State Benchmarked 8% of residents are 95 or older, compared to the Maryland average of 16%. Most residents here have not yet reached the oldest-old bracket, suggesting a younger overall community. |
| Brightview Annapolis | AL IL MC | Annapolis | 85
Facility
85
MD AVG
43
Rank
#163 / 690 | Yes |
34
Facility
34
MD AVG
43
Rank
#590 / 985 | Studio / 1 Bed / 2 Bed | 8
Facility
8
MD AVG
21
Rank
#164 / 210 |
27% Male Residents — State Benchmarked 27% of residents are male, compared to the Maryland average of 31%. This facility caters to a majority female resident pool (73% female), consistent with the broader assisted living trend where women significantly outnumber men. |
73% Female Residents — State Benchmarked 73% of residents are female, compared to the Maryland average of 69%. Women comprise the large majority, consistent with national assisted living demographics where women live longer and enter care facilities at higher rates. |
97% White Residents — State Benchmarked 97% of residents are reported as White, compared to the Maryland average of 81%. A higher White share than is typical for assisted living in Maryland in this dataset — compare with peer facilities for local context. |
0% African American Residents — State Benchmarked 0% of residents are reported as African American or Black, compared to the Maryland average of 13%. A lower African American share than is typical in Maryland; local markets still vary widely. |
3% Other Ethnicity Residents — State Benchmarked 3% of residents fall into categories other than White or African American (combined), compared to the Maryland average of 6%. This column aggregates Hispanic, Asian, multiracial, and any other labeled groups that are not classified as White or African American. Reported subgroups in this total: Hispanic (3%). |
3% Residents Age 65–74 — State Benchmarked 3% of residents are 65–74, compared to the Maryland average of 13%. Fewer younger seniors suggests the resident population skews older, likely requiring higher acuity care and more hands-on support. |
27% Residents Age 75–84 — State Benchmarked 27% of residents are 75–84, compared to the Maryland average of 31%. This is the second most common age bracket in assisted living, representing residents with moderate care needs. |
59% Residents Age 85–94 — State Benchmarked 59% of residents are 85–94, compared to the Maryland average of 44%. A high concentration of very elderly residents signals a higher-acuity facility with experience caring for advanced age-related needs. |
9% Residents Age 95+ — State Benchmarked 9% of residents are 95 or older, compared to the Maryland average of 16%. Most residents here have not yet reached the oldest-old bracket, suggesting a younger overall community. |
| Brightview South River | AL MC | Edgewater (Lee Airpark Drive) | 100
Facility
100
MD AVG
43
Rank
#114 / 690 | Yes |
49
Facility
49
MD AVG
43
Rank
#431 / 985 | Studio / 1 Bed / 2 Bed | 14
Facility
14
MD AVG
21
Rank
#140 / 210 |
30% Male Residents — State Benchmarked 30% of residents are male, compared to the Maryland average of 31%. This facility caters to a majority female resident pool (70% female), consistent with the broader assisted living trend where women significantly outnumber men. |
70% Female Residents — State Benchmarked 70% of residents are female, compared to the Maryland average of 69%. Women comprise the large majority, consistent with national assisted living demographics where women live longer and enter care facilities at higher rates. |
95% White Residents — State Benchmarked 95% of residents are reported as White, compared to the Maryland average of 81%. A higher White share than is typical for assisted living in Maryland in this dataset — compare with peer facilities for local context. |
1% African American Residents — State Benchmarked 1% of residents are reported as African American or Black, compared to the Maryland average of 13%. A lower African American share than is typical in Maryland; local markets still vary widely. |
4% Other Ethnicity Residents — State Benchmarked 4% of residents fall into categories other than White or African American (combined), compared to the Maryland average of 6%. This column aggregates Hispanic, Asian, multiracial, and any other labeled groups that are not classified as White or African American. Reported subgroups in this total: Hispanic (2%), Mixed Race (1%). |
2% Residents Age 65–74 — State Benchmarked 2% of residents are 65–74, compared to the Maryland average of 13%. Fewer younger seniors suggests the resident population skews older, likely requiring higher acuity care and more hands-on support. |
52% Residents Age 75–84 — State Benchmarked 52% of residents are 75–84, compared to the Maryland average of 31%. A high concentration in this mid-range bracket, where residents typically need moderate support with daily activities. |
37% Residents Age 85–94 — State Benchmarked 37% of residents are 85–94, compared to the Maryland average of 44%. The population here skews younger than the statewide norm, which may indicate a more active, lower-acuity community. |
9% Residents Age 95+ — State Benchmarked 9% of residents are 95 or older, compared to the Maryland average of 16%. Most residents here have not yet reached the oldest-old bracket, suggesting a younger overall community. |
| Celebration Villa of Manresa | AL RC | Annapolis (Arnold) | 86
Facility
86
MD AVG
43
Rank
#162 / 690 | Yes |
2
Facility
2
MD AVG
43
Rank
#940 / 985 | Studio / 1 Bed | 3
Facility
3
MD AVG
21
Rank
#203 / 210 |
35% Male Residents — State Benchmarked 35% of residents are male, compared to the Maryland average of 31%. This facility caters to a majority female resident pool (65% female), consistent with the broader assisted living trend where women significantly outnumber men. |
65% Female Residents — State Benchmarked 65% of residents are female, compared to the Maryland average of 69%. Women comprise the large majority, consistent with national assisted living demographics where women live longer and enter care facilities at higher rates. |
97% White Residents — State Benchmarked 97% of residents are reported as White, compared to the Maryland average of 81%. A higher White share than is typical for assisted living in Maryland in this dataset — compare with peer facilities for local context. |
3% African American Residents — State Benchmarked 3% of residents are reported as African American or Black, compared to the Maryland average of 13%. A lower African American share than is typical in Maryland; local markets still vary widely. |
0% Other Ethnicity Residents — State Benchmarked 0% of residents fall into categories other than White or African American (combined), compared to the Maryland average of 6%. This column aggregates Hispanic, Asian, multiracial, and any other labeled groups that are not classified as White or African American. |
8% Residents Age 65–74 — State Benchmarked 8% of residents are 65–74, compared to the Maryland average of 13%. Fewer younger seniors suggests the resident population skews older, likely requiring higher acuity care and more hands-on support. |
52% Residents Age 75–84 — State Benchmarked 52% of residents are 75–84, compared to the Maryland average of 31%. A high concentration in this mid-range bracket, where residents typically need moderate support with daily activities. |
27% Residents Age 85–94 — State Benchmarked 27% of residents are 85–94, compared to the Maryland average of 44%. The population here skews younger than the statewide norm, which may indicate a more active, lower-acuity community. |
13% Residents Age 95+ — State Benchmarked 13% of residents are 95 or older, compared to the Maryland average of 16%. In line with the statewide profile for the oldest resident bracket. |
| Integracare | AL IL MC RC | Annapolis | - | Yes |
70
Facility
70
MD AVG
43
Rank
#184 / 985 | Studio / 1 Bed / 2 Bed | - | - | - | - | - | - | - | - | - | - |
| Annapolitan Assisted Living | AL MC | Annapolis | - | Yes |
31
Facility
31
MD AVG
43
Rank
#620 / 985 | Private Studio / Companion Suites | - | - | - | - | - | - | - | - | - | - |
| Baywoods of Annapolis | AL IL MC | Annapolis | - | No |
25
Facility
25
MD AVG
43
Rank
#684 / 985 | - | - | - | - | - | - | - | - | - | - | - |
| Heart Homes At Bay Ridge | AL MC RC | Annapolis | - | No |
54
Facility
54
MD AVG
43
Rank
#380 / 985 | - | - | - | - | - | - | - | - | - | - | - |
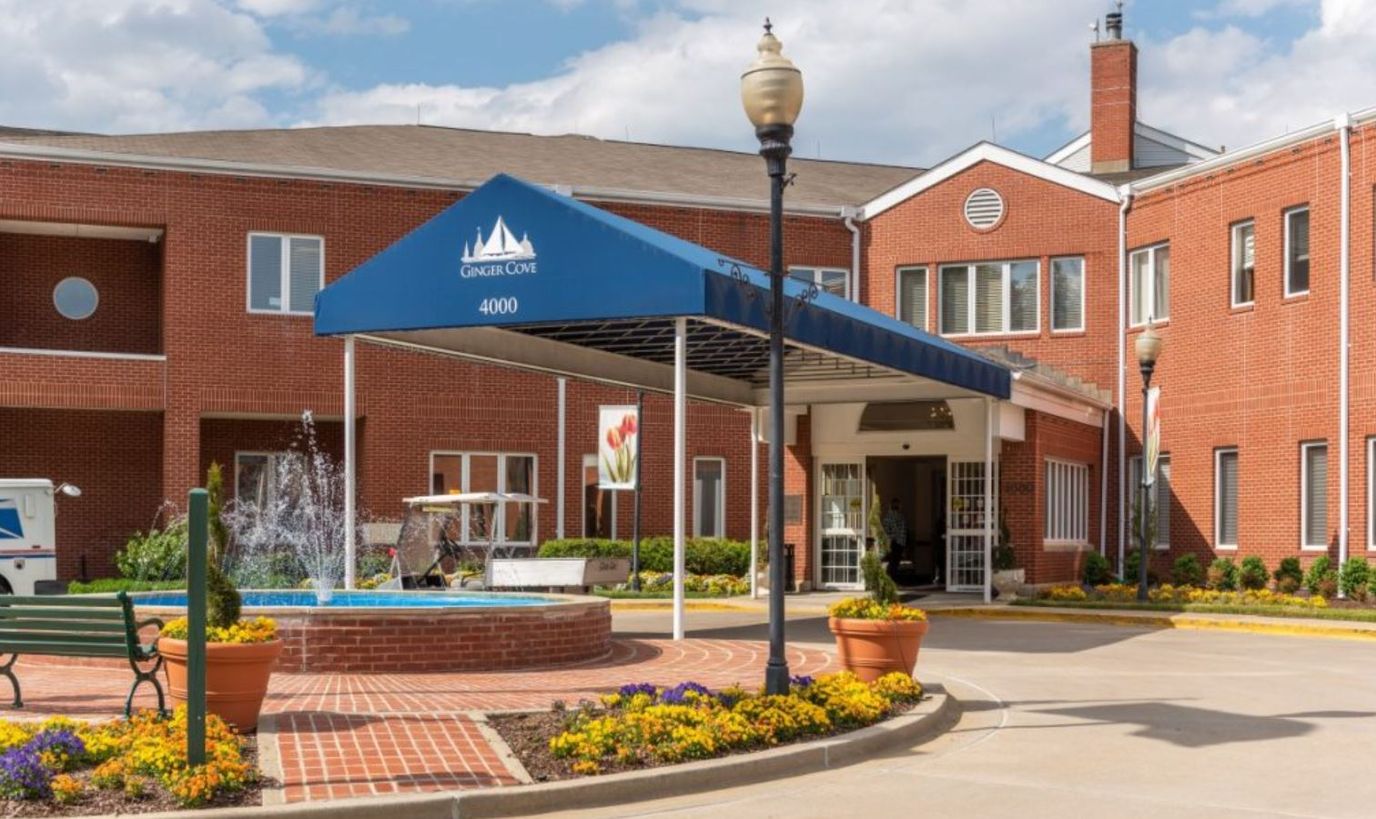
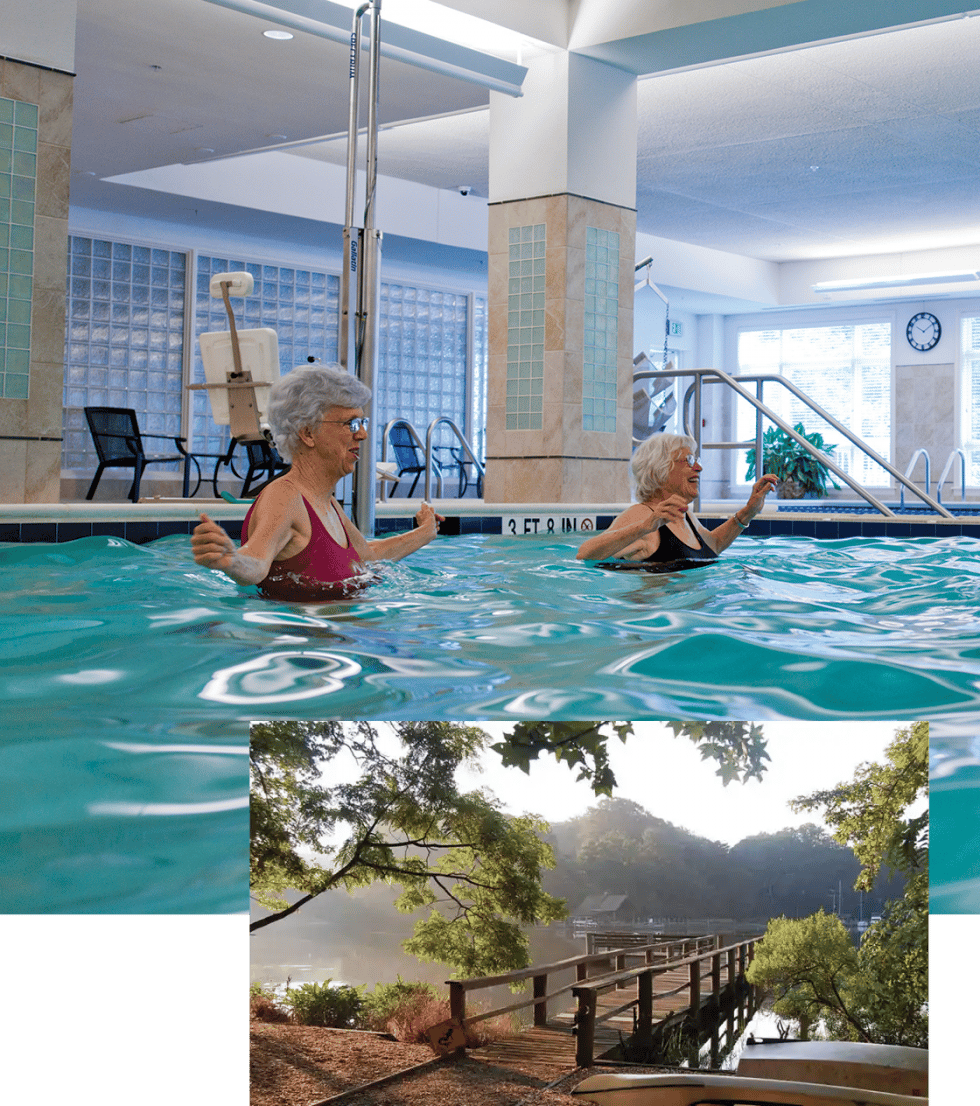
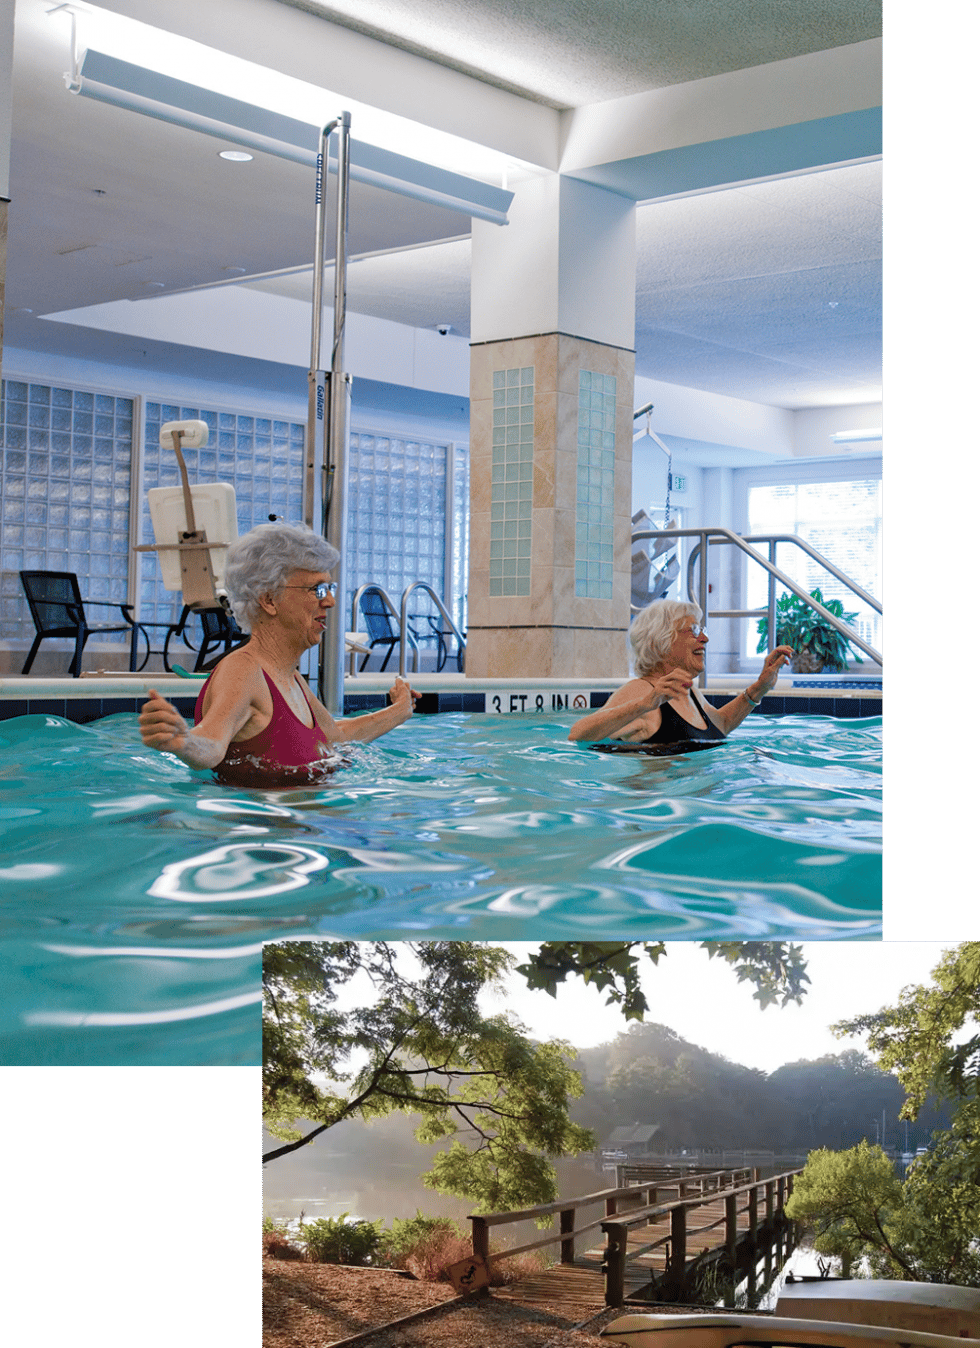
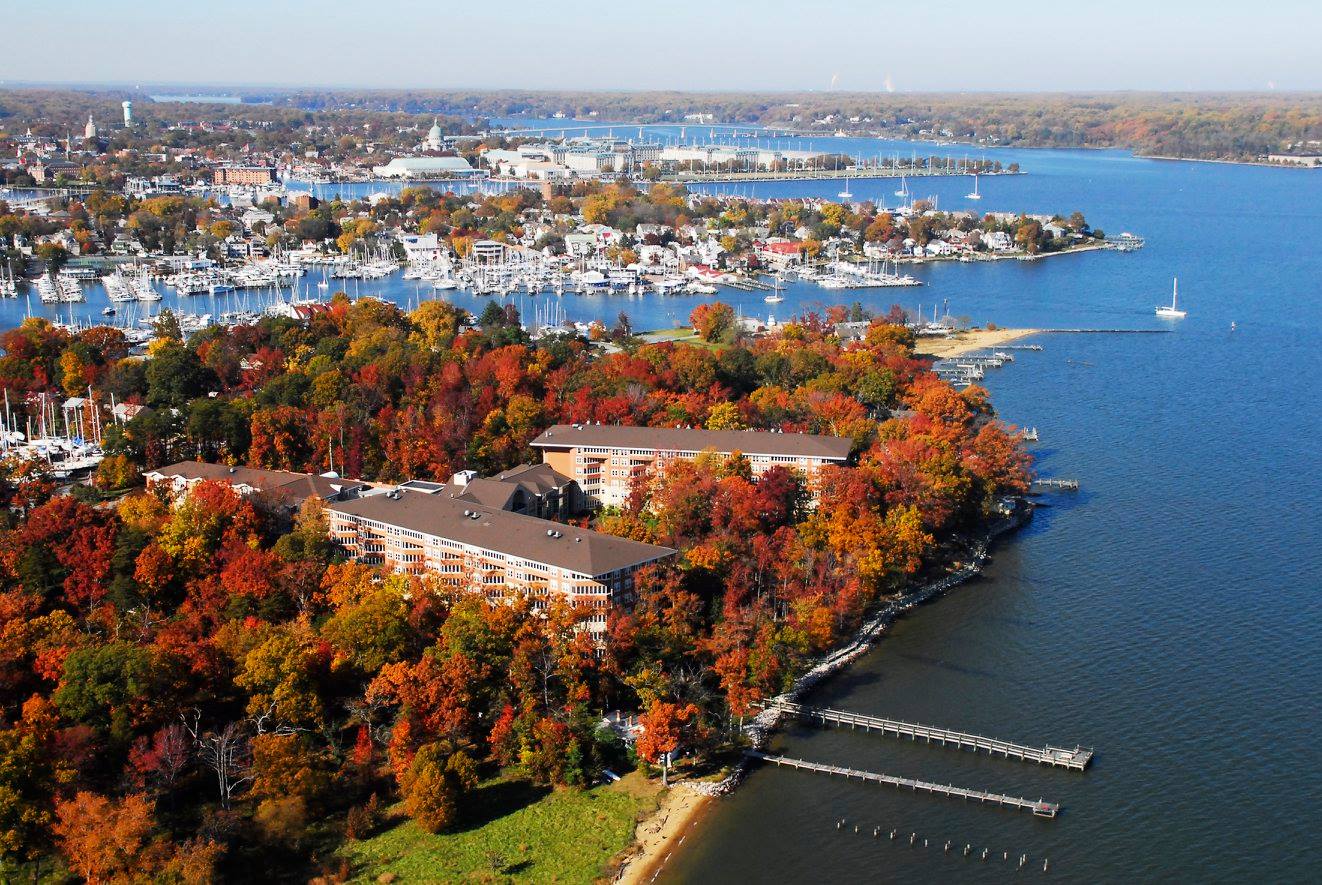
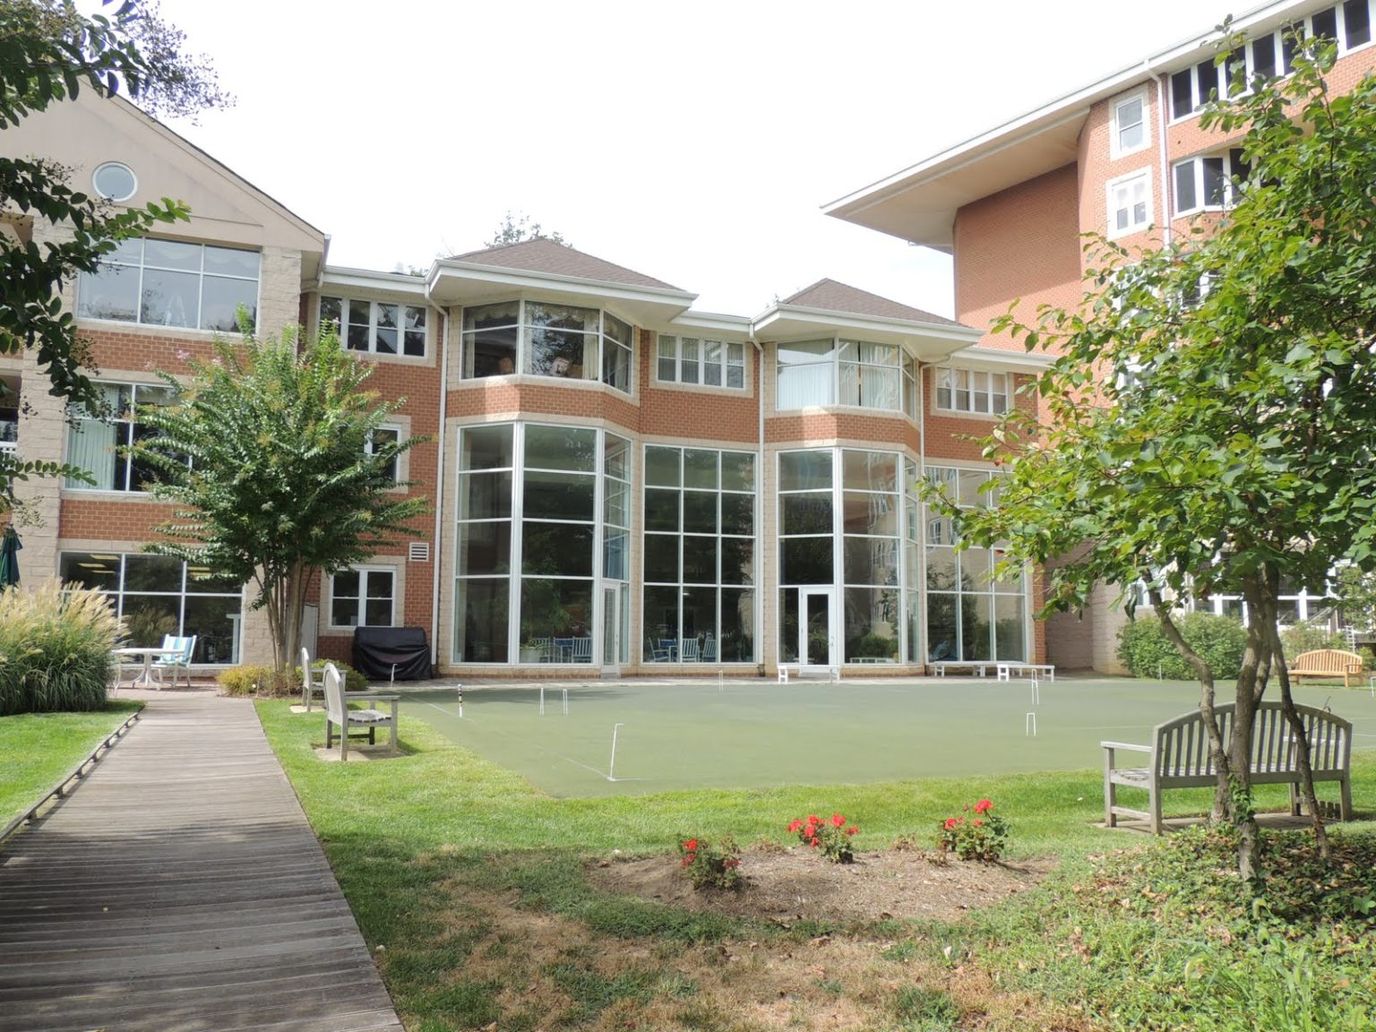
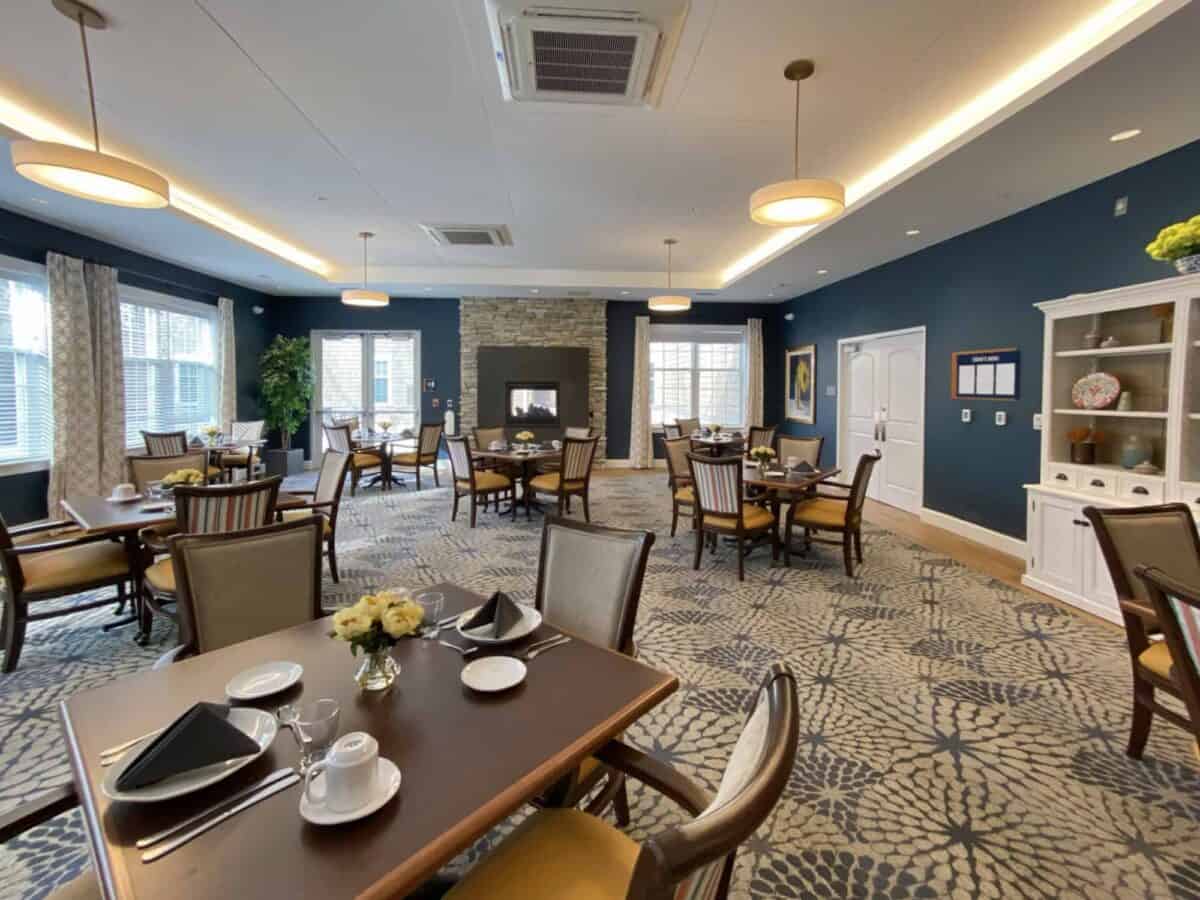
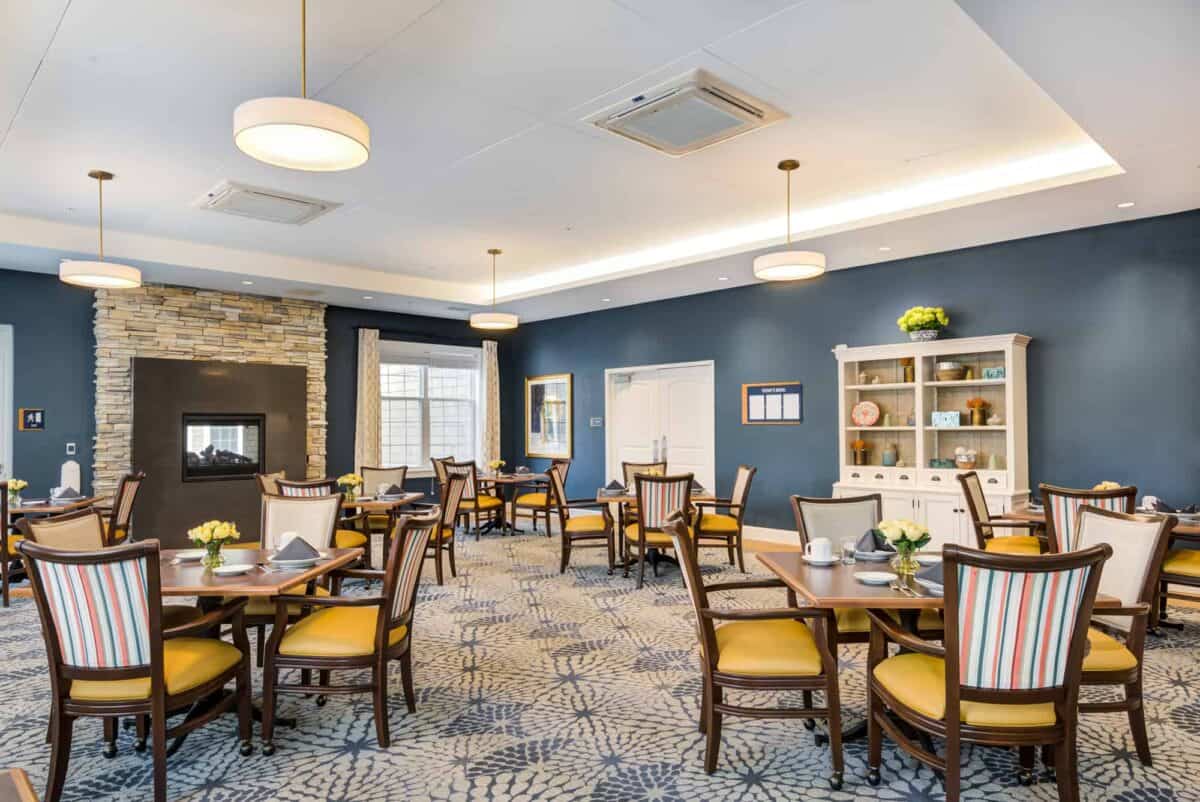
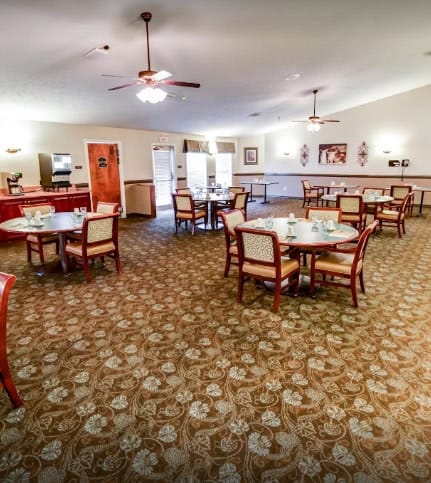
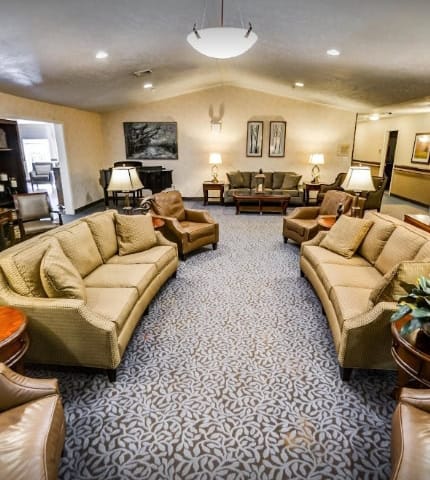
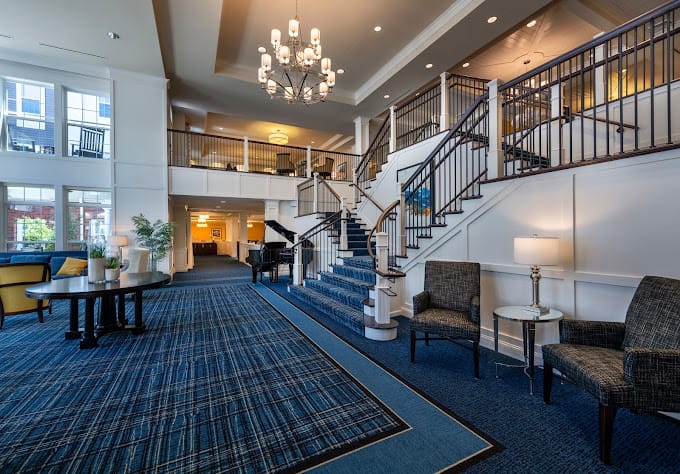
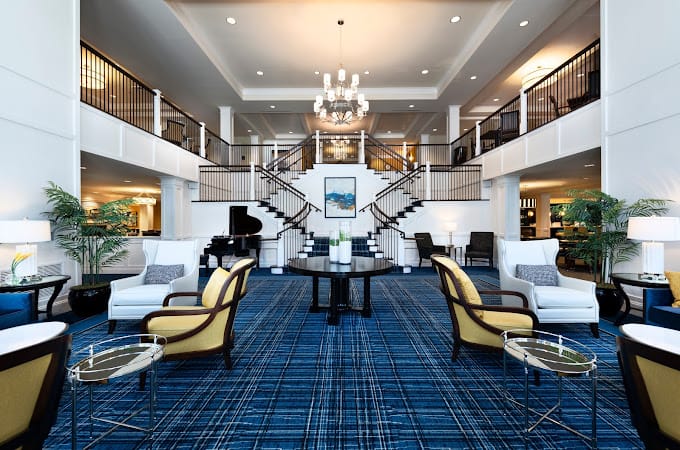
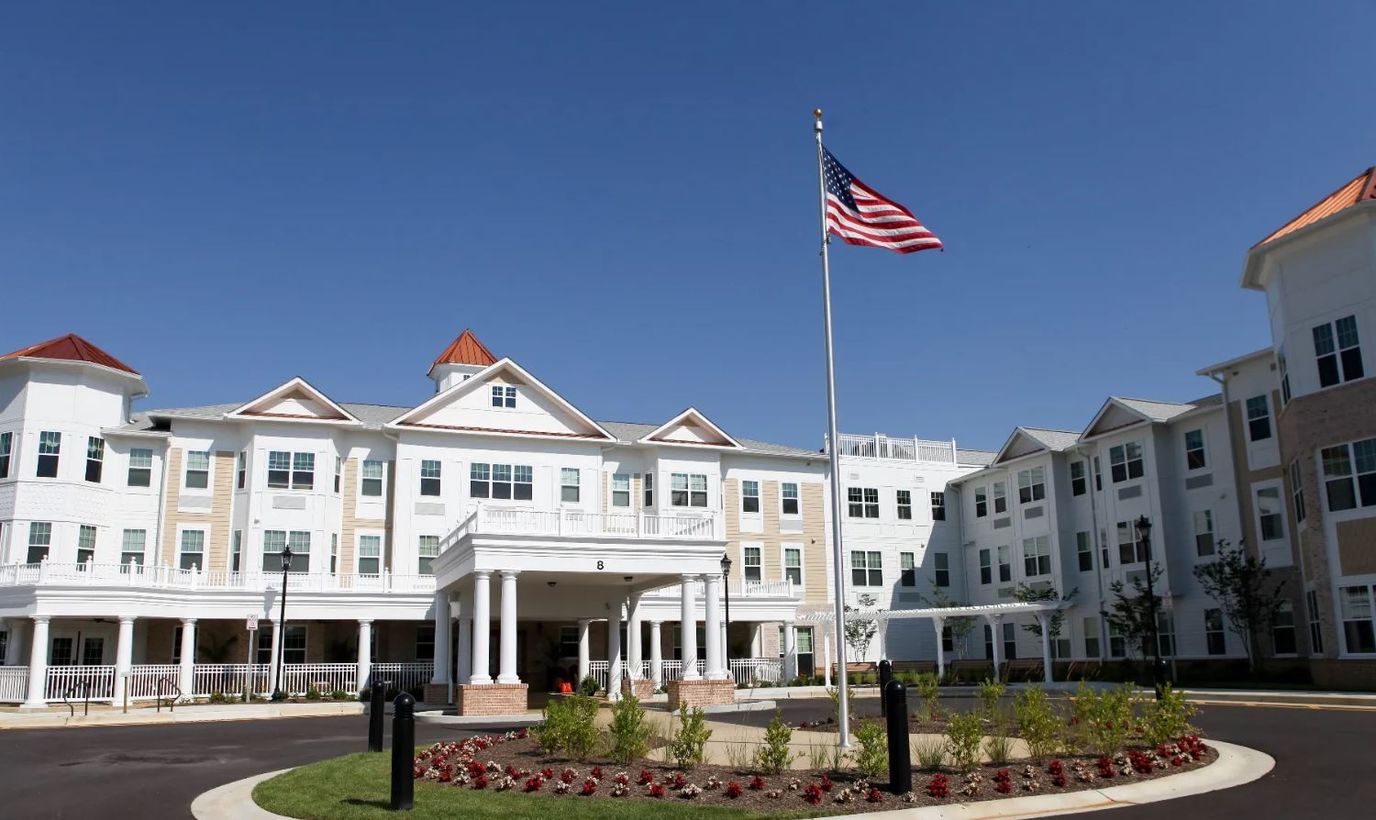
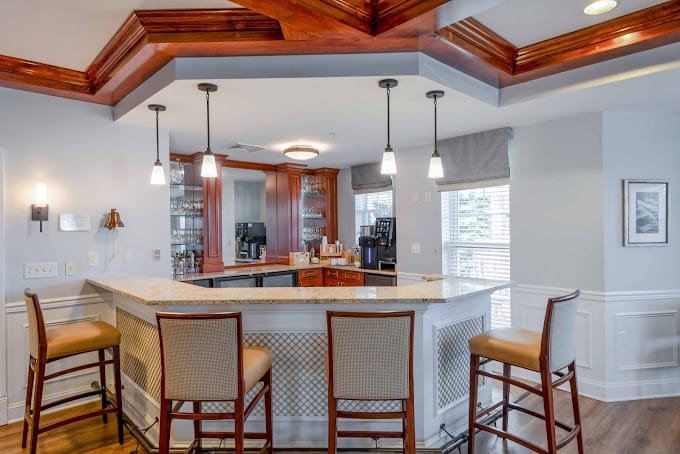
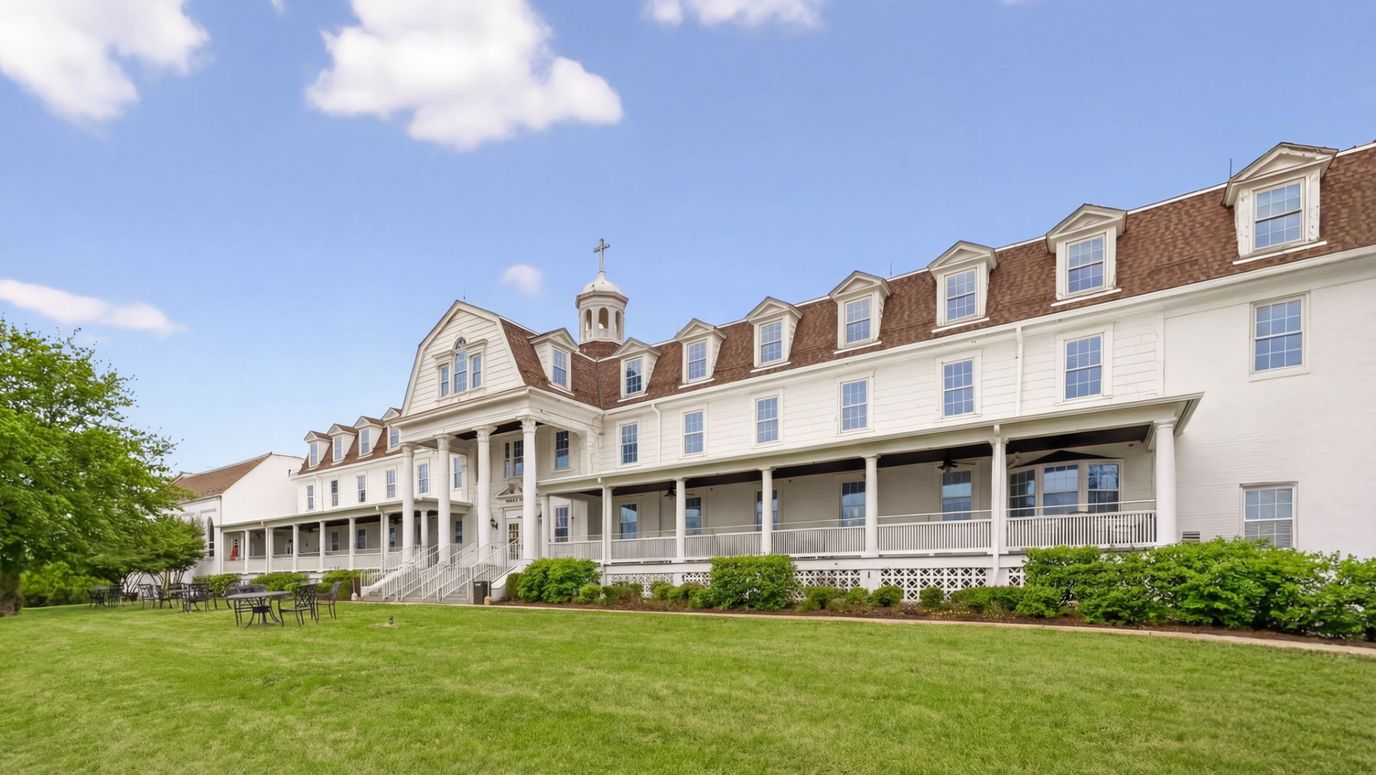
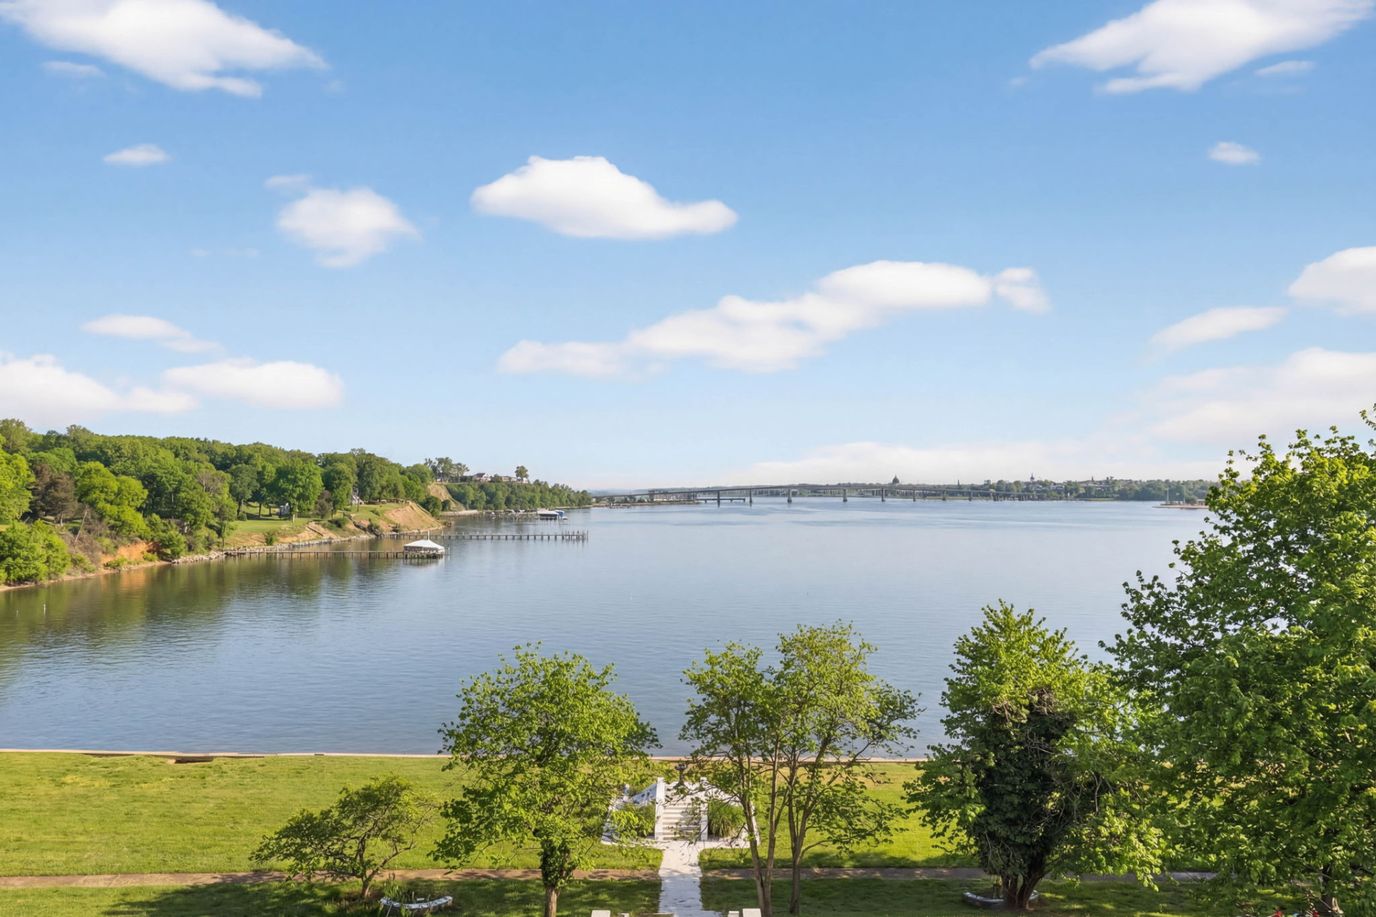
Ginger Cove in Annapolis, Maryland, offers a environment for residents of all needs. This Life-Care community caters to individuals 60 and over, providing independent living, assisted living, memory care, and nursing care options. Ginger Cove prioritizes resident well-being with a heartfelt, resident-centered approach. Their dedicated staff crafts personalized care plans to ensure your loved one receives the exact level of support needed. Residents thrive in a cozy, relaxing, and fun-filled atmosphere, enjoying delicious and nutritious meals served daily, along with a vibrant calendar of social gatherings, educational activities, and specialized programs.
A life free from everyday chores. Ginger Cove takes care of housekeeping, laundry, and even transportation to appointments. With newfound free time, residents can explore their interests in a variety of ways. Continuing education programs encourage lifelong learning, while an on-site wellness center and resort-inspired amenities like an indoor pool and walking trails promote physical and mental well-being. Prefer for a quiet afternoon in the meditation garden, a friendly game of croquet with neighbors, or a kayaking expedition on Gingerville Creek, there’s something for everyone. For those seeking adventure beyond campus, Ginger Cove provides safe and secure living while you explore historic Annapolis, venture to Washington D.C., or international Travels.
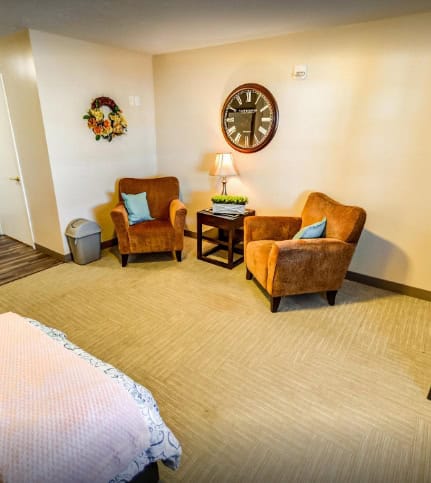
Offering personal care, rehabilitation, and short-term rehab, Baywoods of Annapolis is a 60+ assisted living community in Annapolis, Maryland, that has been operating for 17 years. The community has a current occupancy of 66.7%, with an average stay of 104 days. Dining services, transportation, and assistance with activities of daily living are also provided to support residents’ daily experiences. Pets are also welcome, allowing residents to bring animal companions.
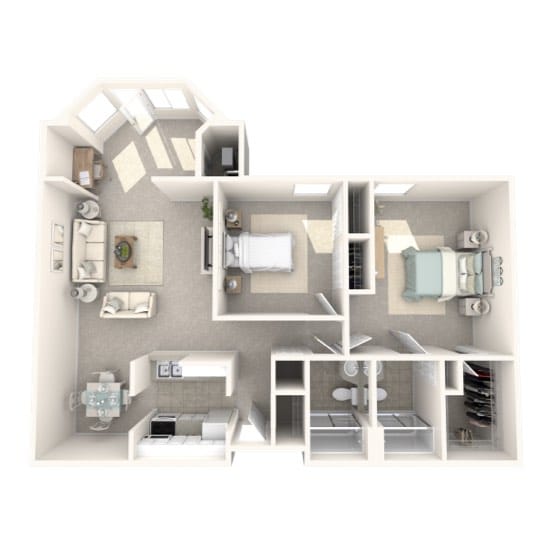
Fitness programs, lectures, and a variety of activities are conducted to promote holistic wellness and encourage active living. The community also features one- and two-bedroom apartments in a three-story setting, ensuring residents can rest comfortably. Its location on Bay Front Drive is also slightly walkable, with a Walk Score of 28, requiring residents to access most amenities through transportation, though some services are available within walking distance. Baywoods of Annapolis also accepts Medicare and private pay, providing more payment options.
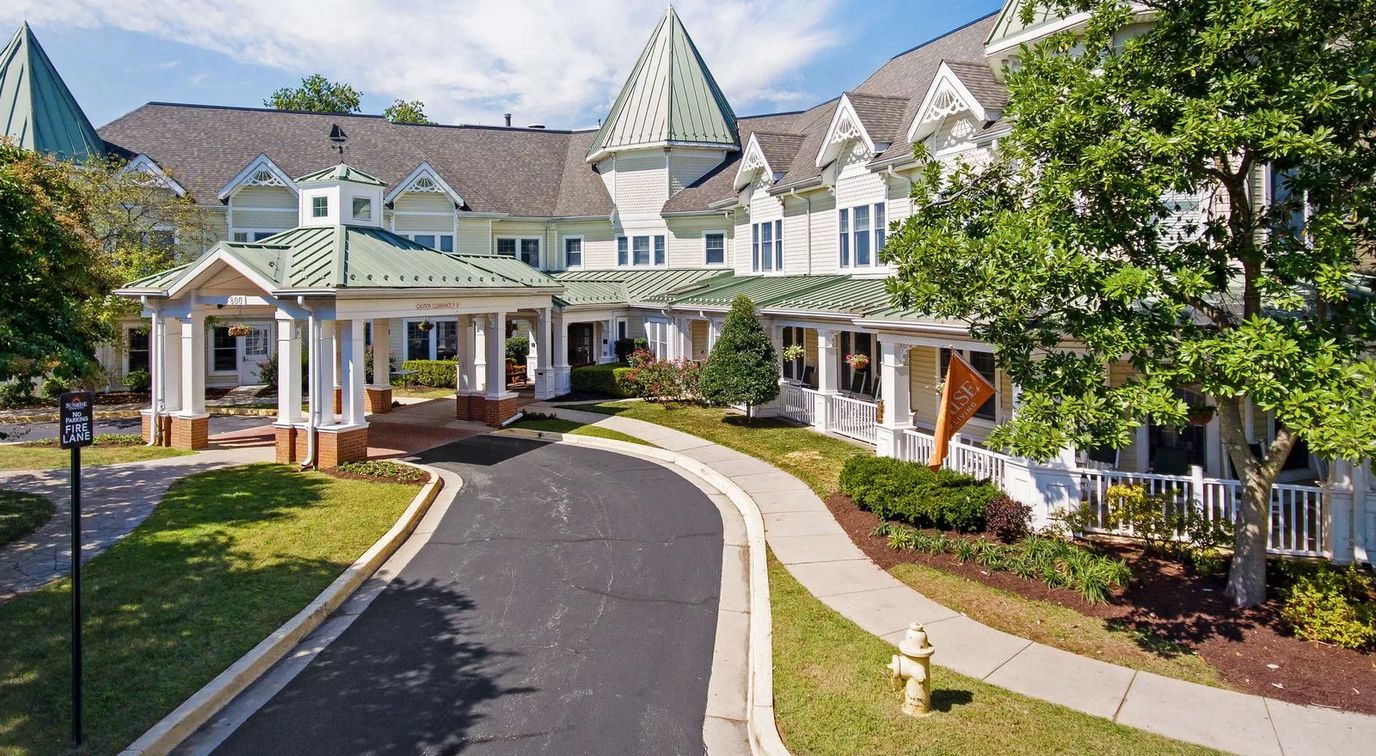
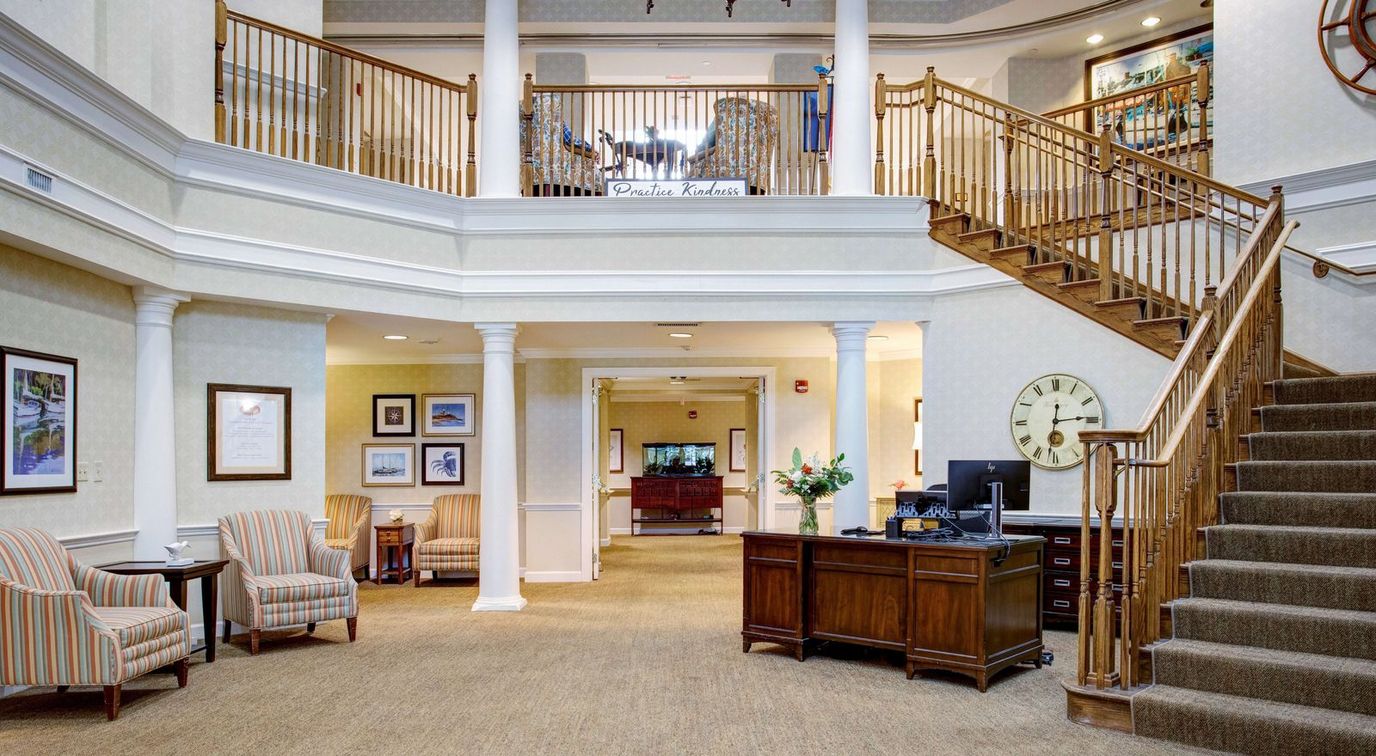
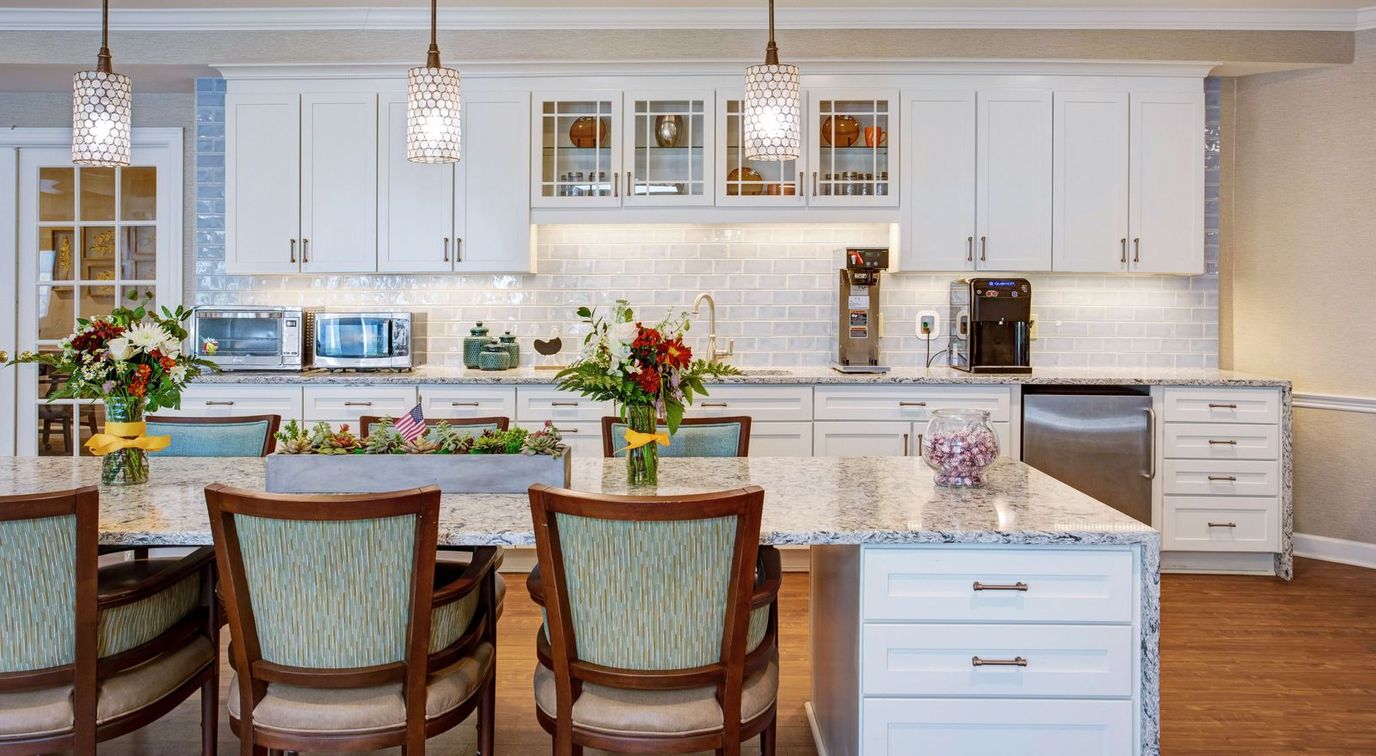
Offering assisted living and memory care, Sunrise of Annapolis is one of the best senior living facilities in the city. Contributing to the recognition of the community’s overall excellent service and caregiving, residents feel at home due to the exceptional respect staff has provided with a welcoming approach—life at the Sunrise of Annapolis offers the opportunity and inspiration branded as a Sunrise lifestyle.
The senior living community’s services and amenities include activities and programs that promote a continuum of growth and meaningful experiences that cultivate their golden years– weekly housekeeping and laundry, outings and activities, daily delicious and nutritious meals, and specialized programs.
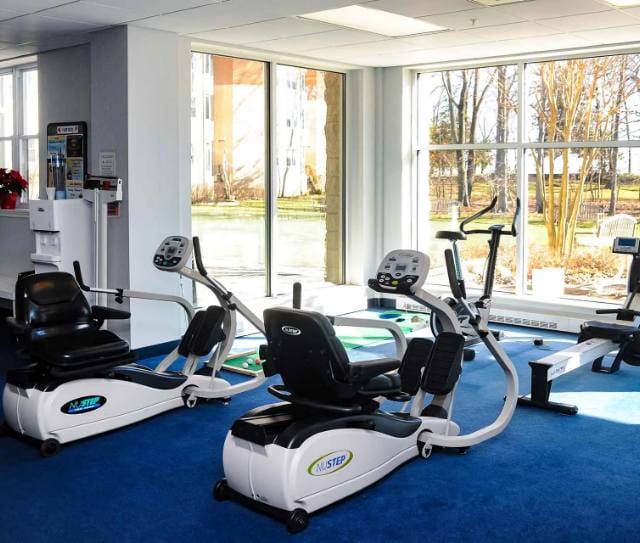
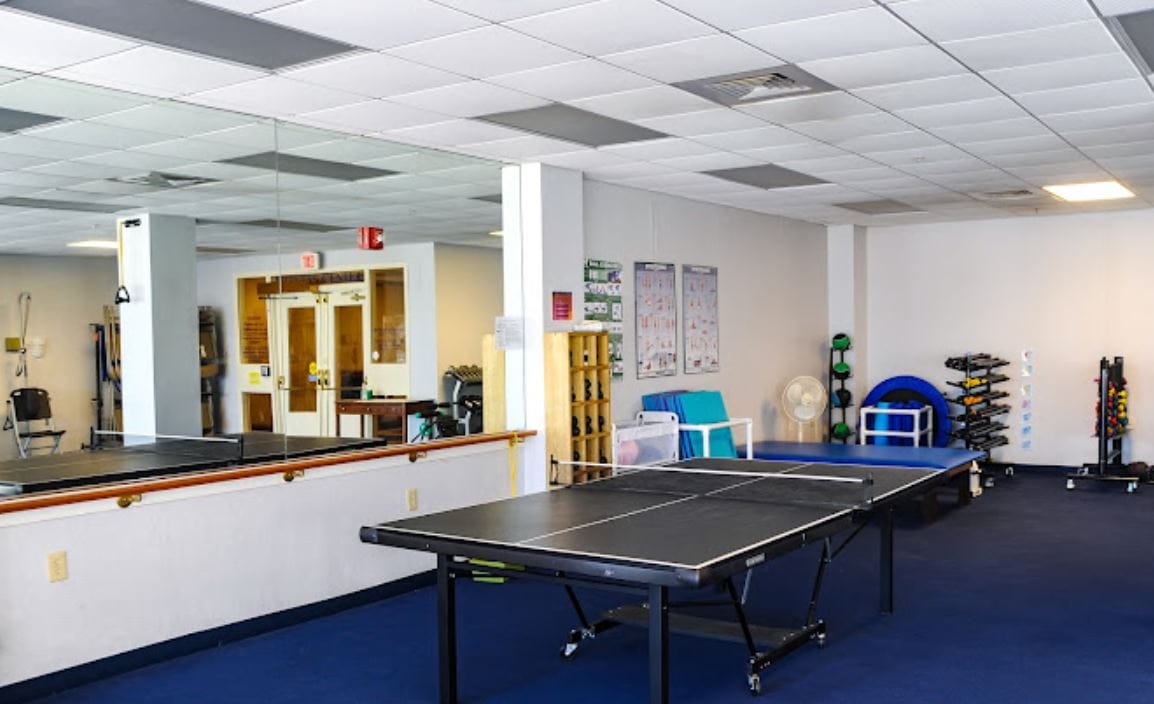
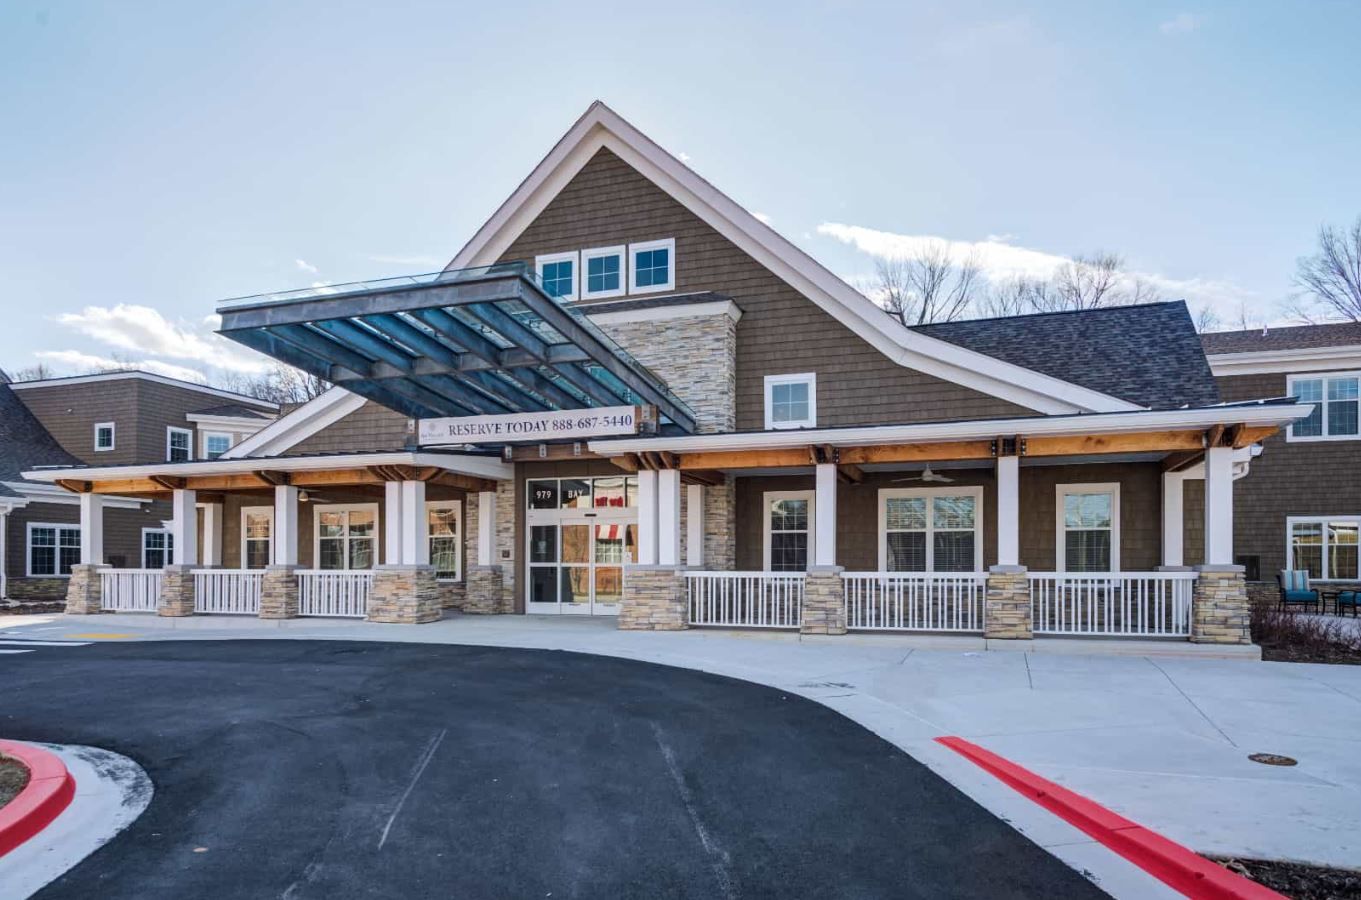
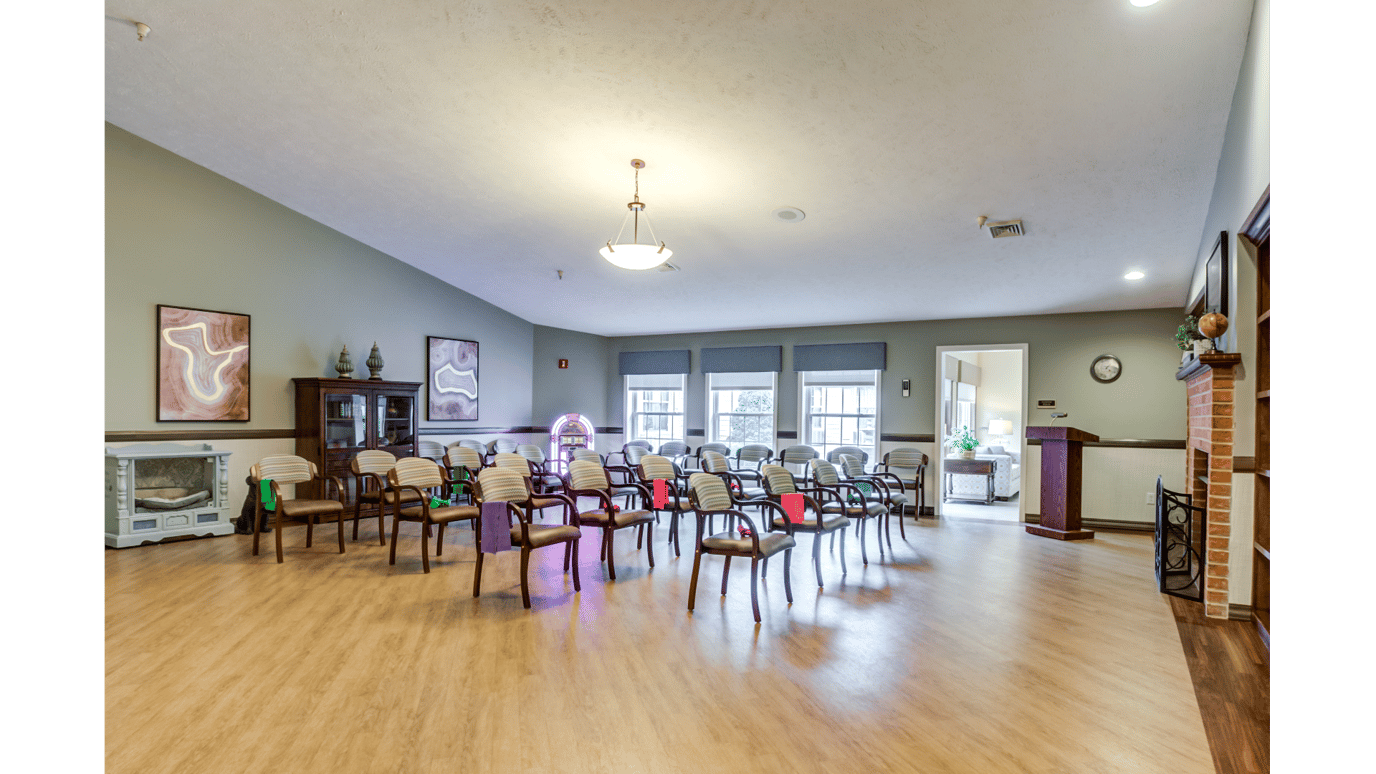
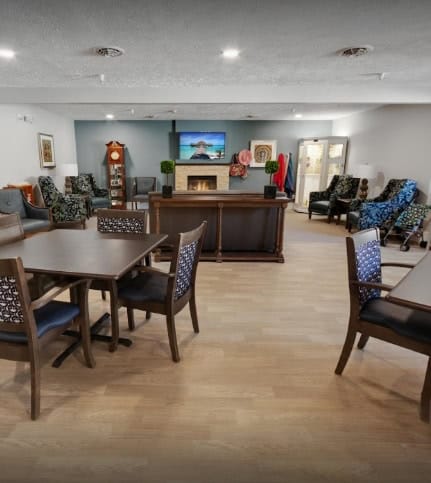
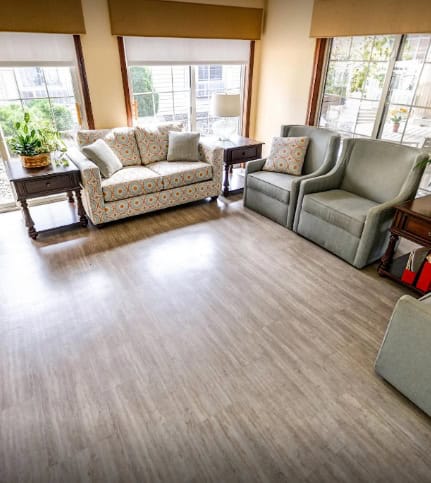
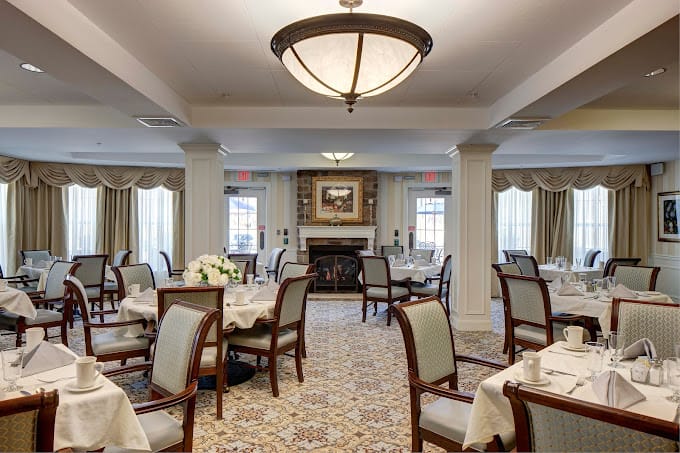
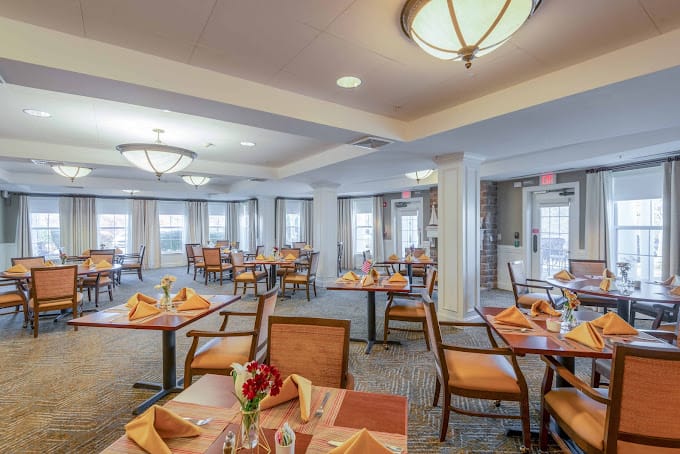
Located in Annapolis, Maryland, Bay Village is an exceptional assisted living community offering a range of amenities and activities tailored for residents’ health and enjoyment. With unwavering commitment, this senior living community provides round-the-clock support to meet individual needs. The caring staff assists with daily tasks like bathing and grooming.
Bay Village prioritizes well-being, offering spacious 1-bedroom and studio residences. A modern fitness center and therapy suite inspire an active lifestyle. Bay Village invites residents on a fulfilling journey, celebrating every aspect of life. Residents can engage in a lively social calendar featuring various events. The community ensures convenience through weekly housekeeping and laundry services, allowing residents to savor meaningful experiences. Culinary excellence shines with three balanced daily meals, served in an elegant two-story atrium or restaurant-quality dining.
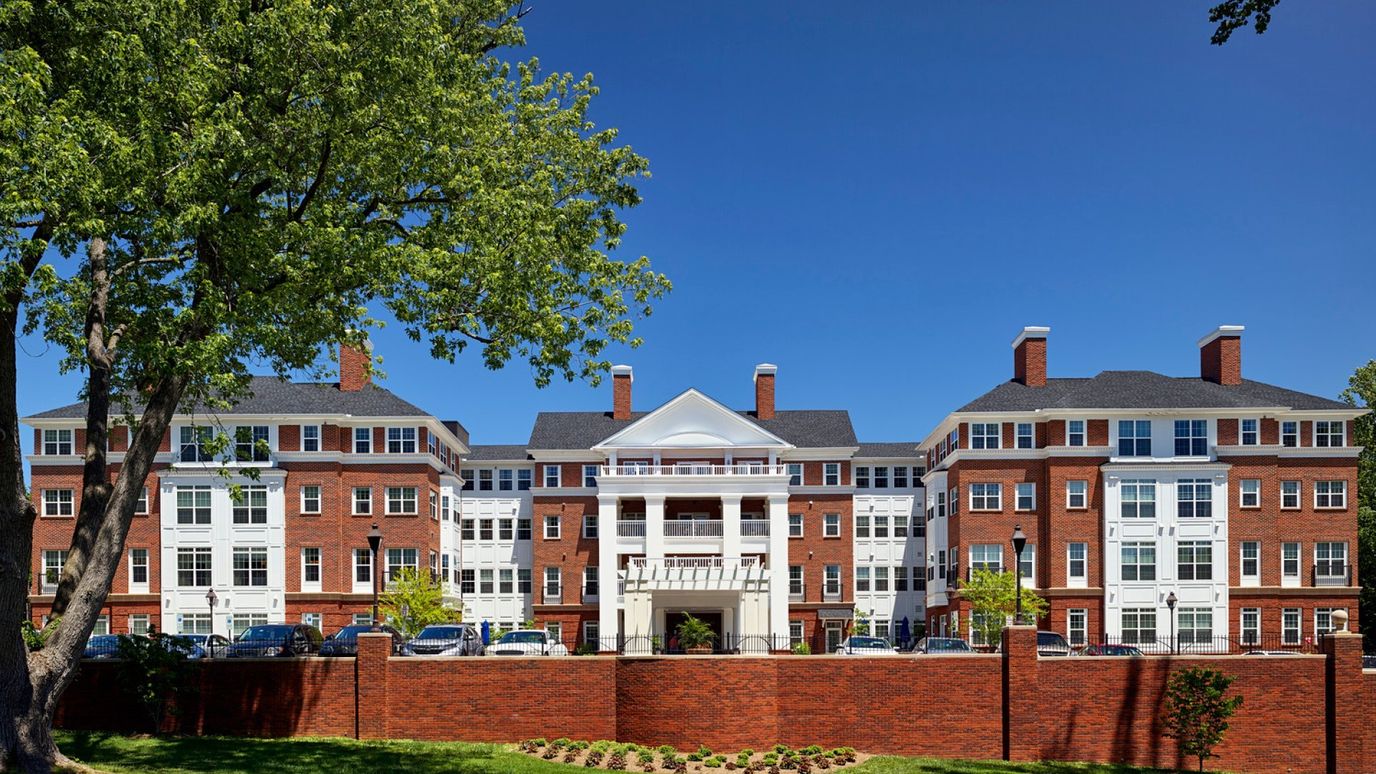
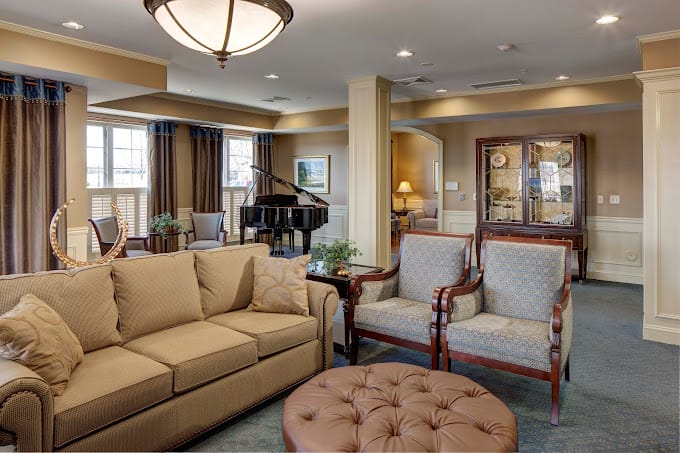
Conveniently located in Annapolis, Maryland, Brightview Annapolis offers a variety of senior living choices. This state-of-the-art senior apartment community boasts upscale amenities, featuring senior Independent Living, Assisted Living, and Memory Care rental apartment homes. Individuals can immerse themselves in the essence of this community situated on Generals Highway.
Senior residents can get access to a café, a pub, a well-appointed beauty salon and barber shop, as well as a fully equipped fitness center, all meticulously designed to prioritize comfort. Positioned conveniently on Generals Highway, residents also enjoy access to retail shopping options. Each day unfolds with an assortment of captivating activities, elevating the vibrant senior living encounter awaiting residents at Brightview Annapolis.
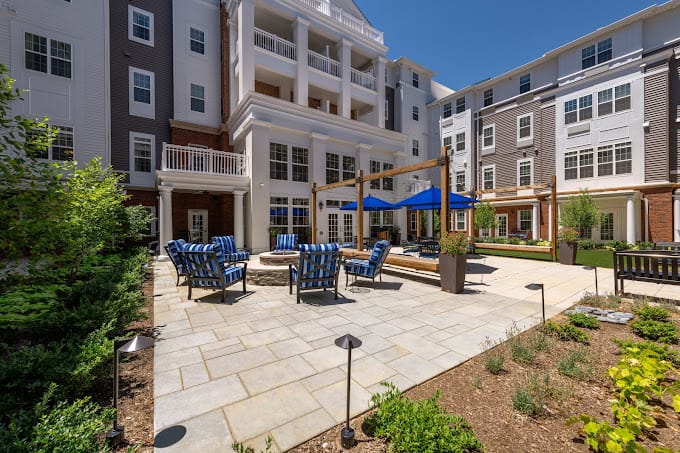
Situated in Edgewater, Maryland, Brightview South River is a premier destination for assisted living, serving Anne Arundel County, Annapolis, Davidsonville, Crofton, and Crownsville. This assisted living community presents a range of living options tailored to seniors’ unique needs. With a dedication to enhancing every aspect of senior living, Brightview South River empowers residents to embrace life to the fullest.
With 64 Assisted Living apartments and an exclusive 26-apartment enclave called Wellspring Village®, devoted to cutting-edge Dementia Care, this senior living community prioritizes comprehensive well-being. Here, seniors find the perfect blend of assistance and a vibrant lifestyle. Offering a nurturing environment, they ensure that residents receive the support they require while enjoying their life.
Overview of Celebration Villa of Manresa

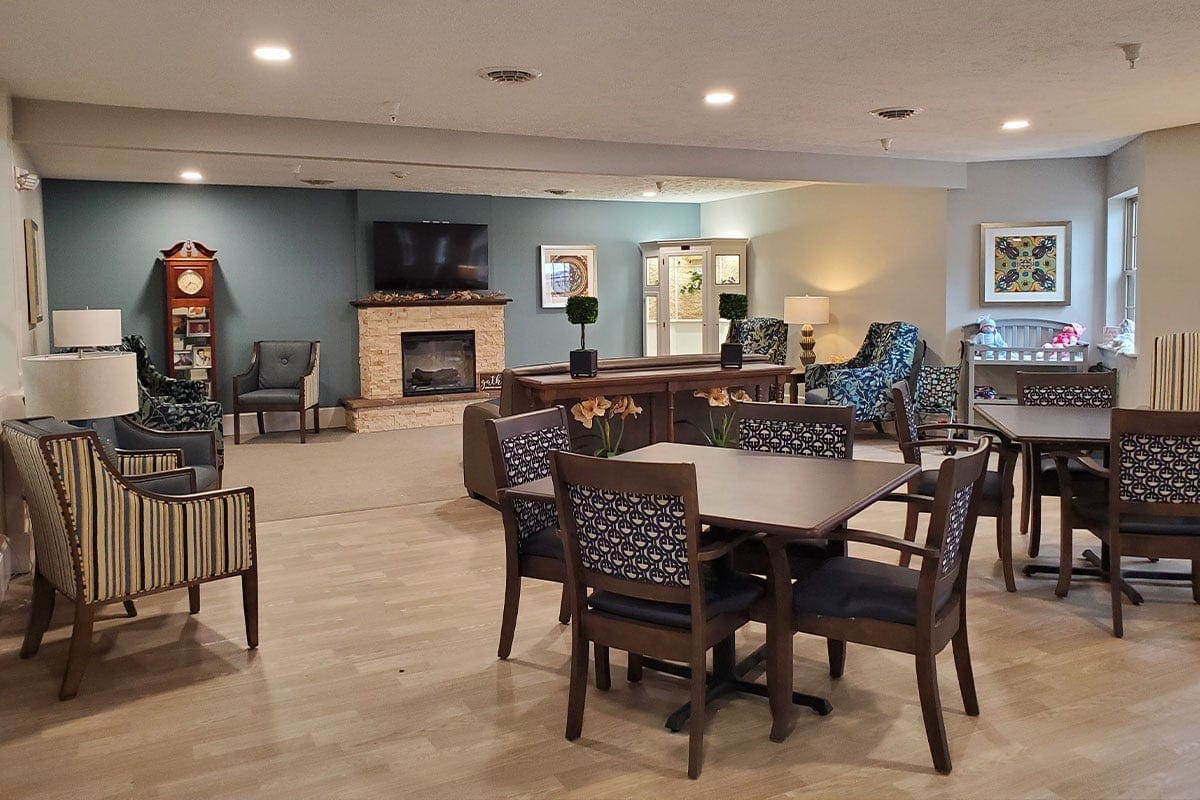
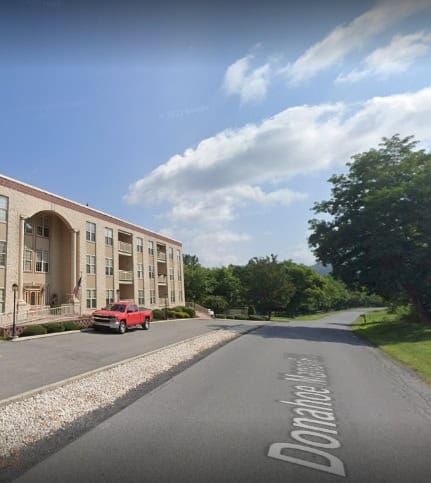
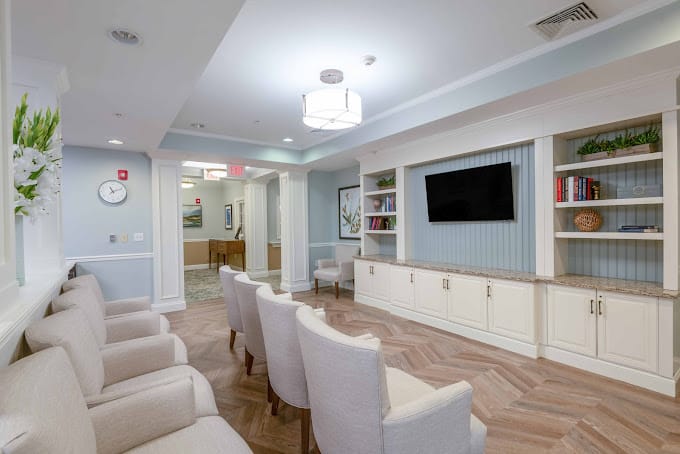
Overlooking the neighborhood of Annapolis, MD, Celebration Villa of Manresa is a safe haven for those who need assisted living. An excellent care team is available 24 hours a day, 7 days a week to assist residents with their daily living activities like personal care. Medical professionals like doctors, podiatrists, and dentists regularly visit residents to offer any services they may need to maintain their well-being.
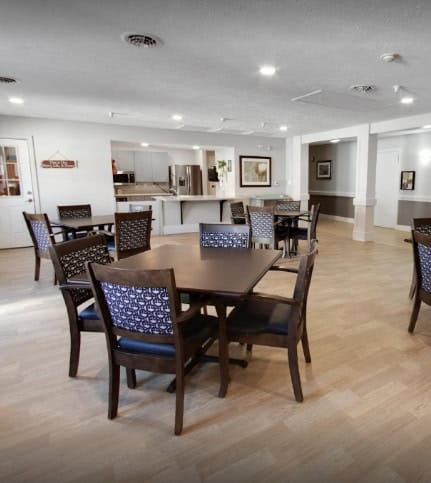
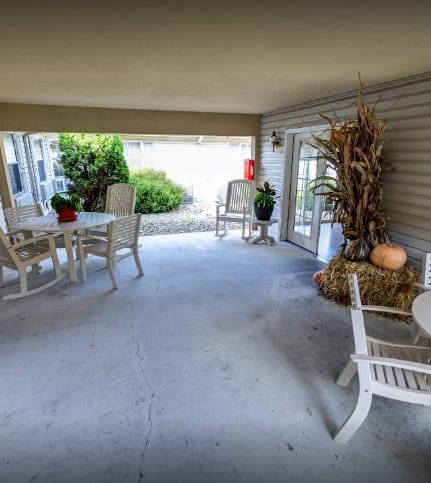
Residents enjoy countless opportunities for fun and enrichment with numerous activities and programs conducted by the community. There are inviting common areas, spacious courtyards, and relaxing gardens that provide spaces for relaxation or connecting with friends. Amenities like housekeeping, maintenance, and transportation services are also available for added convenience.
Residing in the peaceful neighborhood of Bay Village Drive, Annapolis, MD, Integracare is an outstanding senior living community that provides assisted living, memory care, independent living, and short-term care. Dedicated to improving seniors’ well-being, the community provides round-the-clock care and assistance with a reliable and well-trained team. Keep peace of mind knowing your needs and aspirations are well-provided with Integracare.
The community fosters a vibrant and welcoming environment, creating opportunities for seniors to thrive and immerse themselves in their surroundings. Ensuring residents receive the right care for their ever-changing needs, Integracare provides customized care plans for better comfort and safety. Integracare was awarded the Best Assisted Living, Best Memory Care, and Best Independent living by US News and World Report in 2024 for its exceptional quality.
Treat yourself to a blissful retirement at Assisted Living of Annapolis, an inviitng community in Annapolis, MD, that offers assisted living and memory care. With its commitment to improving residents’ quality of life, the community continuously helps residents with their daily living activities and household tasks 24/7. Here, residents’ comfort and safety are guaranteed with accessible and purposely designed accommodations.
A carefully curated calendar of engaging activities and enriching programs is conducted to keep residents active and socially connected. Three delicious and well-balanced meals are also served to meet residents’ dietary needs and preferences. With medication management, residents are assured of taking their medicines as prescribed. The community is a good option fot those needing assistance to live comfortably in their golden years.
Golden Arms Assisted Living is an esteemed community in Annapolis, MD, offering assisted living. Dedicated to residents’ welfare, a respectful and well-trained team provides exceptional care tailored to their daily living activities 24/7. The community also handles the housekeeping and maintenance, providing residents with more time to do the things they love.
There is always something fun to do with exciting activities and enjoyable programs that highlight residents’ interests and capabilities. Have a delightful dining experience with delectable and healthy meals catering to nutritional requirements and preferences. With medication management, residents are assured of taking their medicines aas prescribed. The community is a good place for those looking to spend their golden years without worries, accompanied by its well-maintained amenities and high-quality services.
Ranking Methodology
How we rank these assisted living communities
Every community above is evaluated across six weighted categories using public data including state inspection records, review platforms, BBB profiles, and operator-published materials.
Weighting overview
- 35%Resident Experience
- 25%Regulatory
- 15%Visual Media
- 10%Website
- 10%Stability
- 5%Environment
01
Resident & Family Experience 35%
The single largest share of every ranking. Aggregated review sentiment and volume from major platforms — the closest signal to real resident experience.
- Includes
- Review Sentiment
- Review Volume
02
Regulatory & Safety Record 25%
State inspection records, citations, and complaint visits. We weight per-inspection rates more heavily than raw counts.
- Includes
- State Inspections
- Citations/Inspection
- % Inspections w/ Citations
- Complaint Visits
- Accreditations
- BBB Rating
03
Visual Media & Transparency 15%
Communities that publish high-quality visuals give families a real preview. No photos or tours = a negative transparency signal.
- Includes
- Video Tours
- Virtual Walkthroughs
- Photo Quantity
- Photo Quality
04
Website & Operator Transparency 10%
Site quality and whether the operator publishes basic accountability information — staff names, contact details, ownership.
- Includes
- Website Content
- Mobile Usability
- Staff Info Available
- Owner Info Available
05
Community Stability 10%
Operational signals indicating whether a community is well-run and meeting demand.
- Includes
- Occupancy Rate
- Bed Options
06
Environment & Pricing 5%
Walkability and pricing transparency. Walk Score is weighted higher for Independent Living than for Memory Care, where most residents do not leave unaccompanied.
- Includes
- Walk Score
- Pricing Transparency
Who we are
Your Senior Care Partner, Every Step of the Way
We help families find affordable senior communities and unlock same day discounts, Medicaid, and Medicare options tailored to your needs.
Contact us Today
Frequently Asked Questions about Assisted Living in Annapolis, MD
What is the average cost of assisted living in Annapolis, MD?
The average monthly cost of assisted living in Annapolis, MD is approximately $6,300. Actual rates vary by community, level of care, and floorplan.
What is the price range for assisted living in Annapolis, MD?
Assisted living in Annapolis, MD typically ranges from $5,800–$8,400 per month, depending on the community, room type, and care needs.
What is the typical staff-to-resident ratio at assisted living facilities in Annapolis, MD?
Assisted living facilities in Annapolis, MD typically operate with a staff-to-resident ratio in the range of 1:6 to 1:12.
What's the difference between assisted living and memory care in Maryland?
Assisted living in Maryland supports residents with daily activities (bathing, dressing, medication management) while preserving independence. Memory care is a specialized form of assisted living for residents living with Alzheimer's or dementia, and adds 24/7 secured environments, dementia-trained staff, and structured routines designed to reduce confusion and wandering.
What's the difference between assisted living and a nursing home in Maryland?
Assisted living in Maryland is a residential model focused on housing, hospitality, and help with daily activities. Nursing homes (skilled nursing facilities) provide 24/7 medical care from licensed nurses for residents with significant health needs, and are regulated more strictly under both state and federal CMS rules.
Does Maryland Medicaid cover assisted living?
Maryland Medicaid does not directly pay room-and-board for assisted living, but most states (including Maryland) offer Home and Community-Based Services (HCBS) waivers that can offset the cost of care services delivered inside a licensed community. Eligibility, waitlists, and covered services vary — check directly with the state Medicaid agency.
What is assisted living?
Assisted living combines private or semi-private apartments with help on activities of daily living (meals, bathing, dressing, medication management) and a social calendar — for residents who need some support but do not need 24/7 medical care.
Updated on
