


Compare Memory Care around Baltimore (Metro Area)
Info below is compiled from the MD Dept. of Health (OHCQ), senior community websites & trusted data sources such as Walk Score & BBB.
Communities are listed from highest to lowest based on our ranking methodology.
| Morningside House At Satyr Hill | MC AL HOS RC | Parkville (Woodcroft) | 125
Facility
125
MD AVG
42
Rank
#68 / 685 | Yes |
72
Facility
72
MD AVG
43
Rank
#160 / 985 | Private Rooms / Semi-Private Rooms | 28
Facility
28
MD AVG
21
Rank
#53 / 210 | A+ |
34% Male Residents — State Benchmarked 34% of residents are male, compared to the Maryland average of 31%. This facility caters to a majority female resident pool (66% female), consistent with the broader assisted living trend where women significantly outnumber men. |
66% Female Residents — State Benchmarked 66% of residents are female, compared to the Maryland average of 69%. Women comprise the large majority, consistent with national assisted living demographics where women live longer and enter care facilities at higher rates. |
98% White Residents — State Benchmarked 98% of residents are reported as White, compared to the Maryland average of 81%. A higher White share than is typical for assisted living in Maryland in this dataset — compare with peer facilities for local context. |
2% African American Residents — State Benchmarked 2% of residents are reported as African American or Black, compared to the Maryland average of 13%. A lower African American share than is typical in Maryland; local markets still vary widely. |
0% Other Ethnicity Residents — State Benchmarked 0% of residents fall into categories other than White or African American (combined), compared to the Maryland average of 6%. This column aggregates Hispanic, Asian, multiracial, and any other labeled groups that are not classified as White or African American. |
13% Residents Age 65–74 — State Benchmarked 13% of residents are 65–74, compared to the Maryland average of 13%. In line with the statewide profile for this youngest senior bracket in assisted living. |
40% Residents Age 75–84 — State Benchmarked 40% of residents are 75–84, compared to the Maryland average of 31%. A high concentration in this mid-range bracket, where residents typically need moderate support with daily activities. |
29% Residents Age 85–94 — State Benchmarked 29% of residents are 85–94, compared to the Maryland average of 44%. The population here skews younger than the statewide norm, which may indicate a more active, lower-acuity community. |
16% Residents Age 95+ — State Benchmarked 16% of residents are 95 or older, compared to the Maryland average of 16%. In line with the statewide profile for the oldest resident bracket. |
| Brightview Mays Chapel Ridge | MC AL IL | Timonium (Dixon Hill) | 89
Facility
89
MD AVG
42
Rank
#150 / 685 | Yes |
52
Facility
52
MD AVG
43
Rank
#402 / 985 | Studio / 1 Bed / 2 Bed | 50
Facility
50
MD AVG
21
Rank
#1 / 210 | A+ |
13% Male Residents — State Benchmarked 13% of residents are male, compared to the Maryland average of 31%. This facility caters to a majority female resident pool (87% female), consistent with the broader assisted living trend where women significantly outnumber men. |
87% Female Residents — State Benchmarked 87% of residents are female, compared to the Maryland average of 69%. Women comprise the large majority, consistent with national assisted living demographics where women live longer and enter care facilities at higher rates. |
99% White Residents — State Benchmarked 99% of residents are reported as White, compared to the Maryland average of 81%. A higher White share than is typical for assisted living in Maryland in this dataset — compare with peer facilities for local context. |
0% African American Residents — State Benchmarked 0% of residents are reported as African American or Black, compared to the Maryland average of 13%. A lower African American share than is typical in Maryland; local markets still vary widely. |
1% Other Ethnicity Residents — State Benchmarked 1% of residents fall into categories other than White or African American (combined), compared to the Maryland average of 6%. This column aggregates Hispanic, Asian, multiracial, and any other labeled groups that are not classified as White or African American. Reported subgroups in this total: Asian (1%). |
3% Residents Age 65–74 — State Benchmarked 3% of residents are 65–74, compared to the Maryland average of 13%. Fewer younger seniors suggests the resident population skews older, likely requiring higher acuity care and more hands-on support. |
30% Residents Age 75–84 — State Benchmarked 30% of residents are 75–84, compared to the Maryland average of 31%. This is the second most common age bracket in assisted living, representing residents with moderate care needs. |
48% Residents Age 85–94 — State Benchmarked 48% of residents are 85–94, compared to the Maryland average of 44%. This is typically the most common age bracket in assisted living — this facility is in line with the statewide norm. |
18% Residents Age 95+ — State Benchmarked 18% of residents are 95 or older, compared to the Maryland average of 16%. In line with the statewide profile for the oldest resident bracket. |
| Morningside House of Friendship | MC AL HOS RC | Hanover | 103
Facility
103
MD AVG
42
Rank
#103 / 685 | Yes |
36
Facility
36
MD AVG
43
Rank
#563 / 985 | Studio / 1 Bed / 2 Bed | 33
Facility
33
MD AVG
21
Rank
#25 / 210 | - |
23% Male Residents — State Benchmarked 23% of residents are male, compared to the Maryland average of 31%. This facility caters to a majority female resident pool (77% female), consistent with the broader assisted living trend where women significantly outnumber men. |
77% Female Residents — State Benchmarked 77% of residents are female, compared to the Maryland average of 69%. Women comprise the large majority, consistent with national assisted living demographics where women live longer and enter care facilities at higher rates. |
86% White Residents — State Benchmarked 86% of residents are reported as White, compared to the Maryland average of 81%. Close to the average for this category among assisted living facilities in Maryland with reported race/ethnicity data. |
13% African American Residents — State Benchmarked 13% of residents are reported as African American or Black, compared to the Maryland average of 13%. In line with the Maryland average for African American residents among facilities reporting this breakdown. |
1% Other Ethnicity Residents — State Benchmarked 1% of residents fall into categories other than White or African American (combined), compared to the Maryland average of 6%. This column aggregates Hispanic, Asian, multiracial, and any other labeled groups that are not classified as White or African American. Reported subgroups in this total: Asian (1%). |
8% Residents Age 65–74 — State Benchmarked 8% of residents are 65–74, compared to the Maryland average of 13%. Fewer younger seniors suggests the resident population skews older, likely requiring higher acuity care and more hands-on support. |
35% Residents Age 75–84 — State Benchmarked 35% of residents are 75–84, compared to the Maryland average of 31%. This is the second most common age bracket in assisted living, representing residents with moderate care needs. |
41% Residents Age 85–94 — State Benchmarked 41% of residents are 85–94, compared to the Maryland average of 44%. This is typically the most common age bracket in assisted living — this facility is in line with the statewide norm. |
16% Residents Age 95+ — State Benchmarked 16% of residents are 95 or older, compared to the Maryland average of 16%. In line with the statewide profile for the oldest resident bracket. |
| Springwell Senior Living Community | MC AL IL | Baltimore (West Rogers Avenue) | 151
Facility
151
MD AVG
42
Rank
#42 / 685 | No |
30
Facility
30
MD AVG
43
Rank
#627 / 985 | Studio / 1 Bed / 2 Bed | - | A+ |
20% Male Residents — State Benchmarked 20% of residents are male, compared to the Maryland average of 31%. This facility caters to a majority female resident pool (80% female), consistent with the broader assisted living trend where women significantly outnumber men. |
80% Female Residents — State Benchmarked 80% of residents are female, compared to the Maryland average of 69%. Women comprise the large majority, consistent with national assisted living demographics where women live longer and enter care facilities at higher rates. |
91% White Residents — State Benchmarked 91% of residents are reported as White, compared to the Maryland average of 81%. A higher White share than is typical for assisted living in Maryland in this dataset — compare with peer facilities for local context. |
6% African American Residents — State Benchmarked 6% of residents are reported as African American or Black, compared to the Maryland average of 13%. In line with the Maryland average for African American residents among facilities reporting this breakdown. |
3% Other Ethnicity Residents — State Benchmarked 3% of residents fall into categories other than White or African American (combined), compared to the Maryland average of 6%. This column aggregates Hispanic, Asian, multiracial, and any other labeled groups that are not classified as White or African American. Reported subgroups in this total: Hispanic (2%), Asian (1%). |
8% Residents Age 65–74 — State Benchmarked 8% of residents are 65–74, compared to the Maryland average of 13%. Fewer younger seniors suggests the resident population skews older, likely requiring higher acuity care and more hands-on support. |
30% Residents Age 75–84 — State Benchmarked 30% of residents are 75–84, compared to the Maryland average of 31%. This is the second most common age bracket in assisted living, representing residents with moderate care needs. |
45% Residents Age 85–94 — State Benchmarked 45% of residents are 85–94, compared to the Maryland average of 44%. This is typically the most common age bracket in assisted living — this facility is in line with the statewide norm. |
15% Residents Age 95+ — State Benchmarked 15% of residents are 95 or older, compared to the Maryland average of 16%. In line with the statewide profile for the oldest resident bracket. |
| Symphony Manor | MC AL RC | Baltimore (Roland Park) | 69
Facility
69
MD AVG
42
Rank
#183 / 685 | Yes |
71
Facility
71
MD AVG
43
Rank
#175 / 985 | Studio | 15
Facility
15
MD AVG
21
Rank
#133 / 210 | - |
21% Male Residents — State Benchmarked 21% of residents are male, compared to the Maryland average of 31%. This facility caters to a majority female resident pool (79% female), consistent with the broader assisted living trend where women significantly outnumber men. |
79% Female Residents — State Benchmarked 79% of residents are female, compared to the Maryland average of 69%. Women comprise the large majority, consistent with national assisted living demographics where women live longer and enter care facilities at higher rates. |
79% White Residents — State Benchmarked 79% of residents are reported as White, compared to the Maryland average of 81%. Close to the average for this category among assisted living facilities in Maryland with reported race/ethnicity data. |
19% African American Residents — State Benchmarked 19% of residents are reported as African American or Black, compared to the Maryland average of 13%. In line with the Maryland average for African American residents among facilities reporting this breakdown. |
1% Other Ethnicity Residents — State Benchmarked 1% of residents fall into categories other than White or African American (combined), compared to the Maryland average of 6%. This column aggregates Hispanic, Asian, multiracial, and any other labeled groups that are not classified as White or African American. Reported subgroups in this total: Asian (1%). |
15% Residents Age 65–74 — State Benchmarked 15% of residents are 65–74, compared to the Maryland average of 13%. In line with the statewide profile for this youngest senior bracket in assisted living. |
44% Residents Age 75–84 — State Benchmarked 44% of residents are 75–84, compared to the Maryland average of 31%. A high concentration in this mid-range bracket, where residents typically need moderate support with daily activities. |
18% Residents Age 85–94 — State Benchmarked 18% of residents are 85–94, compared to the Maryland average of 44%. The population here skews younger than the statewide norm, which may indicate a more active, lower-acuity community. |
24% Residents Age 95+ — State Benchmarked 24% of residents are 95 or older, compared to the Maryland average of 16%. A high proportion of the oldest-old suggests strong end-of-life care experience and very-high-acuity capabilities. |
| Brightview White Marsh | MC AL | Nottingham | 99
Facility
99
MD AVG
42
Rank
#122 / 685 | Yes |
49
Facility
49
MD AVG
43
Rank
#431 / 985 | Studio / 1 Bed | 25
Facility
25
MD AVG
21
Rank
#83 / 210 | - |
17% Male Residents — State Benchmarked 17% of residents are male, compared to the Maryland average of 31%. This facility caters to a majority female resident pool (83% female), consistent with the broader assisted living trend where women significantly outnumber men. |
83% Female Residents — State Benchmarked 83% of residents are female, compared to the Maryland average of 69%. Women comprise the large majority, consistent with national assisted living demographics where women live longer and enter care facilities at higher rates. |
98% White Residents — State Benchmarked 98% of residents are reported as White, compared to the Maryland average of 81%. A higher White share than is typical for assisted living in Maryland in this dataset — compare with peer facilities for local context. |
2% African American Residents — State Benchmarked 2% of residents are reported as African American or Black, compared to the Maryland average of 13%. A lower African American share than is typical in Maryland; local markets still vary widely. |
0% Other Ethnicity Residents — State Benchmarked 0% of residents fall into categories other than White or African American (combined), compared to the Maryland average of 6%. This column aggregates Hispanic, Asian, multiracial, and any other labeled groups that are not classified as White or African American. |
3% Residents Age 65–74 — State Benchmarked 3% of residents are 65–74, compared to the Maryland average of 13%. Fewer younger seniors suggests the resident population skews older, likely requiring higher acuity care and more hands-on support. |
17% Residents Age 75–84 — State Benchmarked 17% of residents are 75–84, compared to the Maryland average of 31%. Below the state norm — the resident mix may skew either younger or older than this typical middle bracket. |
51% Residents Age 85–94 — State Benchmarked 51% of residents are 85–94, compared to the Maryland average of 44%. A high concentration of very elderly residents signals a higher-acuity facility with experience caring for advanced age-related needs. |
29% Residents Age 95+ — State Benchmarked 29% of residents are 95 or older, compared to the Maryland average of 16%. A high proportion of the oldest-old suggests strong end-of-life care experience and very-high-acuity capabilities. |
| Brightview Bel Air | MC AL | Bel Air (West Ring Factory Road) | 100
Facility
100
MD AVG
42
Rank
#109 / 685 | Yes |
16
Facility
16
MD AVG
43
Rank
#772 / 985 | - | 27
Facility
27
MD AVG
21
Rank
#62 / 210 | - |
20% Male Residents — State Benchmarked 20% of residents are male, compared to the Maryland average of 31%. This facility caters to a majority female resident pool (80% female), consistent with the broader assisted living trend where women significantly outnumber men. |
80% Female Residents — State Benchmarked 80% of residents are female, compared to the Maryland average of 69%. Women comprise the large majority, consistent with national assisted living demographics where women live longer and enter care facilities at higher rates. |
96% White Residents — State Benchmarked 96% of residents are reported as White, compared to the Maryland average of 81%. A higher White share than is typical for assisted living in Maryland in this dataset — compare with peer facilities for local context. |
1% African American Residents — State Benchmarked 1% of residents are reported as African American or Black, compared to the Maryland average of 13%. A lower African American share than is typical in Maryland; local markets still vary widely. |
3% Other Ethnicity Residents — State Benchmarked 3% of residents fall into categories other than White or African American (combined), compared to the Maryland average of 6%. This column aggregates Hispanic, Asian, multiracial, and any other labeled groups that are not classified as White or African American. Reported subgroups in this total: Asian (1%), Hawaiian/Pacific Islander (1%). |
5% Residents Age 65–74 — State Benchmarked 5% of residents are 65–74, compared to the Maryland average of 13%. Fewer younger seniors suggests the resident population skews older, likely requiring higher acuity care and more hands-on support. |
33% Residents Age 75–84 — State Benchmarked 33% of residents are 75–84, compared to the Maryland average of 31%. This is the second most common age bracket in assisted living, representing residents with moderate care needs. |
48% Residents Age 85–94 — State Benchmarked 48% of residents are 85–94, compared to the Maryland average of 44%. This is typically the most common age bracket in assisted living — this facility is in line with the statewide norm. |
13% Residents Age 95+ — State Benchmarked 13% of residents are 95 or older, compared to the Maryland average of 16%. In line with the statewide profile for the oldest resident bracket. |
| Brightview Catonsville | MC AL | Catonsville (South Rolling Road) | 95
Facility
95
MD AVG
42
Rank
#136 / 685 | Yes |
23
Facility
23
MD AVG
43
Rank
#704 / 985 | Studio / 1 Bed / 2 Bed | 24
Facility
24
MD AVG
21
Rank
#93 / 210 | - |
37% Male Residents — State Benchmarked 37% of residents are male, compared to the Maryland average of 31%. This facility caters to a majority female resident pool (63% female), consistent with the broader assisted living trend where women significantly outnumber men. |
63% Female Residents — State Benchmarked 63% of residents are female, compared to the Maryland average of 69%. Closer to an even gender split than most assisted living facilities, which typically have 65–75% female residents. |
94% White Residents — State Benchmarked 94% of residents are reported as White, compared to the Maryland average of 81%. A higher White share than is typical for assisted living in Maryland in this dataset — compare with peer facilities for local context. |
3% African American Residents — State Benchmarked 3% of residents are reported as African American or Black, compared to the Maryland average of 13%. A lower African American share than is typical in Maryland; local markets still vary widely. |
3% Other Ethnicity Residents — State Benchmarked 3% of residents fall into categories other than White or African American (combined), compared to the Maryland average of 6%. This column aggregates Hispanic, Asian, multiracial, and any other labeled groups that are not classified as White or African American. Reported subgroups in this total: Hispanic (3%). |
1% Residents Age 65–74 — State Benchmarked 1% of residents are 65–74, compared to the Maryland average of 13%. Fewer younger seniors suggests the resident population skews older, likely requiring higher acuity care and more hands-on support. |
34% Residents Age 75–84 — State Benchmarked 34% of residents are 75–84, compared to the Maryland average of 31%. This is the second most common age bracket in assisted living, representing residents with moderate care needs. |
40% Residents Age 85–94 — State Benchmarked 40% of residents are 85–94, compared to the Maryland average of 44%. This is typically the most common age bracket in assisted living — this facility is in line with the statewide norm. |
22% Residents Age 95+ — State Benchmarked 22% of residents are 95 or older, compared to the Maryland average of 16%. A high proportion of the oldest-old suggests strong end-of-life care experience and very-high-acuity capabilities. |
| Autumn Lake Healthcare Post Acute Care Center | MC NH PC RC SNF | Baltimore (Frankford) | 225
Facility
225
MD AVG
42
Rank
#7 / 685 | No |
68
Facility
68
MD AVG
43
Rank
#214 / 985 | - | - | - | - | - | - | - | - | - | - | - | - |
| Brightview Westminster Ridge | MC AL IL | Westminster (Brightview Westminster Ridge) | 75
Facility
75
MD AVG
42
Rank
#176 / 685 | Yes |
30
Facility
30
MD AVG
43
Rank
#627 / 985 | 1 Bed / 2 Bed | 20
Facility
20
MD AVG
21
Rank
#112 / 210 | - |
17% Male Residents — State Benchmarked 17% of residents are male, compared to the Maryland average of 31%. This facility caters to a majority female resident pool (83% female), consistent with the broader assisted living trend where women significantly outnumber men. |
83% Female Residents — State Benchmarked 83% of residents are female, compared to the Maryland average of 69%. Women comprise the large majority, consistent with national assisted living demographics where women live longer and enter care facilities at higher rates. |
98% White Residents — State Benchmarked 98% of residents are reported as White, compared to the Maryland average of 81%. A higher White share than is typical for assisted living in Maryland in this dataset — compare with peer facilities for local context. |
0% African American Residents — State Benchmarked 0% of residents are reported as African American or Black, compared to the Maryland average of 13%. A lower African American share than is typical in Maryland; local markets still vary widely. |
2% Other Ethnicity Residents — State Benchmarked 2% of residents fall into categories other than White or African American (combined), compared to the Maryland average of 6%. This column aggregates Hispanic, Asian, multiracial, and any other labeled groups that are not classified as White or African American. Reported subgroups in this total: Other (2%). |
3% Residents Age 65–74 — State Benchmarked 3% of residents are 65–74, compared to the Maryland average of 13%. Fewer younger seniors suggests the resident population skews older, likely requiring higher acuity care and more hands-on support. |
17% Residents Age 75–84 — State Benchmarked 17% of residents are 75–84, compared to the Maryland average of 31%. Below the state norm — the resident mix may skew either younger or older than this typical middle bracket. |
67% Residents Age 85–94 — State Benchmarked 67% of residents are 85–94, compared to the Maryland average of 44%. A high concentration of very elderly residents signals a higher-acuity facility with experience caring for advanced age-related needs. |
10% Residents Age 95+ — State Benchmarked 10% of residents are 95 or older, compared to the Maryland average of 16%. Most residents here have not yet reached the oldest-old bracket, suggesting a younger overall community. |
| Roland Park Place Metropolitan Senior Living | MC AL RESC | Baltimore (Roland Park) | - | No |
94
Facility
94
MD AVG
43
Rank
#9 / 985 | 1 Bed / 2 Bed | - | - | - | - | - | - | - | - | - | - | - |
| Pleasant Garden Clover | MC AL HOS PC RC | Baltimore (Pimlico) | 15
Facility
15
MD AVG
42
Rank
#263 / 685 | No |
88
Facility
88
MD AVG
43
Rank
#39 / 985 | - | 15
Facility
15
MD AVG
21
Rank
#133 / 210 | A+ |
73% Male Residents — State Benchmarked 73% of residents are male, compared to the Maryland average of 31%. An unusually high male share for assisted living, where most facilities skew heavily female. |
27% Female Residents — State Benchmarked 27% of residents are female, compared to the Maryland average of 69%. An unusually low female share — most assisted living facilities have 65–75% female residents. |
9% White Residents — State Benchmarked 9% of residents are reported as White, compared to the Maryland average of 81%. A lower White share than the Maryland average — the community may draw a more diverse resident mix relative to other facilities in Maryland. |
91% African American Residents — State Benchmarked 91% of residents are reported as African American or Black, compared to the Maryland average of 13%. A higher African American share than the typical Maryland average — useful context when comparing cultural fit and community composition. |
0% Other Ethnicity Residents — State Benchmarked 0% of residents fall into categories other than White or African American (combined), compared to the Maryland average of 6%. This column aggregates Hispanic, Asian, multiracial, and any other labeled groups that are not classified as White or African American. |
55% Residents Age 65–74 — State Benchmarked 55% of residents are 65–74, compared to the Maryland average of 13%. A higher share of younger seniors often signals a more independent, active resident community with lower acuity care needs. |
27% Residents Age 75–84 — State Benchmarked 27% of residents are 75–84, compared to the Maryland average of 31%. This is the second most common age bracket in assisted living, representing residents with moderate care needs. | - | - |
| Charter Senior Living of Towson | MC AL NH | Baltimore (The Orchards) | 92
Facility
92
MD AVG
42
Rank
#146 / 685 | No |
36
Facility
36
MD AVG
43
Rank
#563 / 985 | Studio / 1 Bed | 5
Facility
5
MD AVG
21
Rank
#184 / 210 | - |
25% Male Residents — State Benchmarked 25% of residents are male, compared to the Maryland average of 31%. This facility caters to a majority female resident pool (75% female), consistent with the broader assisted living trend where women significantly outnumber men. |
75% Female Residents — State Benchmarked 75% of residents are female, compared to the Maryland average of 69%. Women comprise the large majority, consistent with national assisted living demographics where women live longer and enter care facilities at higher rates. |
88% White Residents — State Benchmarked 88% of residents are reported as White, compared to the Maryland average of 81%. Close to the average for this category among assisted living facilities in Maryland with reported race/ethnicity data. |
7% African American Residents — State Benchmarked 7% of residents are reported as African American or Black, compared to the Maryland average of 13%. In line with the Maryland average for African American residents among facilities reporting this breakdown. |
4% Other Ethnicity Residents — State Benchmarked 4% of residents fall into categories other than White or African American (combined), compared to the Maryland average of 6%. This column aggregates Hispanic, Asian, multiracial, and any other labeled groups that are not classified as White or African American. Reported subgroups in this total: Asian (3%), Hispanic (1%). | - |
22% Residents Age 75–84 — State Benchmarked 22% of residents are 75–84, compared to the Maryland average of 31%. Below the state norm — the resident mix may skew either younger or older than this typical middle bracket. |
60% Residents Age 85–94 — State Benchmarked 60% of residents are 85–94, compared to the Maryland average of 44%. A high concentration of very elderly residents signals a higher-acuity facility with experience caring for advanced age-related needs. |
15% Residents Age 95+ — State Benchmarked 15% of residents are 95 or older, compared to the Maryland average of 16%. In line with the statewide profile for the oldest resident bracket. |
| Brightview Towson | MC AL | Towson (Loch Raven) | 100
Facility
100
MD AVG
42
Rank
#109 / 685 | Yes |
92
Facility
92
MD AVG
43
Rank
#17 / 985 | Studio / 1 Bed / 2 Bed | 14
Facility
14
MD AVG
21
Rank
#140 / 210 | - |
28% Male Residents — State Benchmarked 28% of residents are male, compared to the Maryland average of 31%. This facility caters to a majority female resident pool (72% female), consistent with the broader assisted living trend where women significantly outnumber men. |
72% Female Residents — State Benchmarked 72% of residents are female, compared to the Maryland average of 69%. Women comprise the large majority, consistent with national assisted living demographics where women live longer and enter care facilities at higher rates. |
0% White Residents — State Benchmarked 0% of residents are reported as White, compared to the Maryland average of 81%. A lower White share than the Maryland average — the community may draw a more diverse resident mix relative to other facilities in Maryland. |
0% African American Residents — State Benchmarked 0% of residents are reported as African American or Black, compared to the Maryland average of 13%. A lower African American share than is typical in Maryland; local markets still vary widely. |
100% Other Ethnicity Residents — State Benchmarked 100% of residents fall into categories other than White or African American (combined), compared to the Maryland average of 6%. This column aggregates Hispanic, Asian, multiracial, and any other labeled groups that are not classified as White or African American. Reported subgroups in this total: Other (100%). | - | - | - | - |
| Brightview Perry Hall | MC AL IL | Nottingham | 70
Facility
70
MD AVG
42
Rank
#181 / 685 | Yes |
22
Facility
22
MD AVG
43
Rank
#719 / 985 | Studio / 1 Bed / 2 Bed | 12
Facility
12
MD AVG
21
Rank
#148 / 210 | - |
21% Male Residents — State Benchmarked 21% of residents are male, compared to the Maryland average of 31%. This facility caters to a majority female resident pool (79% female), consistent with the broader assisted living trend where women significantly outnumber men. |
79% Female Residents — State Benchmarked 79% of residents are female, compared to the Maryland average of 69%. Women comprise the large majority, consistent with national assisted living demographics where women live longer and enter care facilities at higher rates. |
97% White Residents — State Benchmarked 97% of residents are reported as White, compared to the Maryland average of 81%. A higher White share than is typical for assisted living in Maryland in this dataset — compare with peer facilities for local context. |
0% African American Residents — State Benchmarked 0% of residents are reported as African American or Black, compared to the Maryland average of 13%. A lower African American share than is typical in Maryland; local markets still vary widely. |
3% Other Ethnicity Residents — State Benchmarked 3% of residents fall into categories other than White or African American (combined), compared to the Maryland average of 6%. This column aggregates Hispanic, Asian, multiracial, and any other labeled groups that are not classified as White or African American. Reported subgroups in this total: Asian (2%), Hawaiian/Pacific Islander (2%). |
3% Residents Age 65–74 — State Benchmarked 3% of residents are 65–74, compared to the Maryland average of 13%. Fewer younger seniors suggests the resident population skews older, likely requiring higher acuity care and more hands-on support. |
54% Residents Age 75–84 — State Benchmarked 54% of residents are 75–84, compared to the Maryland average of 31%. A high concentration in this mid-range bracket, where residents typically need moderate support with daily activities. |
37% Residents Age 85–94 — State Benchmarked 37% of residents are 85–94, compared to the Maryland average of 44%. The population here skews younger than the statewide norm, which may indicate a more active, lower-acuity community. |
6% Residents Age 95+ — State Benchmarked 6% of residents are 95 or older, compared to the Maryland average of 16%. Most residents here have not yet reached the oldest-old bracket, suggesting a younger overall community. |
Rows per page:

View all Nearby Homes
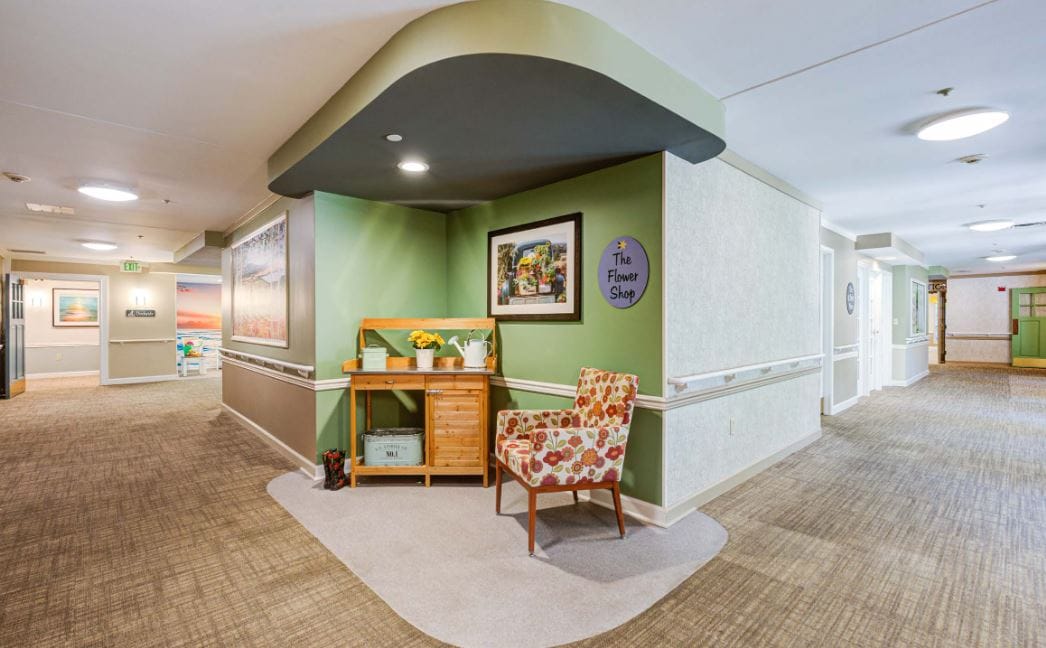
Arden Courts are one of the only few Promedical memory care communities that provide exceptional care. The community offers an inviting atmosphere with fine hospitality; the staff is ready to attend to any need one may have with compassion and dignity. Arden Courts maintain their residents’ sense of individuality while being able to enhance their quality of life in a nurturing environment.
Services are focused on the cognitive health and overall wellness of its residents– 24-hour supervision, medication management, outside rehabilitative care, and physical therapy available; as well as reassurance and advice support, structured programs, and mobility assistance.
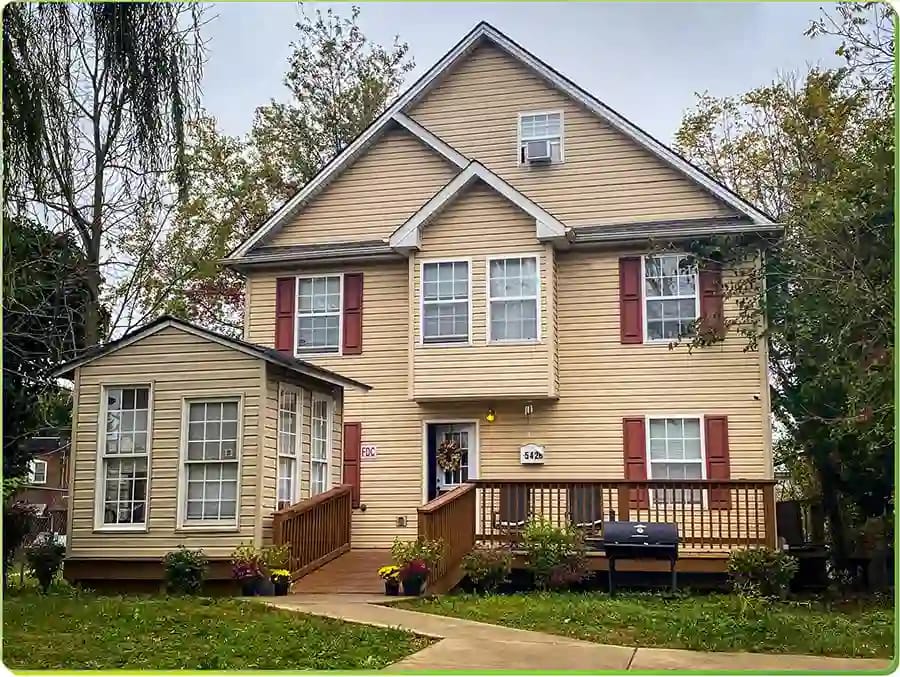
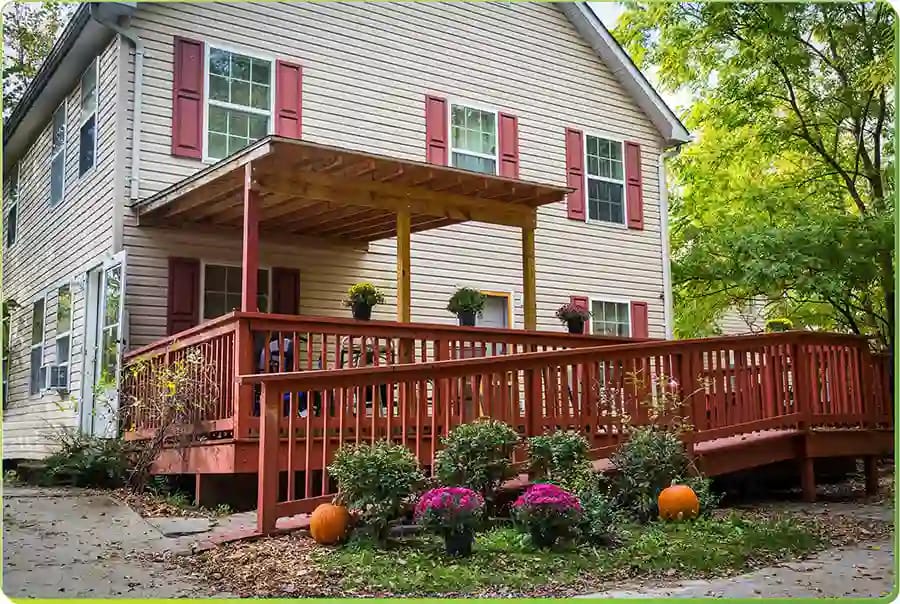
Pleasant Garden Pinewood, conveniently situated in the tranquil Pinewood Avenue, Baltimore, is a vibrant senior living community that provides assisted living in a family-like setting and within single-family homes. Dedicated to its mission, the community ensures to offer a secure, attended, comfortable, and beautiful home for its residents. Additionally, the community is committed to delivering the utmost care and catering to the immediate needs of its residents through a highly trained and dedicated team.
Having a goal to set the bar in assisted living services, this community envisions itself to become an expert and advocate in the research and practice of non-medical care and quality of life. Thus, seniors are guaranteed top-quality services and a secure living experience with Pleasant Garden Pinewoods.
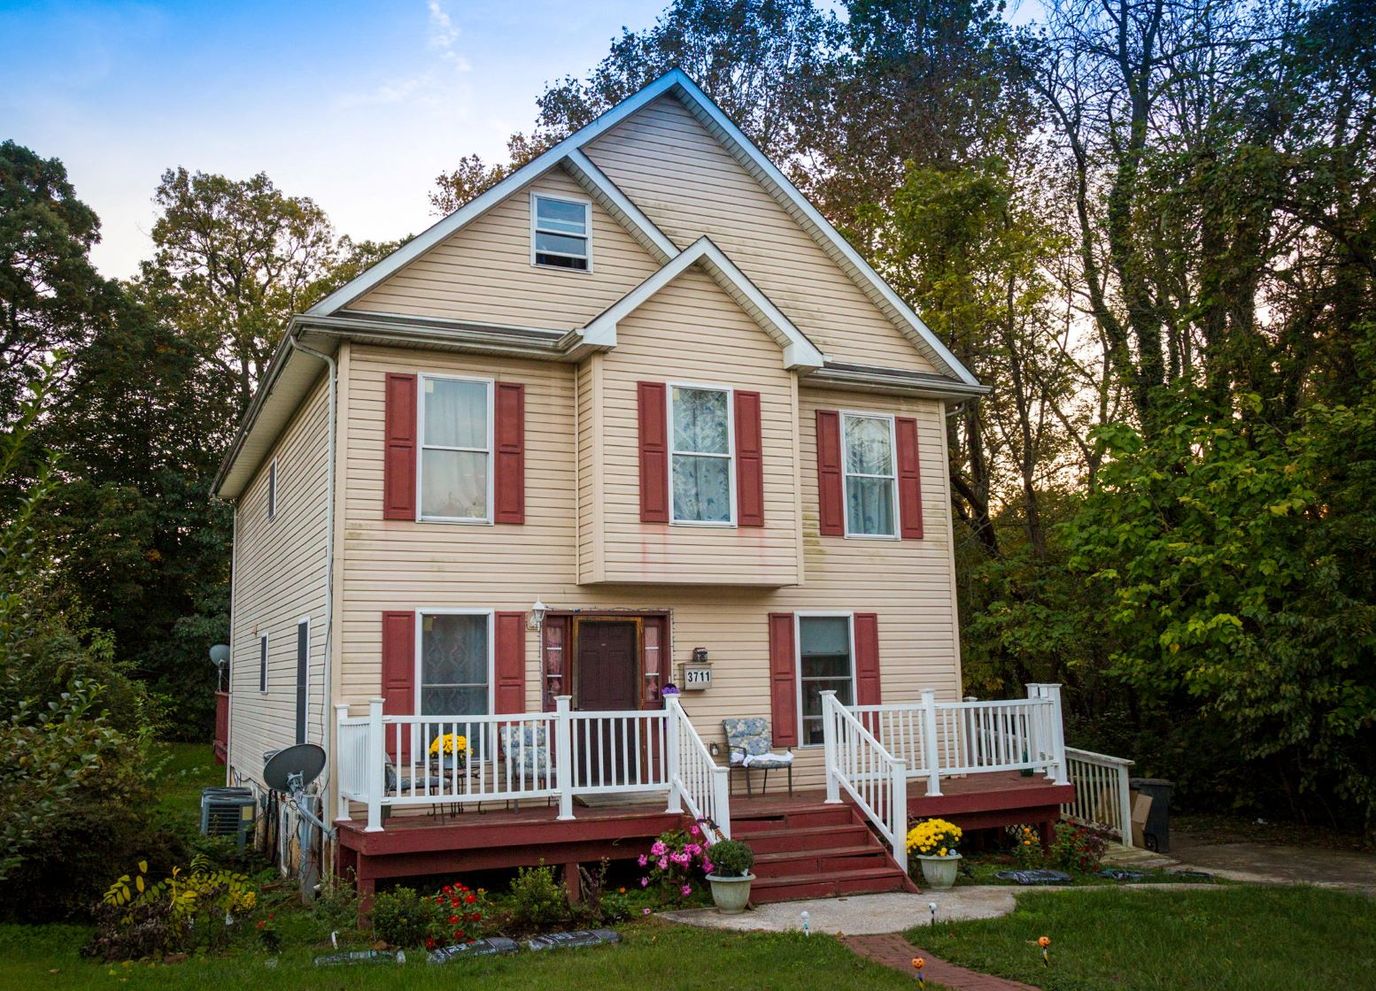
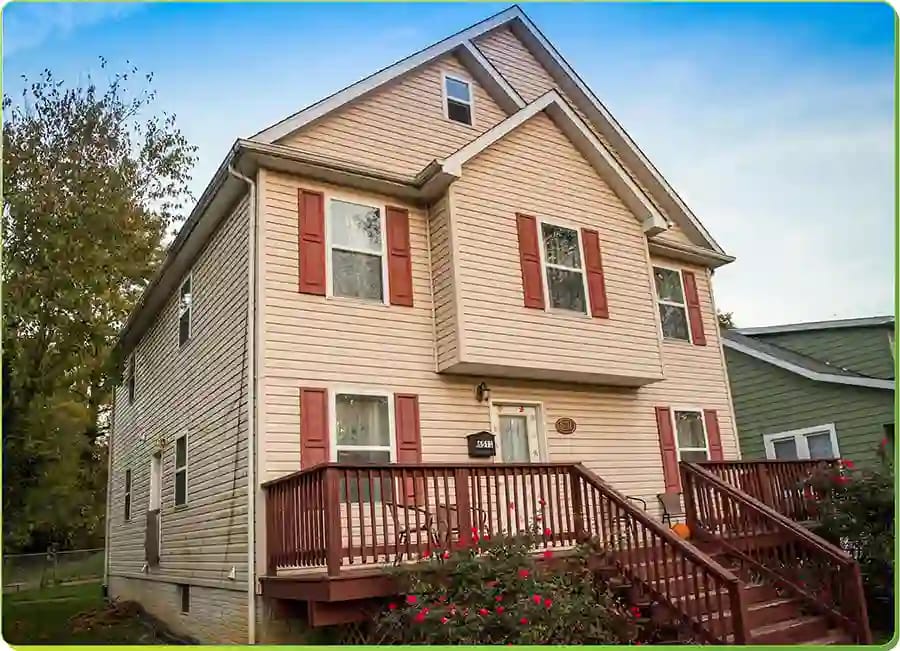
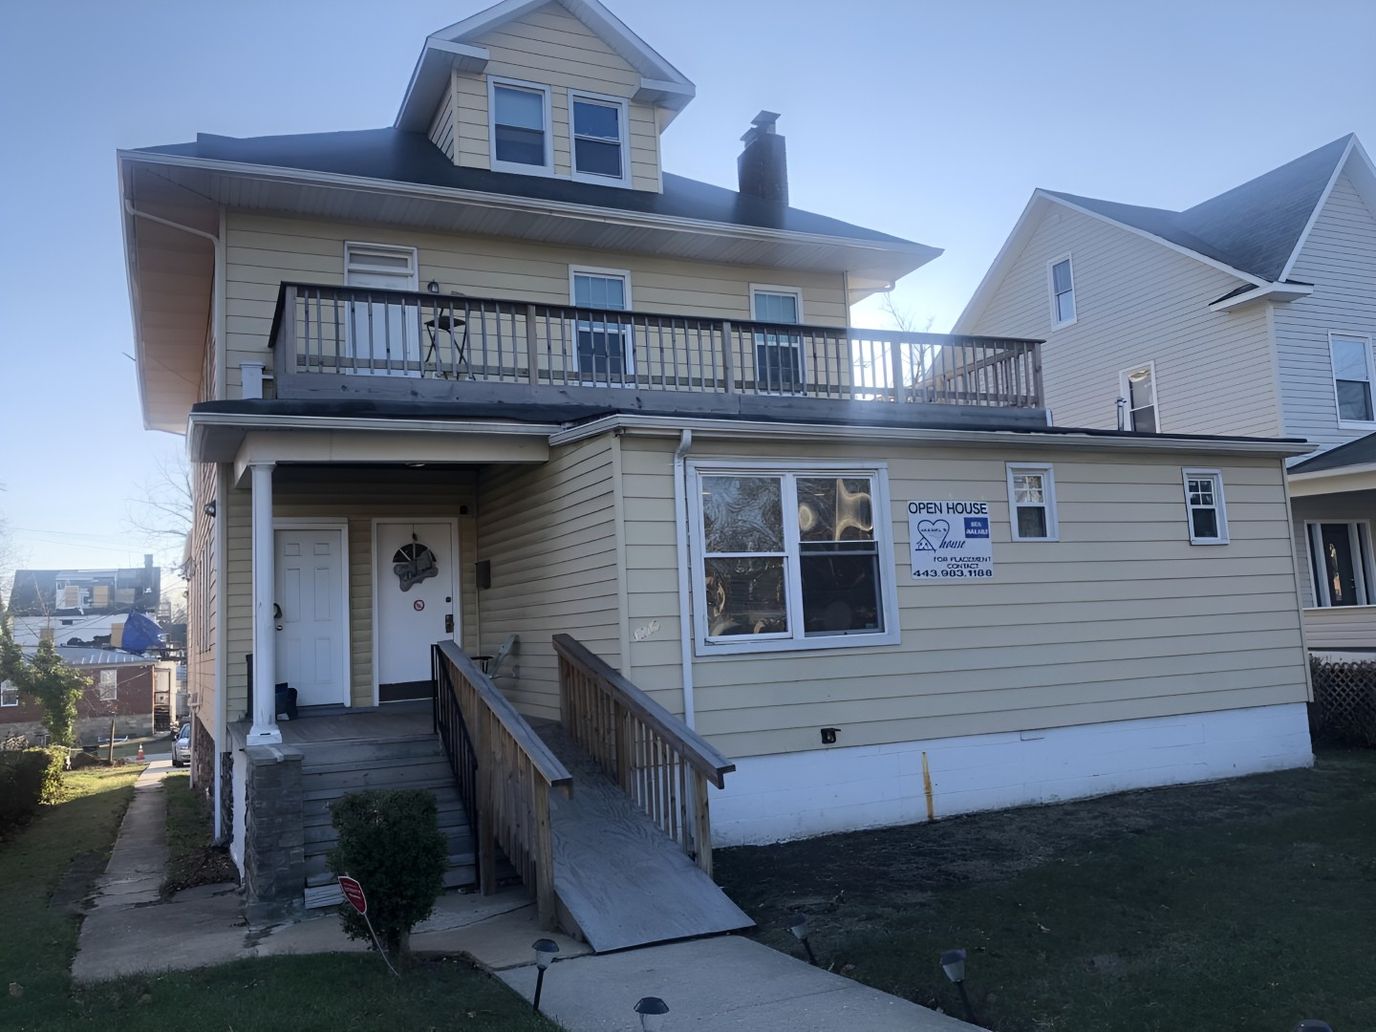
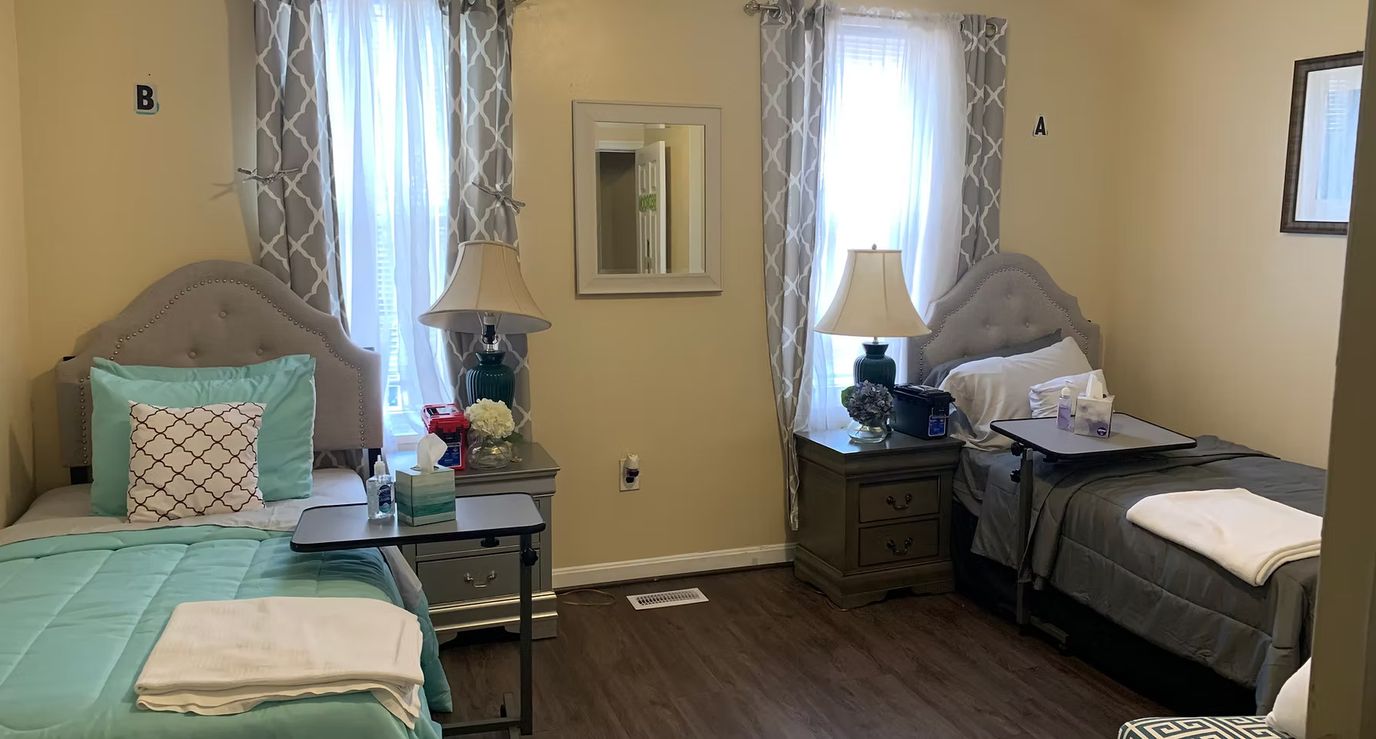
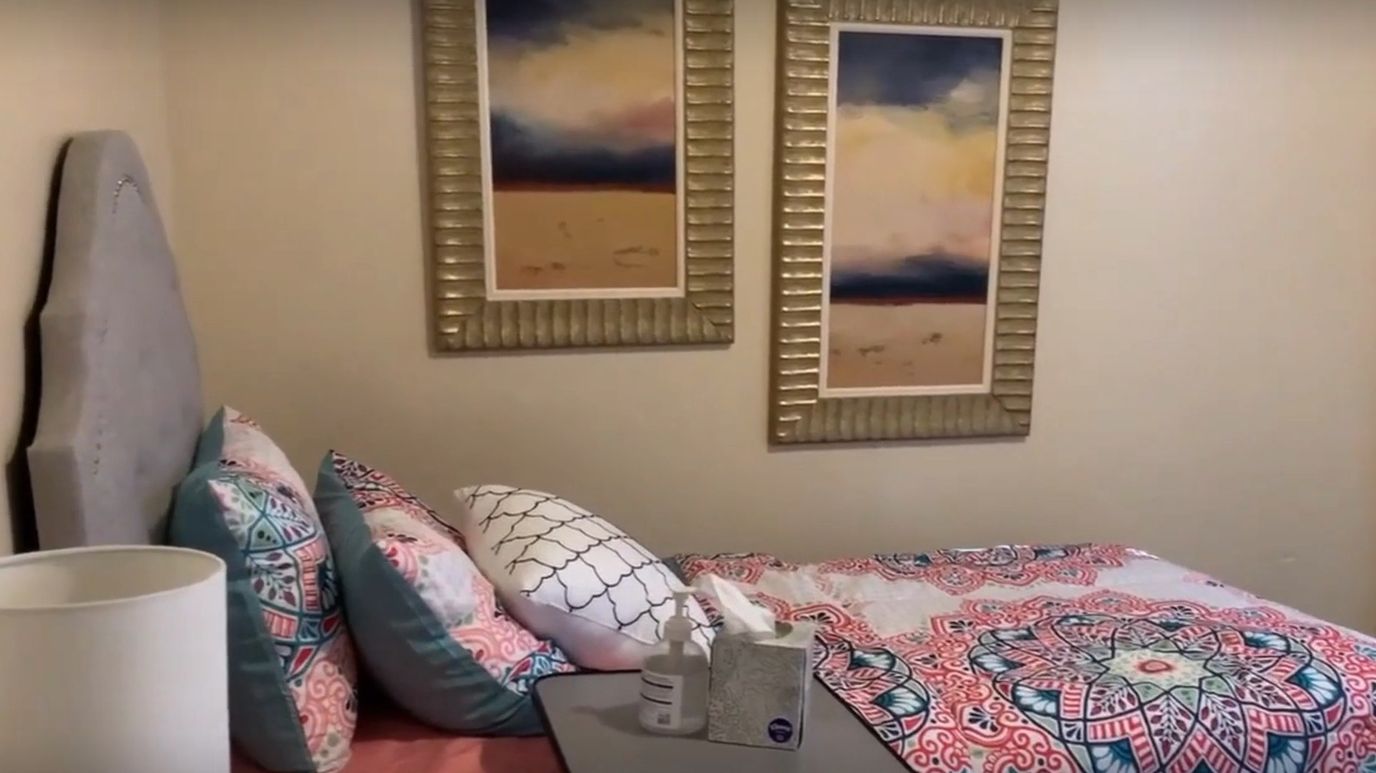
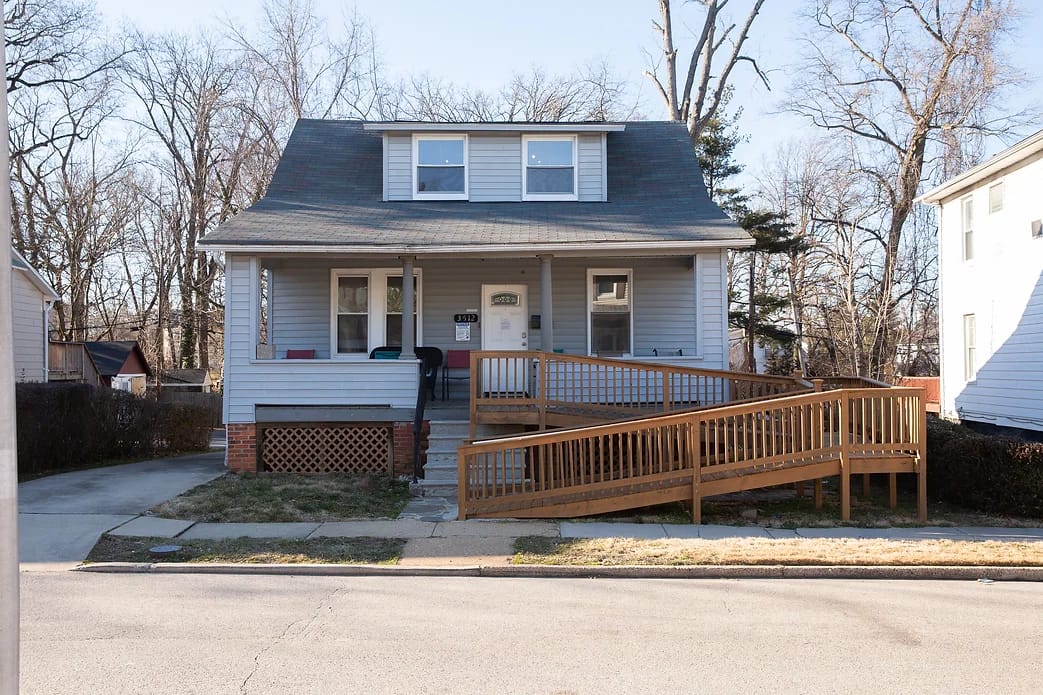
Operated by a registered nurse owner, Mabel’s House is an 8-bed assisted living and independent living community in Gwynn Oak, Maryland. The community is in a two-story residential building. It’s a small setting where personalized attention and close relationships between staff and residents are an important part of daily life. It serves older adults who need help with daily activities, those who want independent living with access to support services, residents with memory care needs, and seniors who need respite care for short-term stays.
Located on Liberty Heights Avenue, the neighborhood is very walkable. Residents have convenient access to dining, shopping, and public transportation. This location reduces isolation and makes it easier for families to visit and enjoy outings with their loved ones. The surrounding neighborhood offers the welcoming community feel that many families look for in a smaller senior living home.
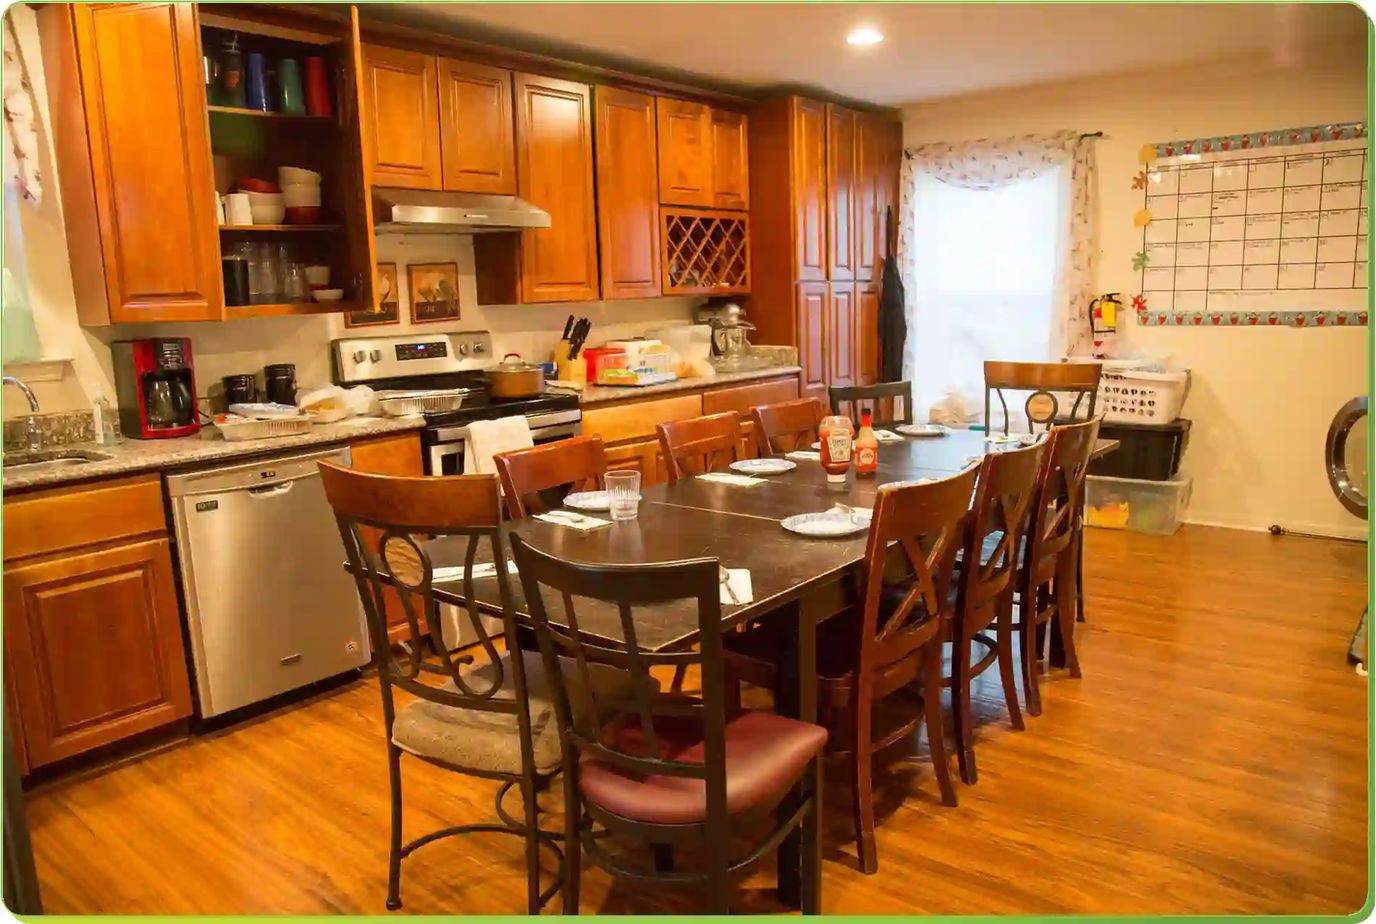
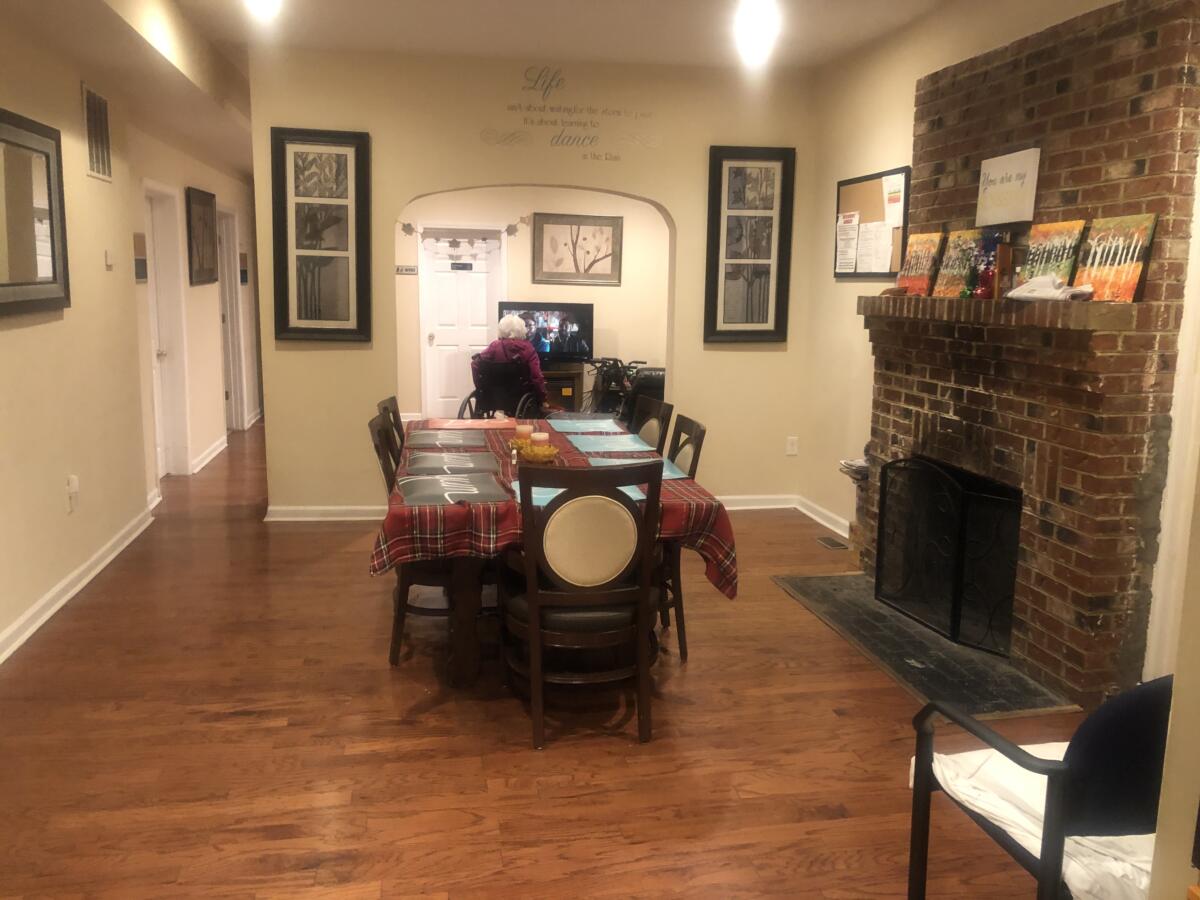
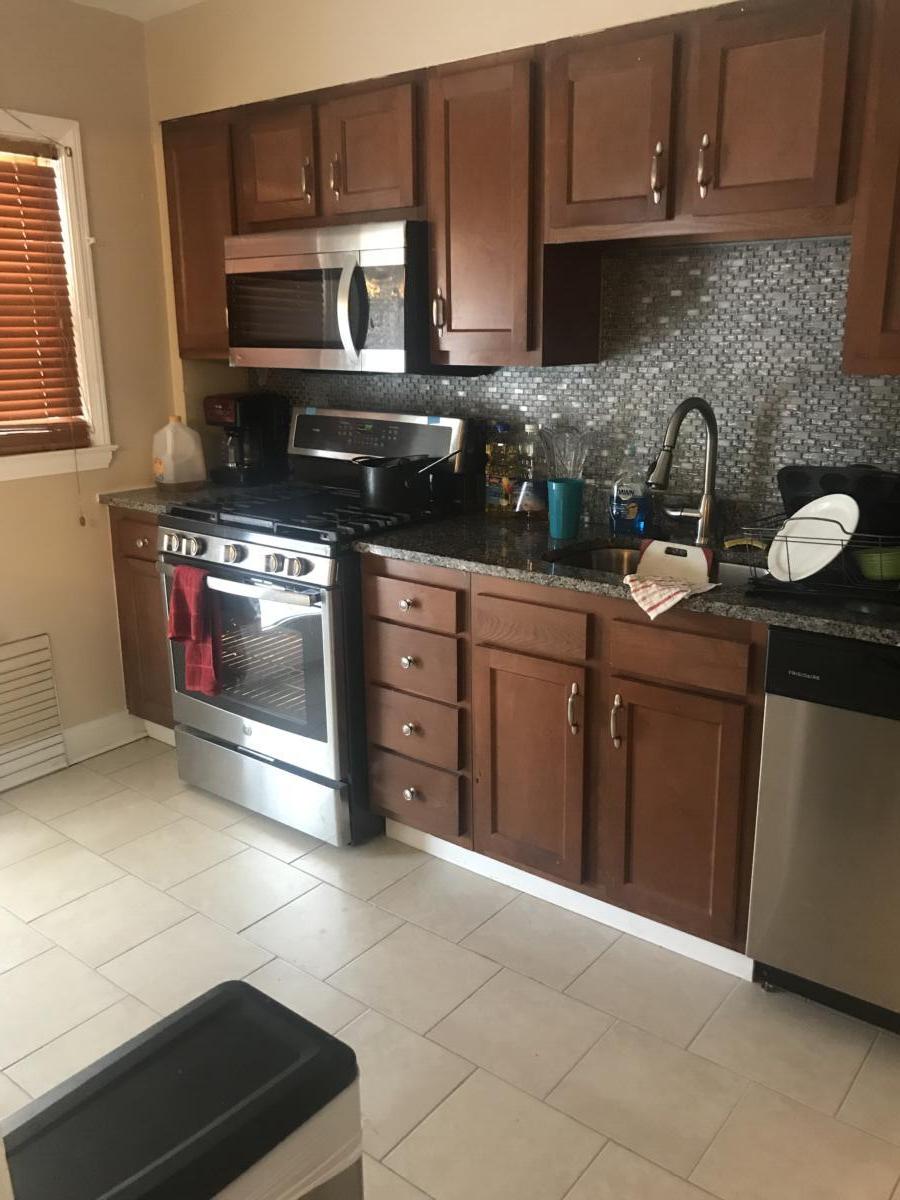
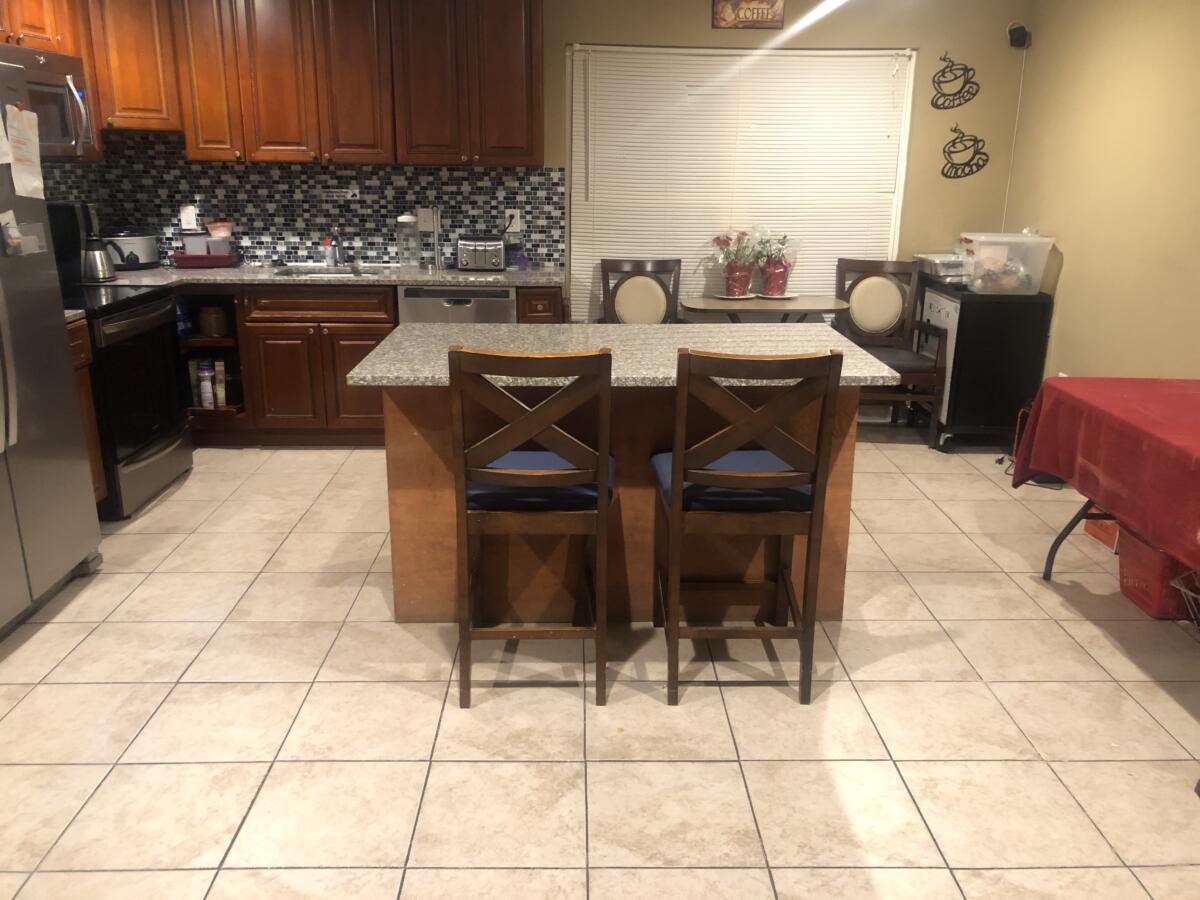
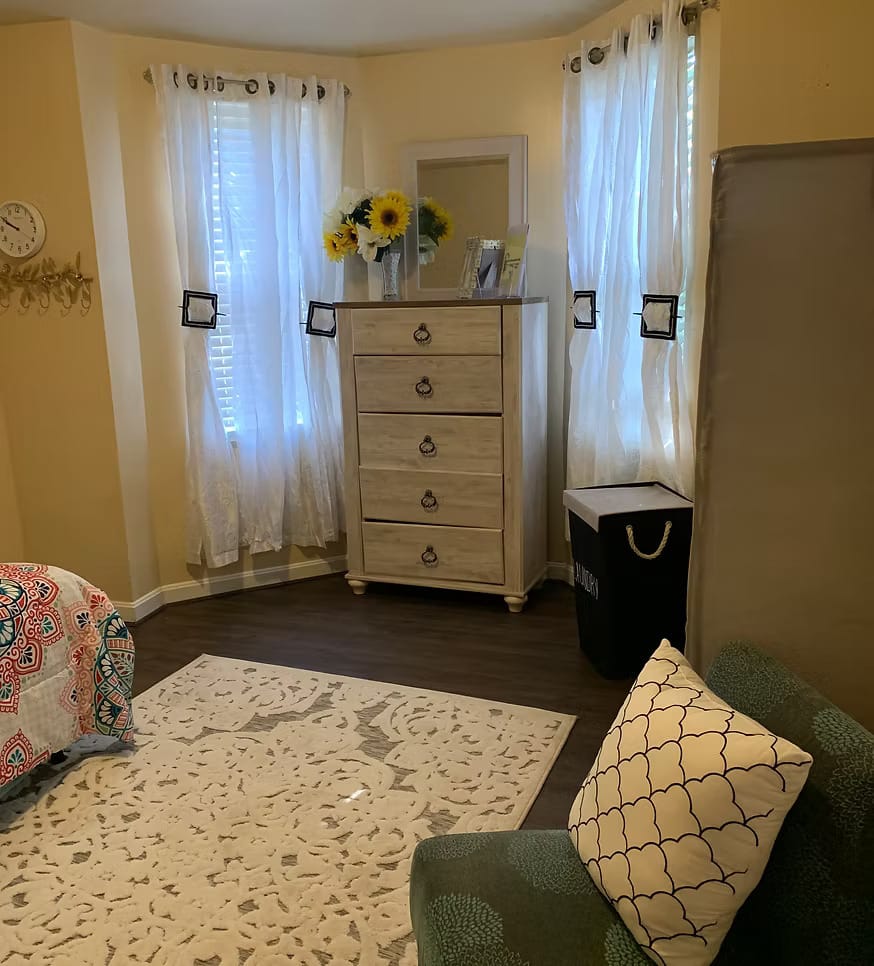
Daily life at Mabel’s House focuses on engagement and maintenance-free living. Residents can join in exercise programs and culturally enriching outings based on their interests. These help them stay active and socially connected. The community offers private and semi-private rooms, comfortable shared spaces, and household services that remove the burden of daily maintenance. Around-the-clock support is also available whenever residents need assistance.
Residents and their families value the welcoming environment and the quality of care provided. The combination of registered nurse ownership, a small community setting, and a strong focus on enrichment activities makes Mabel’s House a thoughtful choice for older adults looking for a residential assisted living community in the Baltimore area.
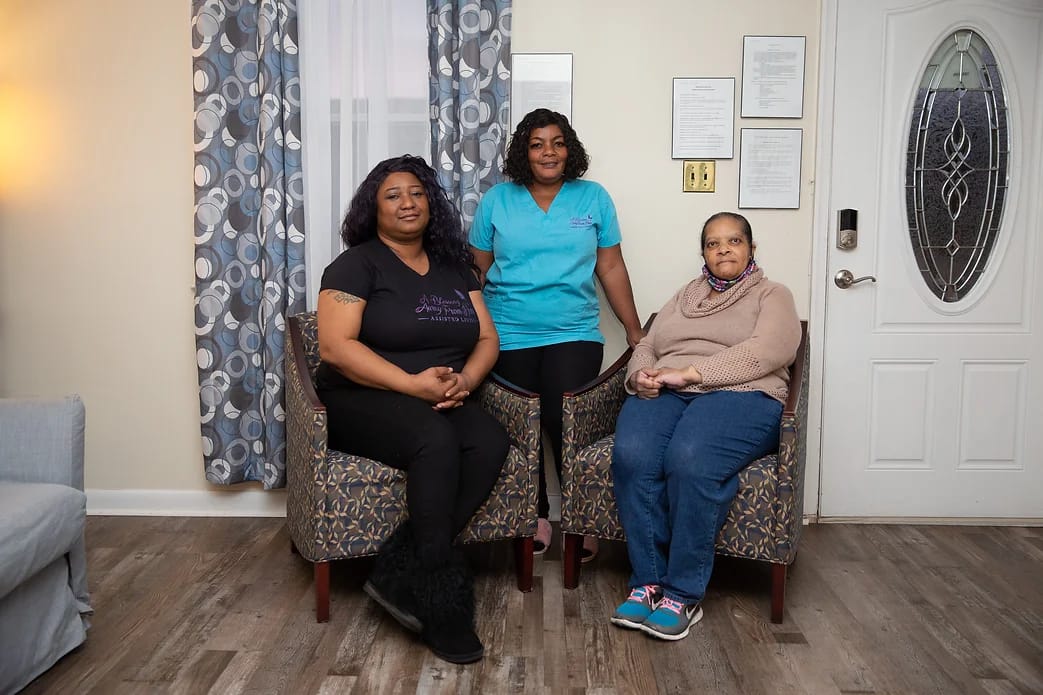
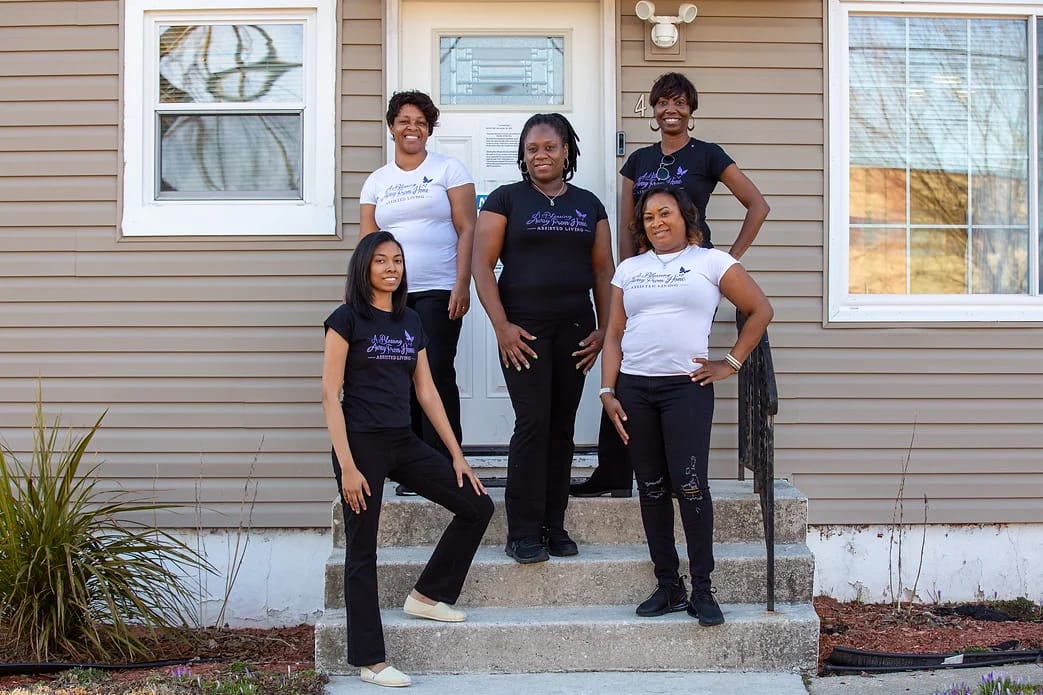
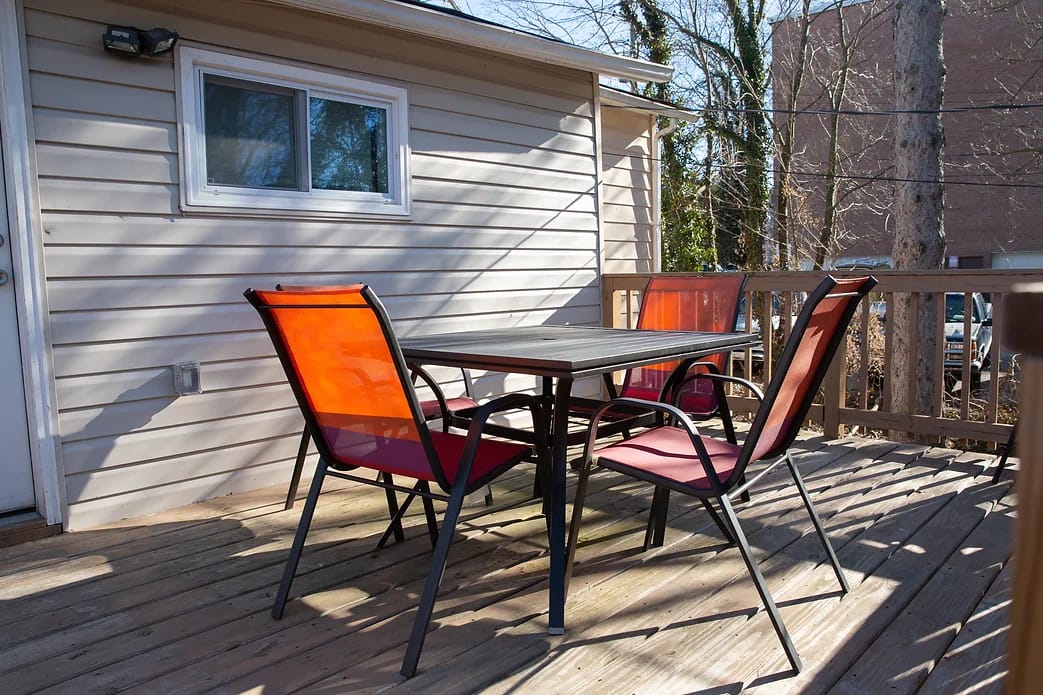
Live the lifestyle you prefer with the idyllic senior living community of A Blessing Away From Home 5 at 4114 Fordleigh Road, Baltimore, MD, which provides assisted living and memory support. Boasting a team of experienced and highly trained professionals, seniors can rest assured of receiving the highest standard of care and assistance for their every need 24/7. The community handles the housekeeping and provides safe amenities to ensure seniors enjoy a maintenance-free retirement.
Participate in exciting trips and create lasting moments with friends through a well-thought-of calendar of enjoyable activities and enriching programs. The community also ensures seniors have a satisfactory dining experience by focusing on their nutritional needs and tastes. A Blessing Away From Home 6 is a haven for seniors seeking to maximize their independence with its exceptional services.
Viva Senior Living at Cockeysville
Overview of Viva Senior Living at Cockeysville

“Ideally situated in the harmonious neighborhood of Cockeysville, MD, Viva Senior Living at Cockeysville is a blissful haven that offers assisted living, memory care, and respite care. Committed to residents’ well-being, a compassionate and highly trained team provides top-notch care tailored to their unique needs. Residents feel a sense of belonging with specially designed private and companion suites.
With a jam-packed calendar of fun recreational activities and stimulating programs, residents can live actively and maintain social connections. Delectable and healthy dining options are served to satisfy residents’ dietary needs and preferences. Medication management and transportation services are available for convenience. This pet-friendly community creates the ideal setting for residents to thrive in retirement. “
A part of A Blessing Away From Home’s communities, Blessing 3 is a charming senior living community in Baltimore, MD, offering excellent assisted living and long-term care services. Residents’ care needs are guaranteed to be met with compassionate care and support, provided by an experienced and certified team of caregivers available 24 hours a day and 7 days a week. The community offers an array of services, including support with daily living activities, medication management, monthly nurse and podiatrist visits, and medication delivery to ensure residents enjoy utmost comfort and convenience.
In addition to excellent care services, the community also provides residents with most necessities they need to thrive and maintain their overall well-being. These necessities include a full range of engaging activities, nutritionally balanced meals, and an array of convenient services to make their lives easier. With one-on-one attention and care and vibrant opportunities to stay active, residents here are guaranteed to live happy and fulfilling lives.
Experience unrivaled comfort and care with the astounding senior living community of A Blessing Away From Home 4 set in the harmonious residential area of Fordleigh Road, Baltimore, MD, that offers assisted living and memory support. A team of experienced and highly qualified professionals strives to meet seniors’ needs and preferences by providing the utmost care and assistance. The community also provides medical support to ensure seniors’ medical needs are well-cared for.
Have a fun time and keep an active lifestyle with a carefully curated calendar of activities and enriching programs. Moreover, in-home therapies are also conducted to ensure residents get better every day. A Blessing Away From Home 4 is great for seniors aiming to make the most out of their best years in its senior-friendly spaces and cozy amenities.
Overview of Roland Park Place


Roland Park Place is a 41-bed nursing home located at 830 West 40th Street in Baltimore, Maryland. Owned by Jennifer Labute, the facility has been in operation for 48 years and accepts Medicare and private pay. The surrounding metropolitan neighborhood is highly walkable, with a Walk Score of 90, so visitors can handle almost all errands on foot.
The building currently runs at 59 percent occupancy, and residents stay for an average of 100 days. This timeline shows that the staff splits their time between short-term rehab and ongoing long-term care. To manage daily medical needs, the nursing team logs 7 hours and 7 minutes of total care per resident each day, which includes 3 hours and 24 minutes of daily care specifically from registered nurses. On the operational side, past state inspections have flagged some gaps regarding reporting and notification protocols for family communication and resident protection.
The campus features multiple levels of support, including assisted living, skilled nursing, memory care, and short-term respite care. For daily routines, the property includes an indoor pool, a fitness center, art studios, a library, a coffee shop, and several dining rooms. The monthly schedule also incorporates a gardening area, a game room, and over 200 annual group trips to regional destinations.
Individuals evaluating local care options can contact the intake department to check on current bed availability or review financial coverage paths. A scheduled walkthrough offers an opportunity to ask the administration how their current staff communication protocols address historical inspection findings.
Ideal Comfort Assisted Living is a nurse-owned and operated assisted living community in Baltimore, MD, offering personal care and short-term memory care. Here, older adults can feel at home, especially with a nurturing and home-like environment. With three nutritious meals daily, housekeeping, laundry, and transportation, residents have a maintenance-free lifestyle. Personalized care plans, along with a specially trained team, are also provided to meet residents’ unique needs and preferences.
Group trips, physical fitness, and game nights foster interactions and encourage residents to live actively and have fun. Residents can also rest and move around comfortably, as spacious communal spaces and cozy rooms are available. Located in the quiet residential area of Baltimore, the community guarantees quick access to necessities and leisure. This assisted living community is a good option for senior living in Maryland, especially with its dedication to helping older adults thrive in retirement.
Blessing 2 is a tight-knit senior living community, based in Baltimore, MD, that offers personalized assisted living services and long-term care for residents needing support with their recovery or rehabilitation. The community features a team of reliable, certified caregivers available 24/7 to offer assistance with all activities of daily living, medication management, and other support services that residents may require. Catering to just a few residents, the community warrants one-on-one attention and care, complemented with individualized care plans tailored to each resident’s unique needs and preferences.
A full-time activities coordinator is always available to curate fun and fulfilling activities, recreations and outings, designed to provide residents with the opportunity to stay active, happy, and stimulated. The community keeps residents’ nutritional needs in check by providing them with carefully curated meals that are both delicious and nutritious, with accommodations for various dietary restrictions and preferences. An array of medical services such as monthly nurse and podiatrist visits and medication delivery, are offered to further improve residents’ comfort and overall wellness.
Ranking Methodology
How we rank these memory care communities
Every community above is evaluated across six weighted categories using public data including state inspection records, review platforms, BBB profiles, and operator-published materials.
Weighting overview
- 35%Resident Experience
- 25%Regulatory
- 15%Visual Media
- 10%Website
- 10%Stability
- 5%Environment
01
Resident & Family Experience 35%
The single largest share of every ranking. Aggregated review sentiment and volume from major platforms — the closest signal to real resident experience.
- Includes
- Review Sentiment
- Review Volume
02
Regulatory & Safety Record 25%
State inspection records, citations, and complaint visits. We weight per-inspection rates more heavily than raw counts.
- Includes
- State Inspections
- Citations/Inspection
- % Inspections w/ Citations
- Complaint Visits
- Accreditations
- BBB Rating
03
Visual Media & Transparency 15%
Communities that publish high-quality visuals give families a real preview. No photos or tours = a negative transparency signal.
- Includes
- Video Tours
- Virtual Walkthroughs
- Photo Quantity
- Photo Quality
04
Website & Operator Transparency 10%
Site quality and whether the operator publishes basic accountability information — staff names, contact details, ownership.
- Includes
- Website Content
- Mobile Usability
- Staff Info Available
- Owner Info Available
05
Community Stability 10%
Operational signals indicating whether a community is well-run and meeting demand.
- Includes
- Occupancy Rate
- Bed Options
06
Environment & Pricing 5%
Walkability and pricing transparency. Walk Score is weighted higher for Independent Living than for Memory Care, where most residents do not leave unaccompanied.
- Includes
- Walk Score
- Pricing Transparency
Who we are
Your Senior Care Partner, Every Step of the Way
We help families find affordable senior communities and unlock same day discounts, Medicaid, and Medicare options tailored to your needs.
Contact us Today
Frequently Asked Questions about Memory Care in Baltimore, MD
What is the average cost of memory care in Baltimore, MD?
The average monthly cost of memory care in Baltimore, MD is approximately $5,000. Actual rates vary by community, level of care, and floorplan.
What is the price range for memory care in Baltimore, MD?
Memory care in Baltimore, MD typically ranges from $4,000–$6,500 per month, depending on the community, room type, and care needs.
What is the typical staff-to-resident ratio at memory care communities in Baltimore, MD?
Memory care communities in Baltimore, MD typically operate with a staff-to-resident ratio in the range of 1:5–1:8.
What's the difference between assisted living and memory care in Maryland?
Assisted living in Maryland supports residents with daily activities (bathing, dressing, medication management) while preserving independence. Memory care is a specialized form of assisted living for residents living with Alzheimer's or dementia, and adds 24/7 secured environments, dementia-trained staff, and structured routines designed to reduce confusion and wandering.
Does Maryland Medicaid cover memory care?
Maryland Medicaid does not directly pay room-and-board for memory care, but most states (including Maryland) offer Home and Community-Based Services (HCBS) waivers that can offset the cost of care services delivered inside a licensed community. Eligibility, waitlists, and covered services vary — check directly with the state Medicaid agency.
What is memory care?
Memory care is a specialized form of assisted living for residents living with Alzheimer's disease or other forms of dementia, with secured environments, dementia-trained staff, and routines built to reduce confusion and wandering.
How many memory care communities are listed on this page?
This page features 43 memory care communities in Baltimore, MD. Use the filters and comparison tools above to compare ratings, amenities, and pricing.
Updated on
