


Compare Memory Care around Hyattsville
The information below is reported by the Maryland Department of Health, Office of Health Care Quality.
| Independence Court of Hyattsville | MC AL RC | Hyattsville (Queens Chapel Manor) | 130
Facility
130
MD AVG
42
Rank
#61 / 685 | Yes |
64
Facility
64
MD AVG
43
Rank
#261 / 985 | Suite / 1 Bed | 35
Facility
35
MD AVG
20
Rank
#16 / 210 |
44% Male Residents — State Benchmarked 44% of residents are male, compared to the Maryland average of 31%. A relatively balanced gender mix for assisted living, where facilities typically skew heavily female. |
56% Female Residents — State Benchmarked 56% of residents are female, compared to the Maryland average of 69%. Closer to an even gender split than most assisted living facilities, which typically have 65–75% female residents. |
24% White Residents — State Benchmarked 24% of residents are reported as White, compared to the Maryland average of 81%. A lower White share than the Maryland average — the community may draw a more diverse resident mix relative to other facilities in Maryland. |
68% African American Residents — State Benchmarked 68% of residents are reported as African American or Black, compared to the Maryland average of 13%. A higher African American share than the typical Maryland average — useful context when comparing cultural fit and community composition. |
8% Other Ethnicity Residents — State Benchmarked 8% of residents fall into categories other than White or African American (combined), compared to the Maryland average of 6%. This column aggregates Hispanic, Asian, multiracial, and any other labeled groups that are not classified as White or African American. Reported subgroups in this total: Other (6%), Asian (2%). |
18% Residents Age 65–74 — State Benchmarked 18% of residents are 65–74, compared to the Maryland average of 13%. A higher share of younger seniors often signals a more independent, active resident community with lower acuity care needs. |
42% Residents Age 75–84 — State Benchmarked 42% of residents are 75–84, compared to the Maryland average of 31%. A high concentration in this mid-range bracket, where residents typically need moderate support with daily activities. |
22% Residents Age 85–94 — State Benchmarked 22% of residents are 85–94, compared to the Maryland average of 44%. The population here skews younger than the statewide norm, which may indicate a more active, lower-acuity community. |
14% Residents Age 95+ — State Benchmarked 14% of residents are 95 or older, compared to the Maryland average of 16%. In line with the statewide profile for the oldest resident bracket. |
| The Terraces at Tuckerman Lane | MC AL NH RC SNF | North Bethesda | 101
Facility
101
MD AVG
42
Rank
#108 / 685 | Yes |
39
Facility
39
MD AVG
43
Rank
#534 / 985 | studio / suite / 1 bed | 28
Facility
28
MD AVG
20
Rank
#51 / 210 |
45% Male Residents — State Benchmarked 45% of residents are male, compared to the Maryland average of 31%. A relatively balanced gender mix for assisted living, where facilities typically skew heavily female. |
55% Female Residents — State Benchmarked 55% of residents are female, compared to the Maryland average of 69%. Closer to an even gender split than most assisted living facilities, which typically have 65–75% female residents. |
75% White Residents — State Benchmarked 75% of residents are reported as White, compared to the Maryland average of 81%. Close to the average for this category among assisted living facilities in Maryland with reported race/ethnicity data. |
15% African American Residents — State Benchmarked 15% of residents are reported as African American or Black, compared to the Maryland average of 13%. In line with the Maryland average for African American residents among facilities reporting this breakdown. |
9% Other Ethnicity Residents — State Benchmarked 9% of residents fall into categories other than White or African American (combined), compared to the Maryland average of 6%. This column aggregates Hispanic, Asian, multiracial, and any other labeled groups that are not classified as White or African American. Reported subgroups in this total: Asian (5%), Hispanic (3%), American Indian (2%). |
11% Residents Age 65–74 — State Benchmarked 11% of residents are 65–74, compared to the Maryland average of 13%. In line with the statewide profile for this youngest senior bracket in assisted living. |
26% Residents Age 75–84 — State Benchmarked 26% of residents are 75–84, compared to the Maryland average of 31%. Below the state norm — the resident mix may skew either younger or older than this typical middle bracket. |
48% Residents Age 85–94 — State Benchmarked 48% of residents are 85–94, compared to the Maryland average of 44%. This is typically the most common age bracket in assisted living — this facility is in line with the statewide norm. |
14% Residents Age 95+ — State Benchmarked 14% of residents are 95 or older, compared to the Maryland average of 16%. In line with the statewide profile for the oldest resident bracket. |
| Arbor Terrace Senior Living | MC AL | Lanham | 125
Facility
125
MD AVG
42
Rank
#68 / 685 | Yes |
52
Facility
52
MD AVG
43
Rank
#402 / 985 | - | 27
Facility
27
MD AVG
20
Rank
#60 / 210 |
29% Male Residents — State Benchmarked 29% of residents are male, compared to the Maryland average of 31%. This facility caters to a majority female resident pool (71% female), consistent with the broader assisted living trend where women significantly outnumber men. |
71% Female Residents — State Benchmarked 71% of residents are female, compared to the Maryland average of 69%. Women comprise the large majority, consistent with national assisted living demographics where women live longer and enter care facilities at higher rates. |
4% White Residents — State Benchmarked 4% of residents are reported as White, compared to the Maryland average of 81%. A lower White share than the Maryland average — the community may draw a more diverse resident mix relative to other facilities in Maryland. |
96% African American Residents — State Benchmarked 96% of residents are reported as African American or Black, compared to the Maryland average of 13%. A higher African American share than the typical Maryland average — useful context when comparing cultural fit and community composition. |
0% Other Ethnicity Residents — State Benchmarked 0% of residents fall into categories other than White or African American (combined), compared to the Maryland average of 6%. This column aggregates Hispanic, Asian, multiracial, and any other labeled groups that are not classified as White or African American. |
15% Residents Age 65–74 — State Benchmarked 15% of residents are 65–74, compared to the Maryland average of 13%. In line with the statewide profile for this youngest senior bracket in assisted living. |
29% Residents Age 75–84 — State Benchmarked 29% of residents are 75–84, compared to the Maryland average of 31%. This is the second most common age bracket in assisted living, representing residents with moderate care needs. |
37% Residents Age 85–94 — State Benchmarked 37% of residents are 85–94, compared to the Maryland average of 44%. The population here skews younger than the statewide norm, which may indicate a more active, lower-acuity community. |
15% Residents Age 95+ — State Benchmarked 15% of residents are 95 or older, compared to the Maryland average of 16%. In line with the statewide profile for the oldest resident bracket. |
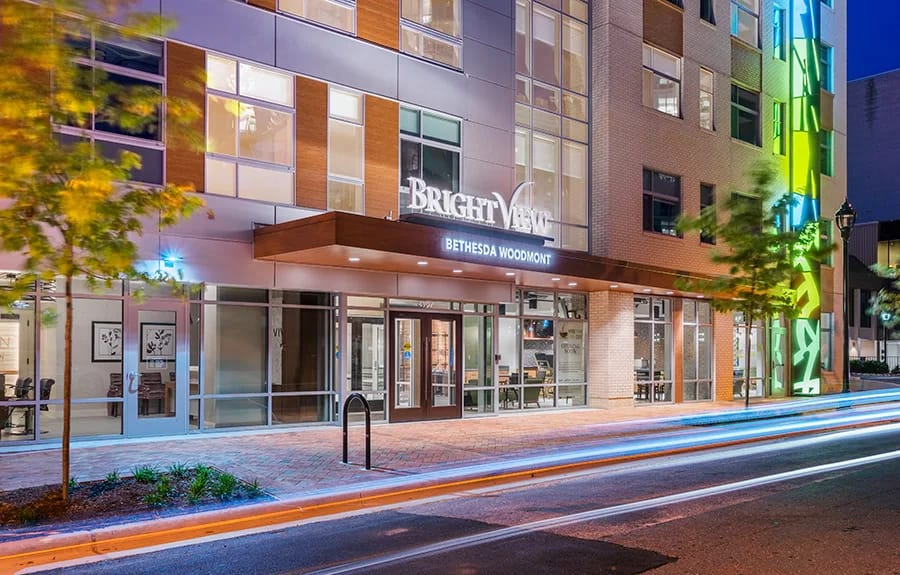
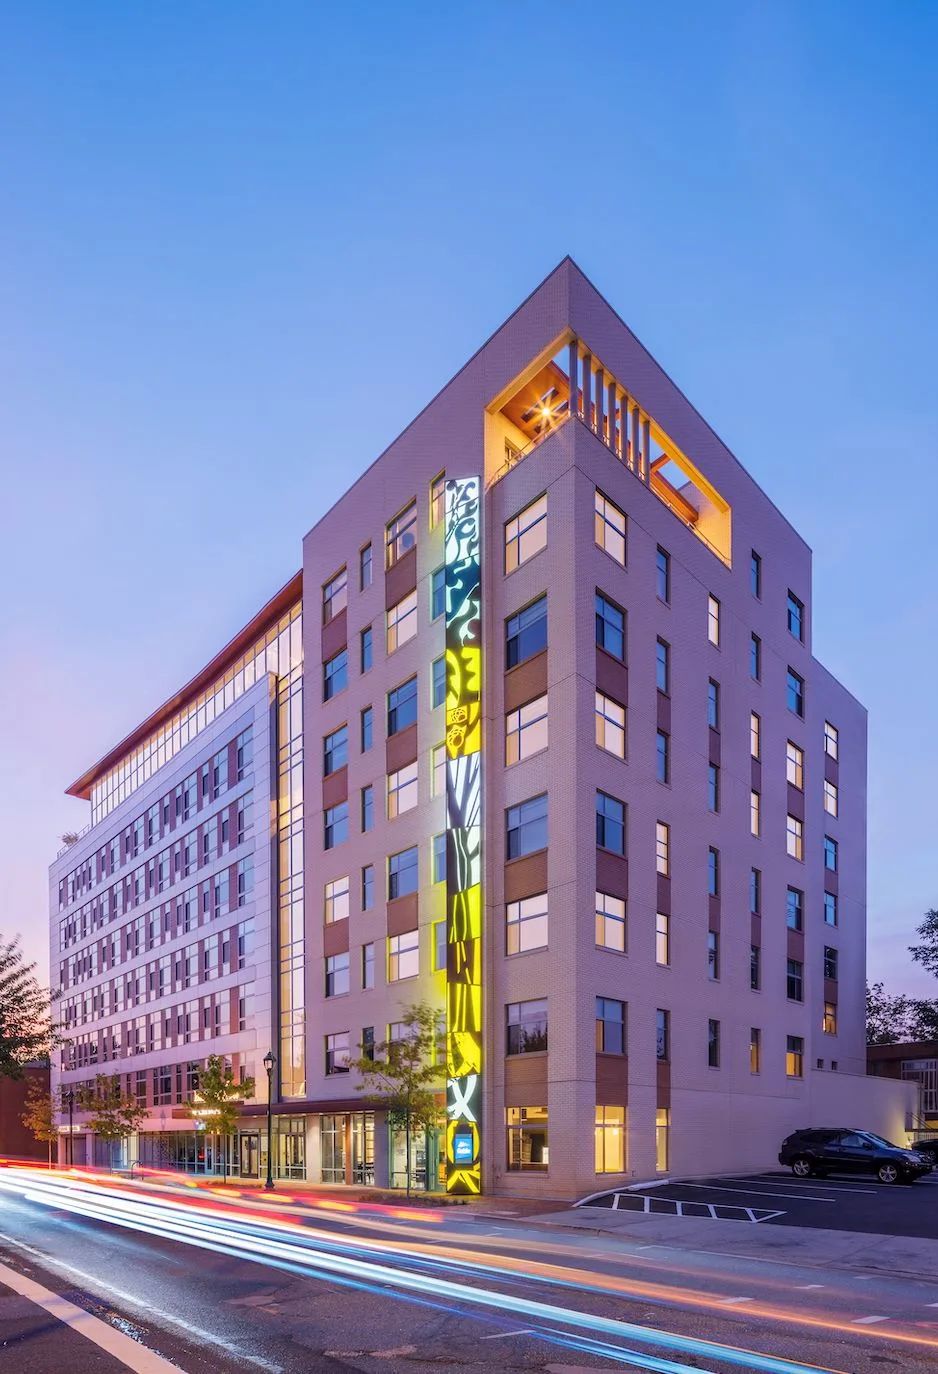
| Brightview Bethesda Woodmont | MC AL IL | Bethesda (Rugby Avenue) | - | Yes |
93
Facility
93
MD AVG
43
Rank
#13 / 985 | Deluxe Rooms | - | - | - | - | - | - | - | - | - | - |
| Kensington Park Senior Living | MC AL IL | Kensington (Littledale Road) | - | Yes |
49
Facility
49
MD AVG
43
Rank
#431 / 985 | Private Rooms / Semi-Private Rooms | - | - | - | - | - | - | - | - | - | - |
| Inspirations Assisted Living & Memory Care of Linthicum | MC AL | Linthicum Heights (Bwi Business District) | - | No |
59
Facility
59
MD AVG
43
Rank
#327 / 985 | - | 11
Facility
11
MD AVG
20
Rank
#153 / 210 | - | - | - | - | - | - | - | - | - |
| Complete Care in Hyattsville | MC HOS NH PC RC SNF | Hyattsville (Queens Chapel) | 270
Facility
270
MD AVG
42
Rank
#4 / 685 | No |
42
Facility
42
MD AVG
43
Rank
#504 / 985 | - | - | - | - | - | - | - | - | - | - | - |
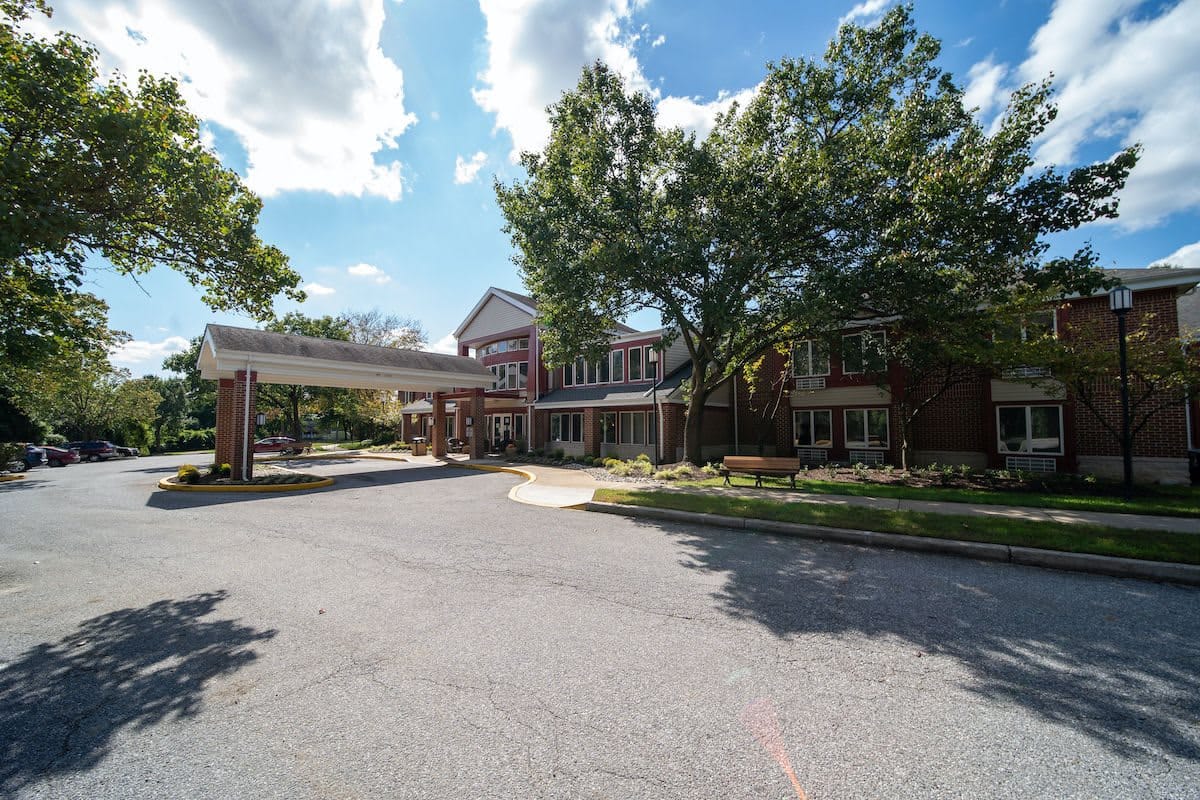
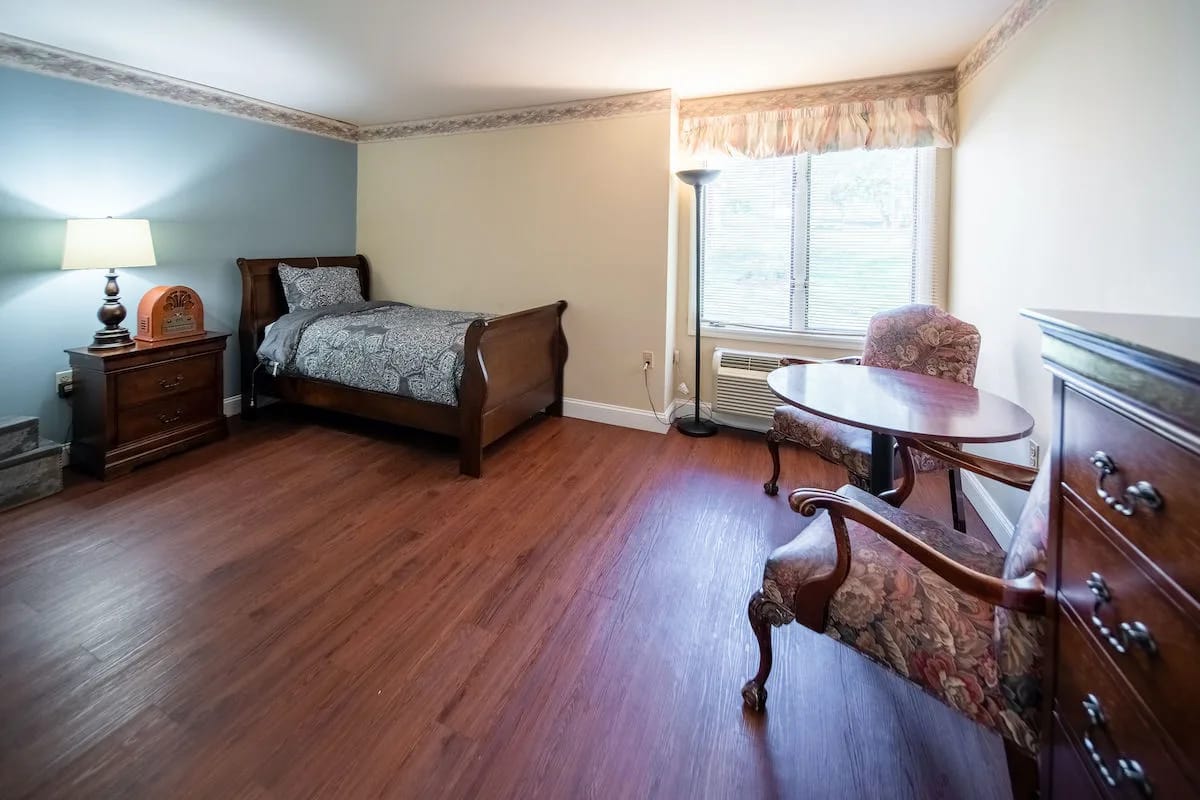
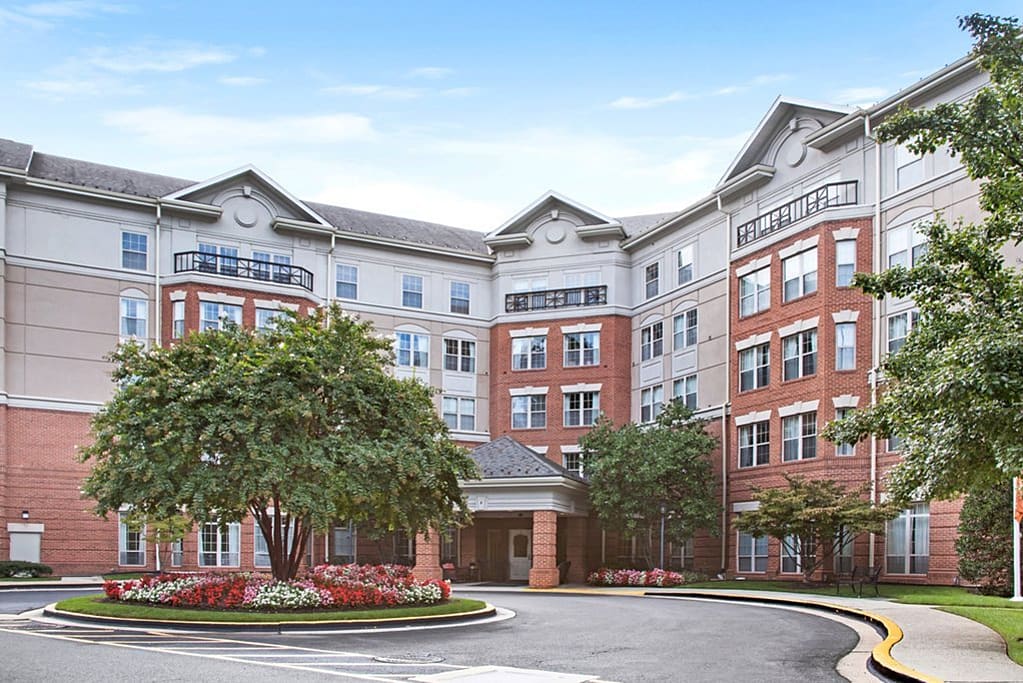
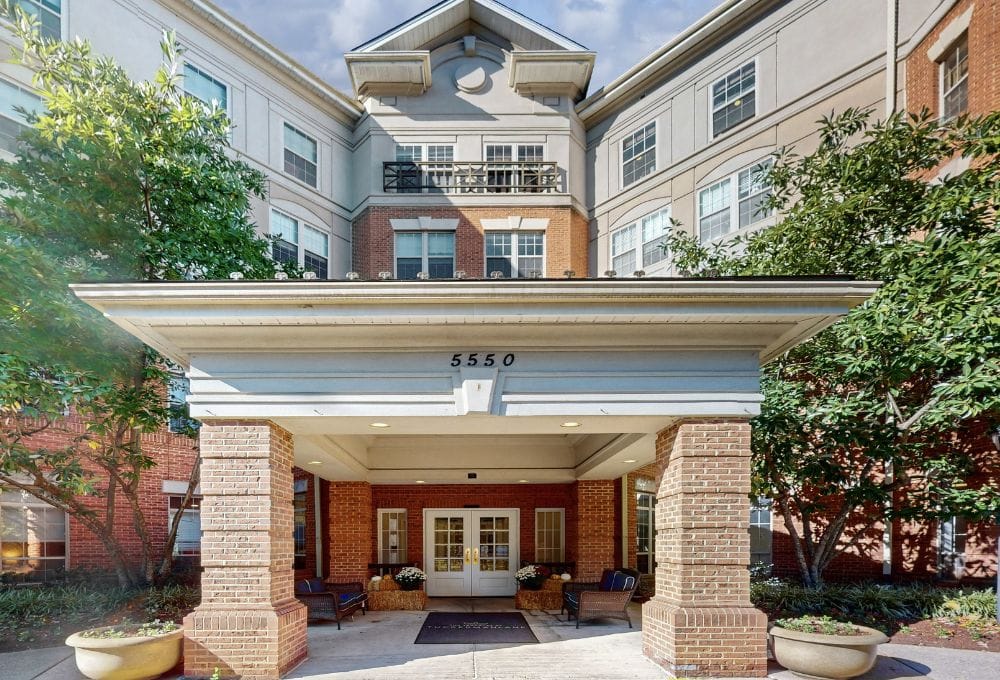
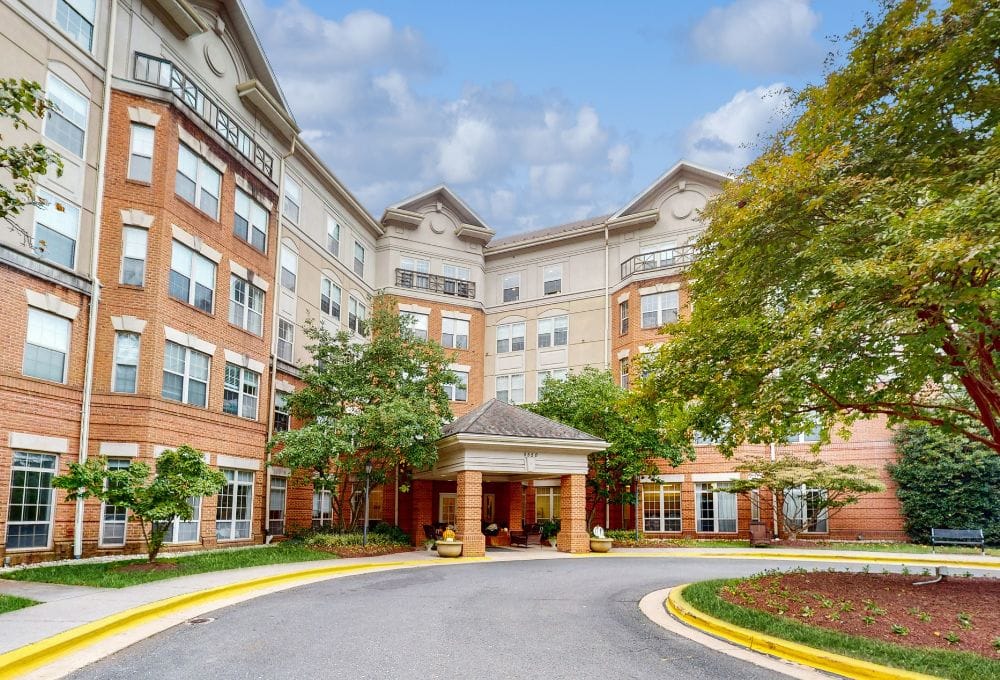
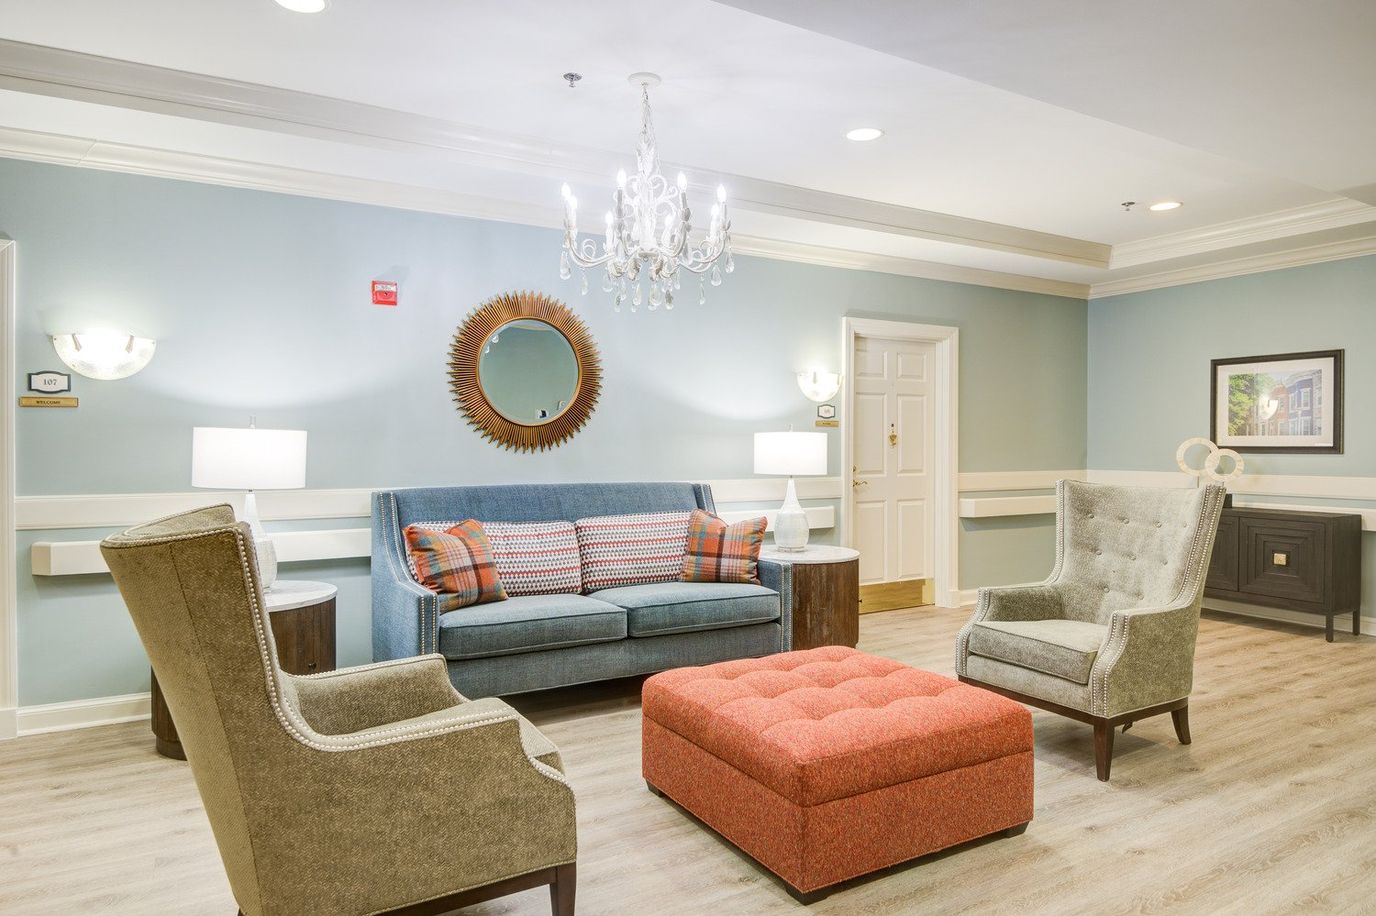
Overview of Independence Court of Hyattsville

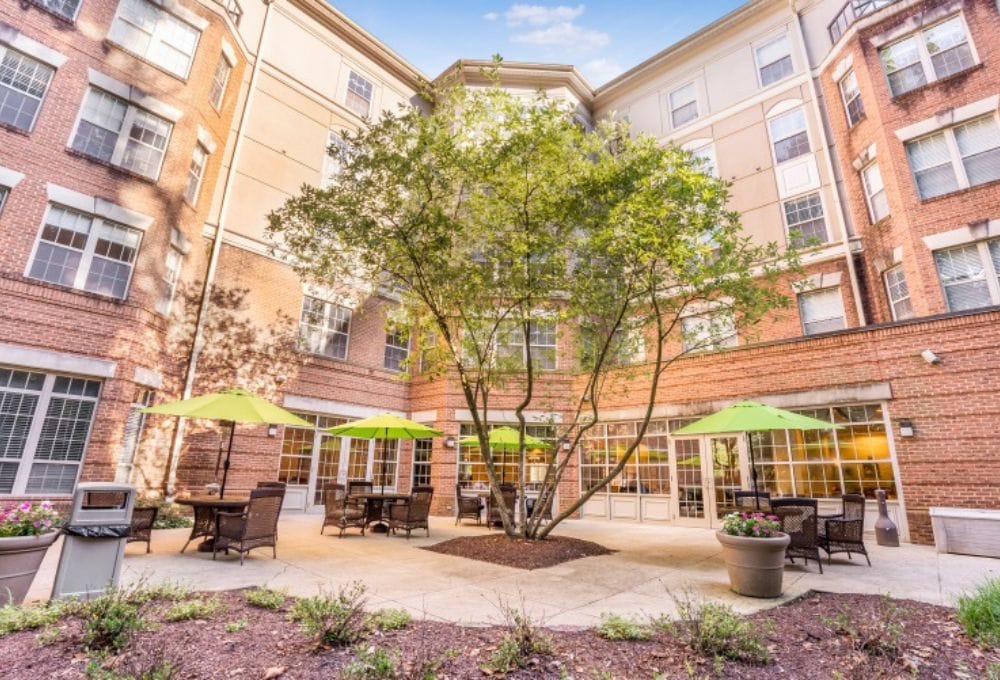
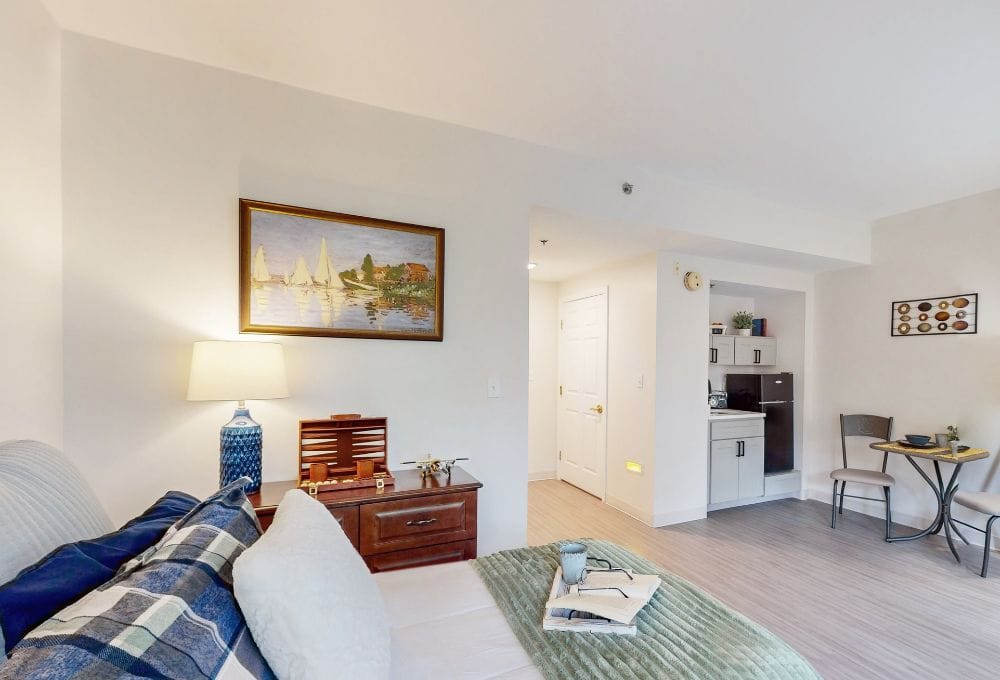
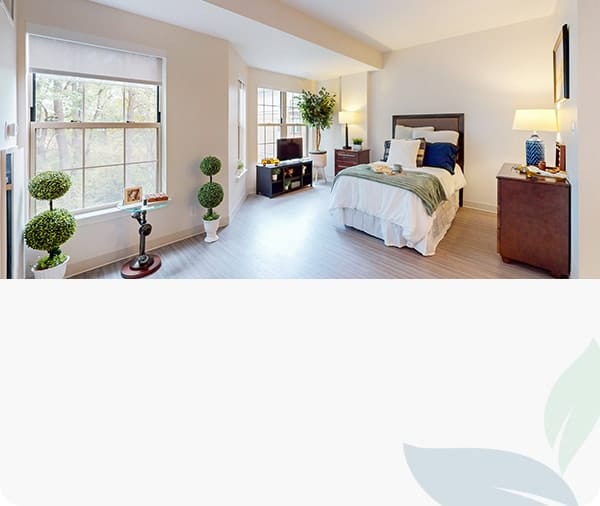
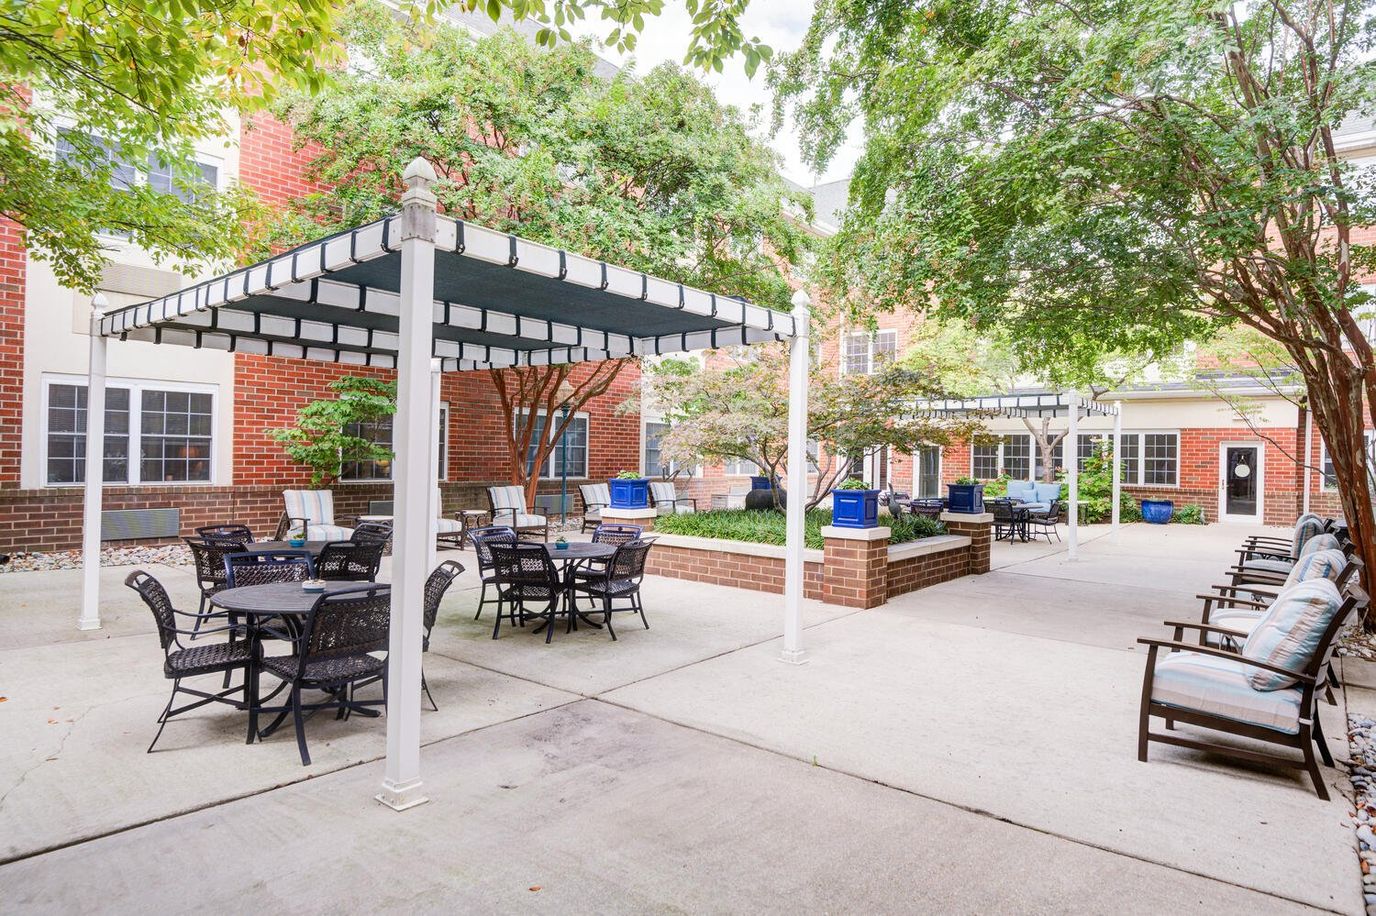
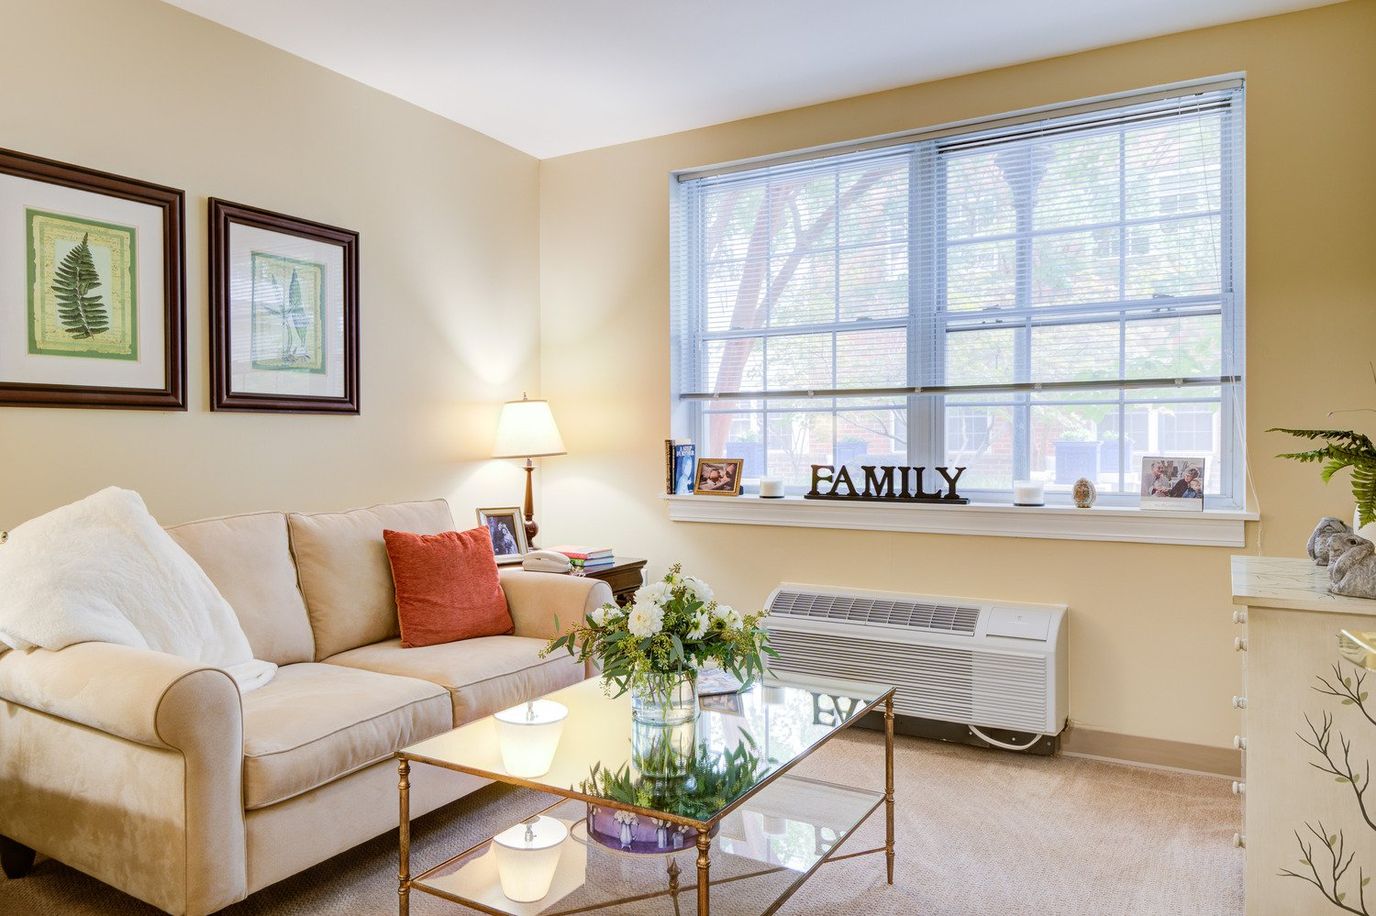
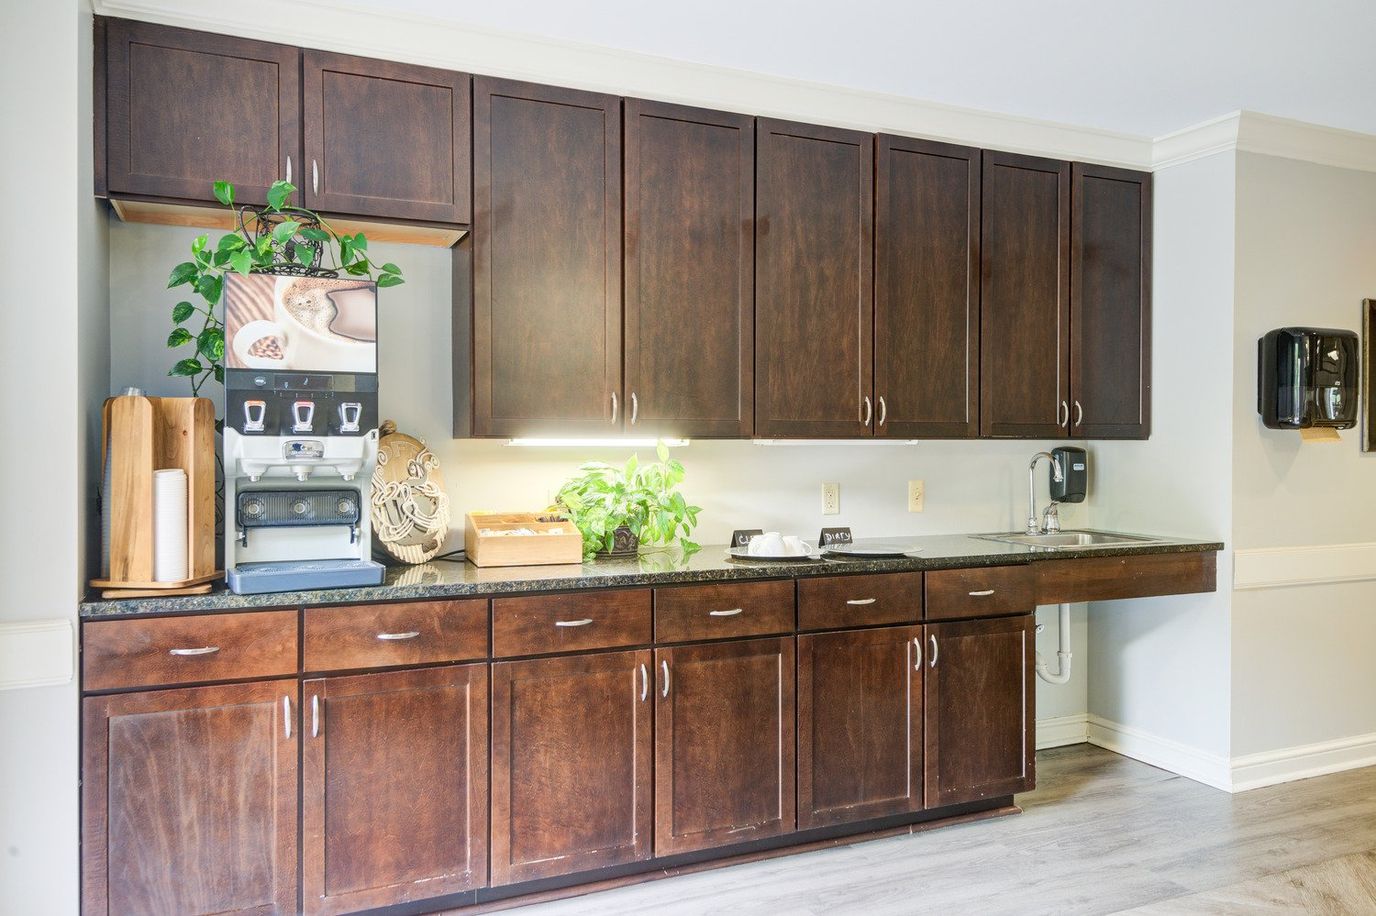
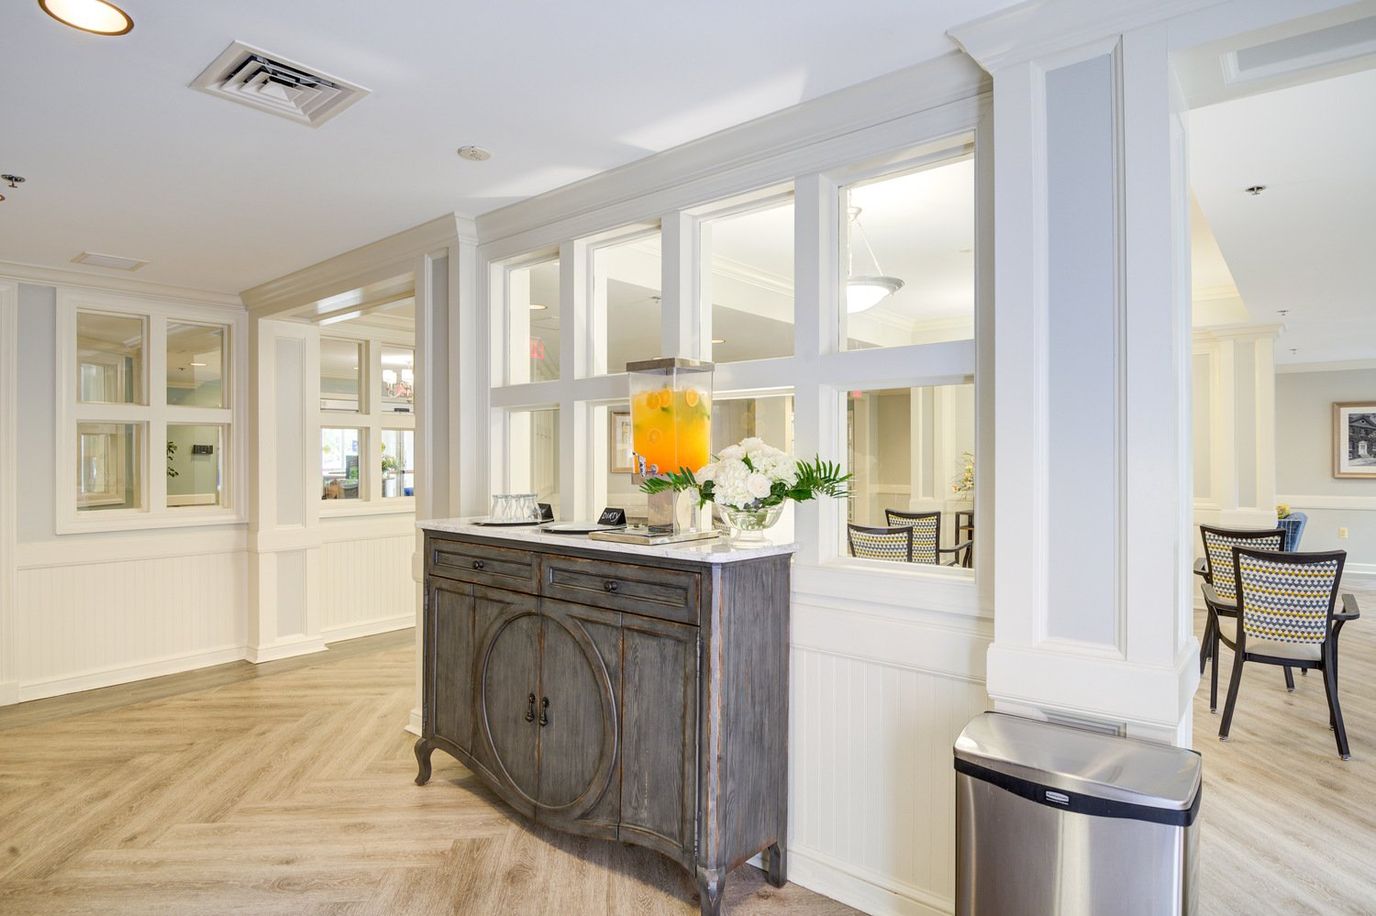
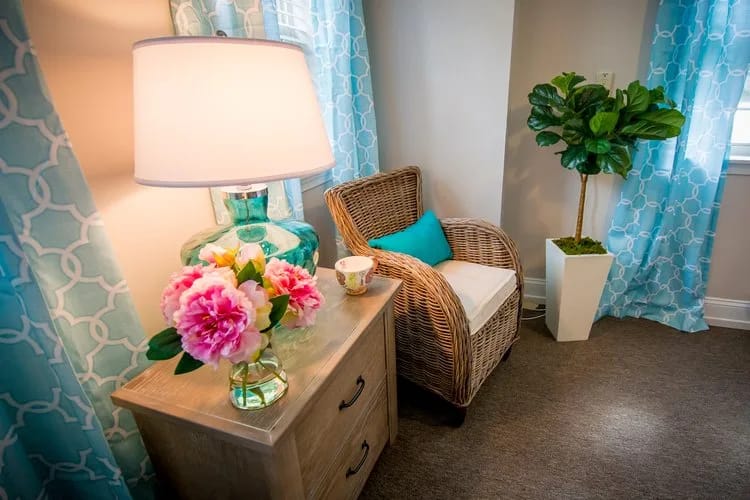
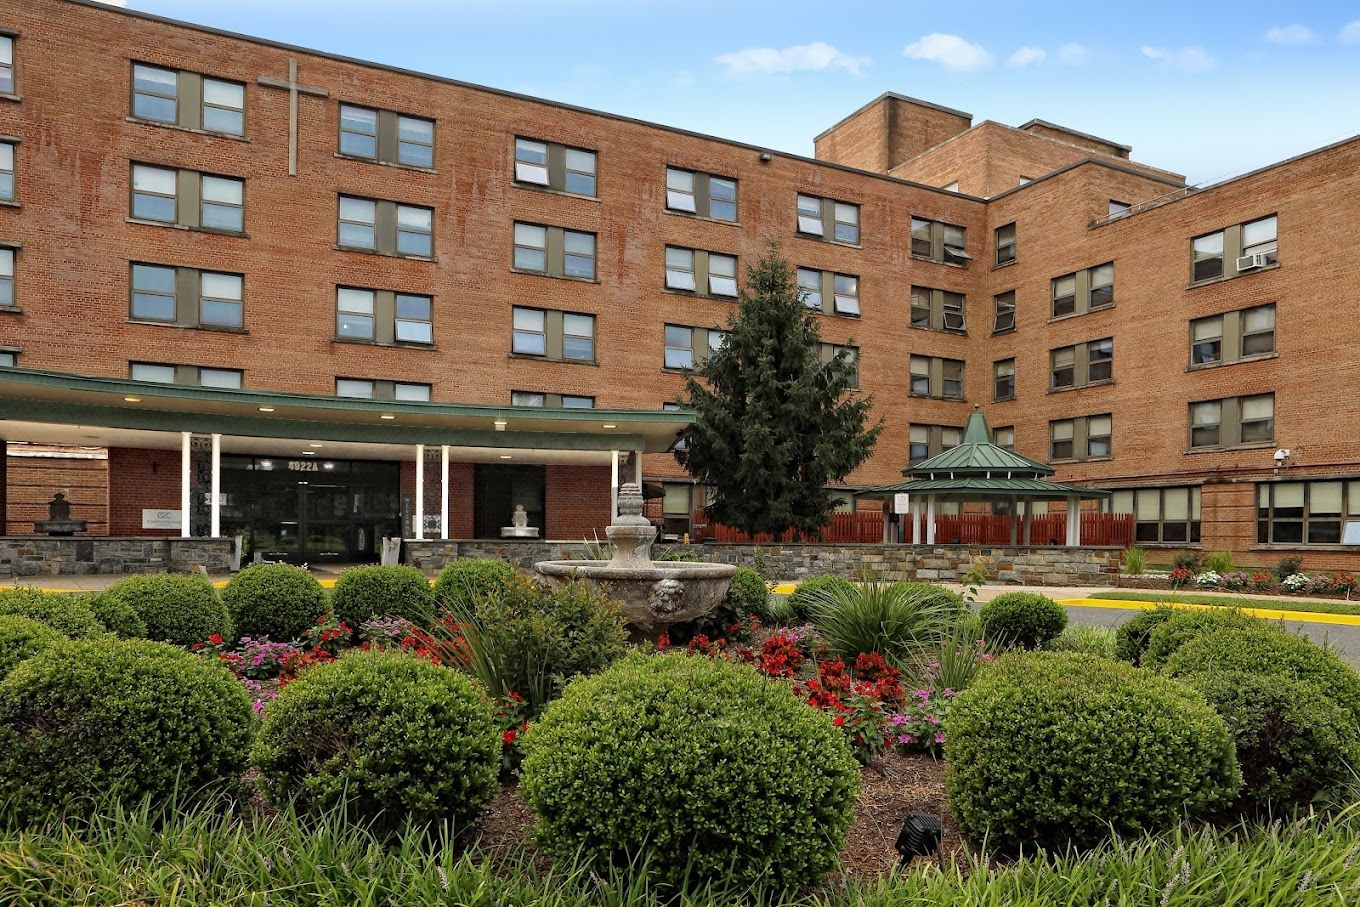
Independence Court of Hyattsville is a remarkable assisted living and memory care community, offering short-term respite care as well. Conveniently located near several healthcare facilities, hospitals, and professional services, it is easily accessible from East Highway and Route One in Hyattsville, Maryland. Being situated close to the District of Columbia, residents have easy access to all the city has to offer. This affordable community offers a range of private and semi-private packages, accepting Medicaid and Veterans Aid and Attendance, as well as long-term care insurance and private pay.
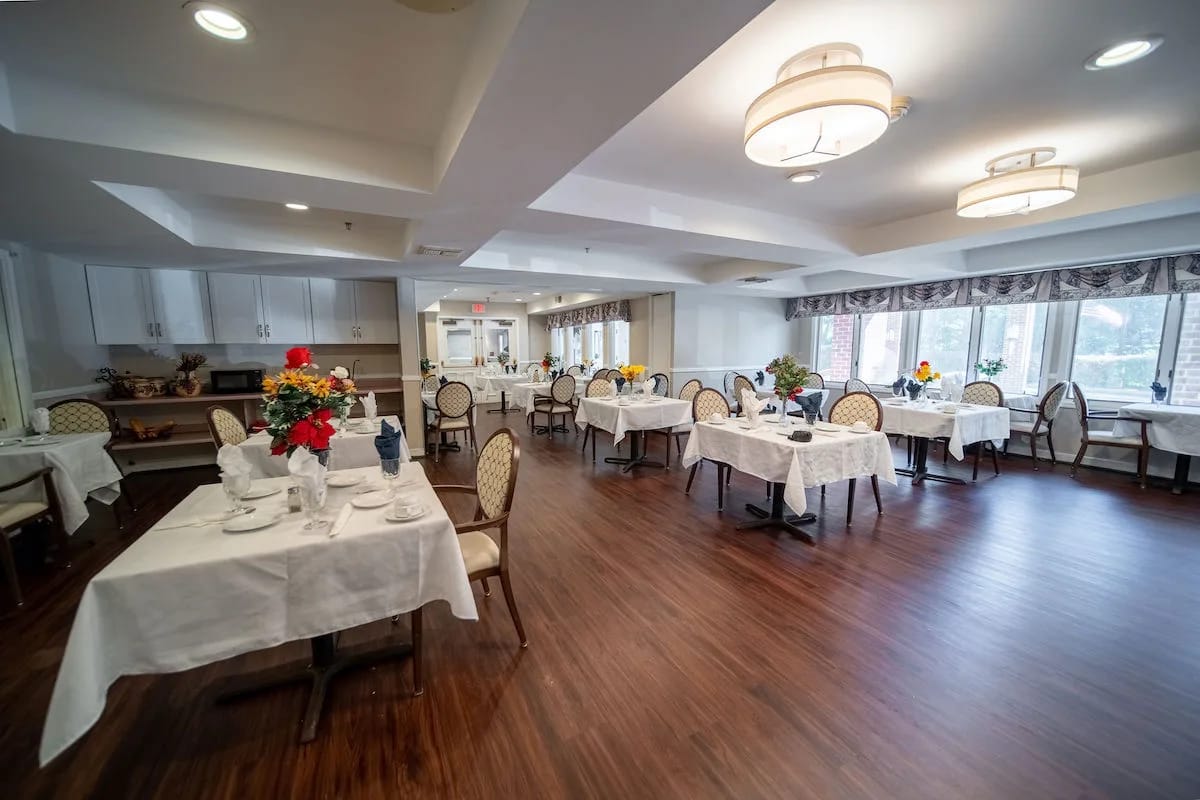
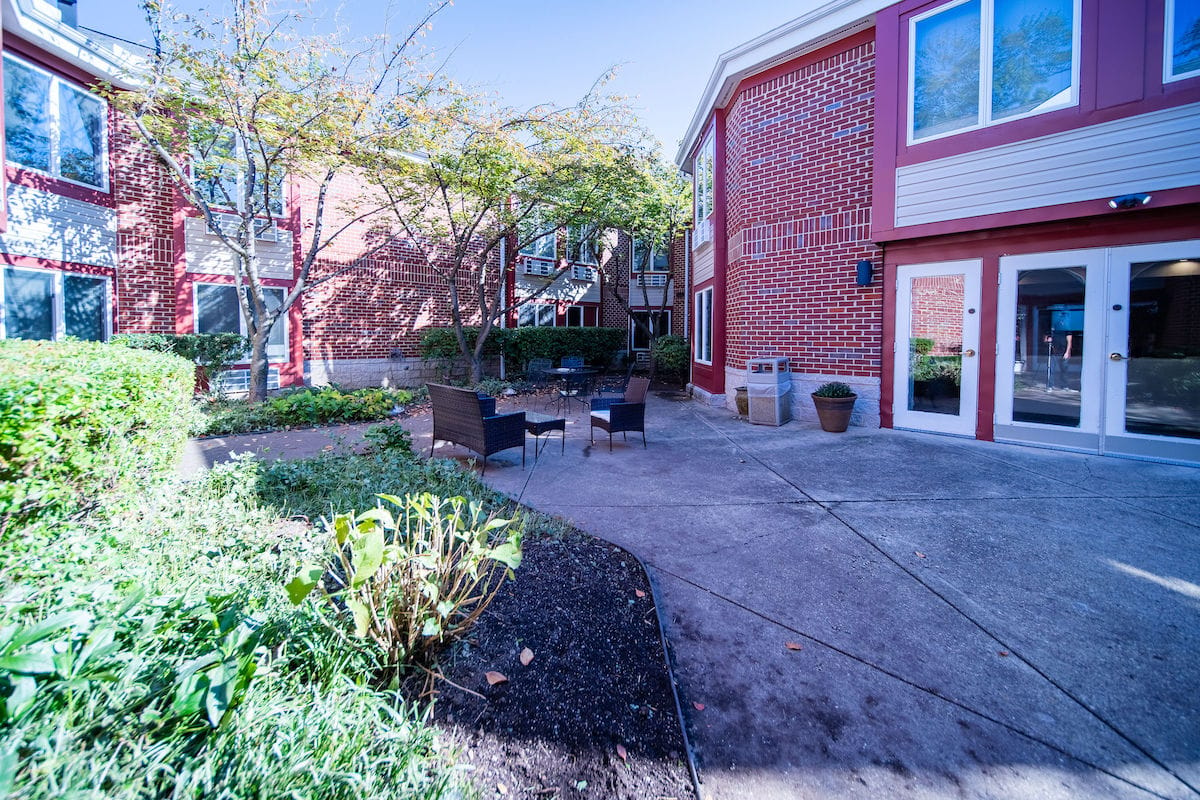
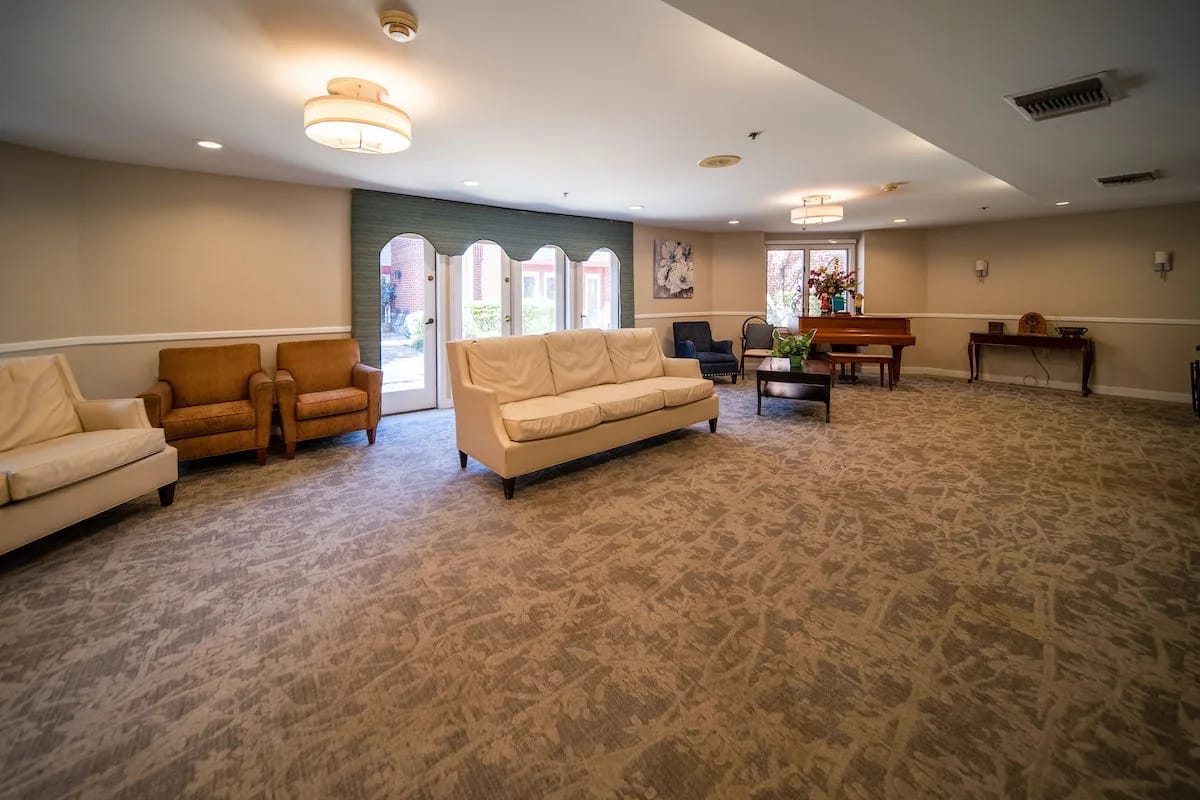
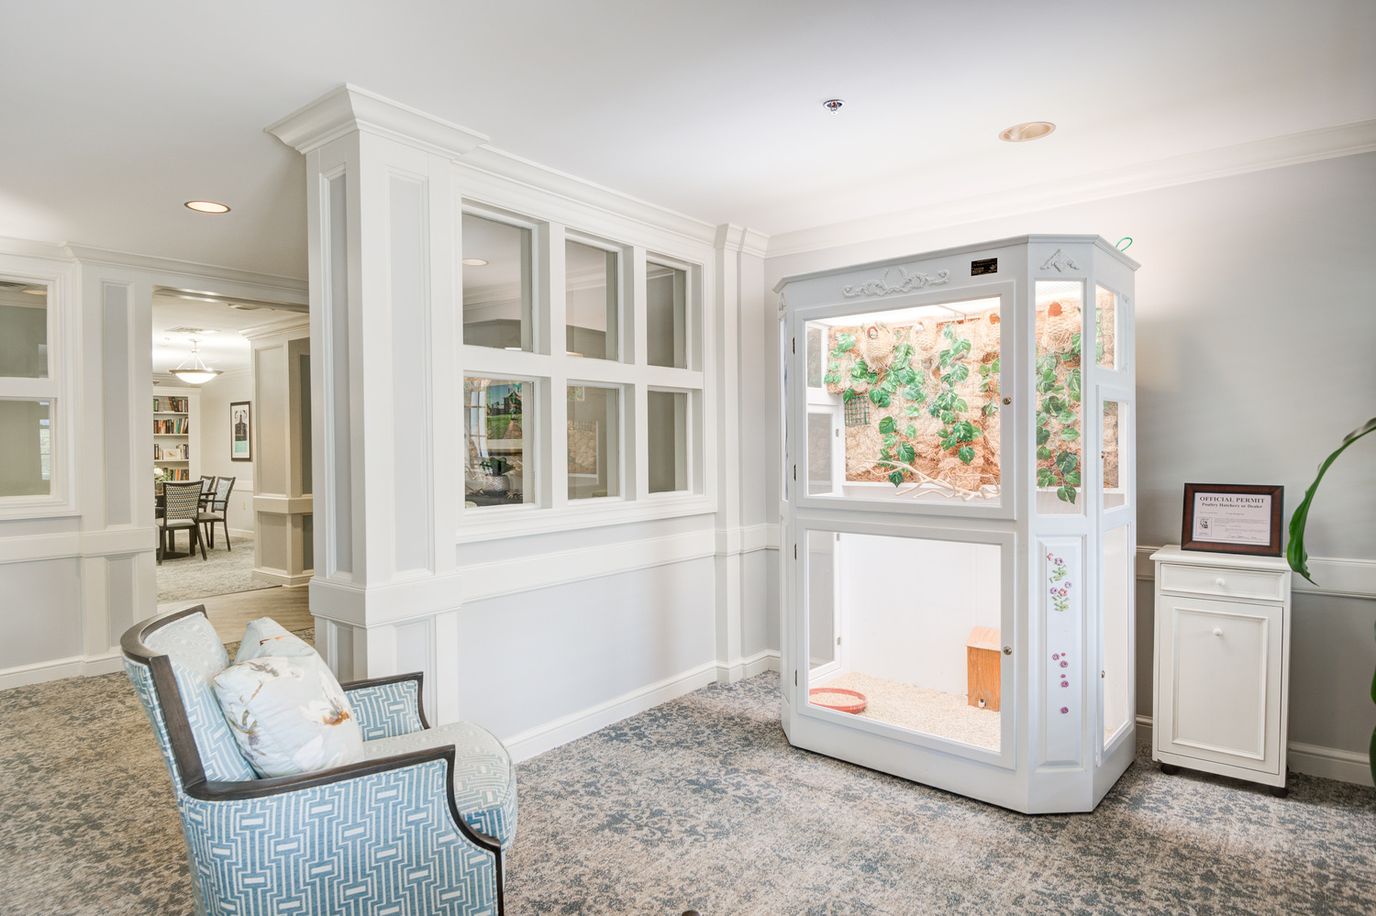
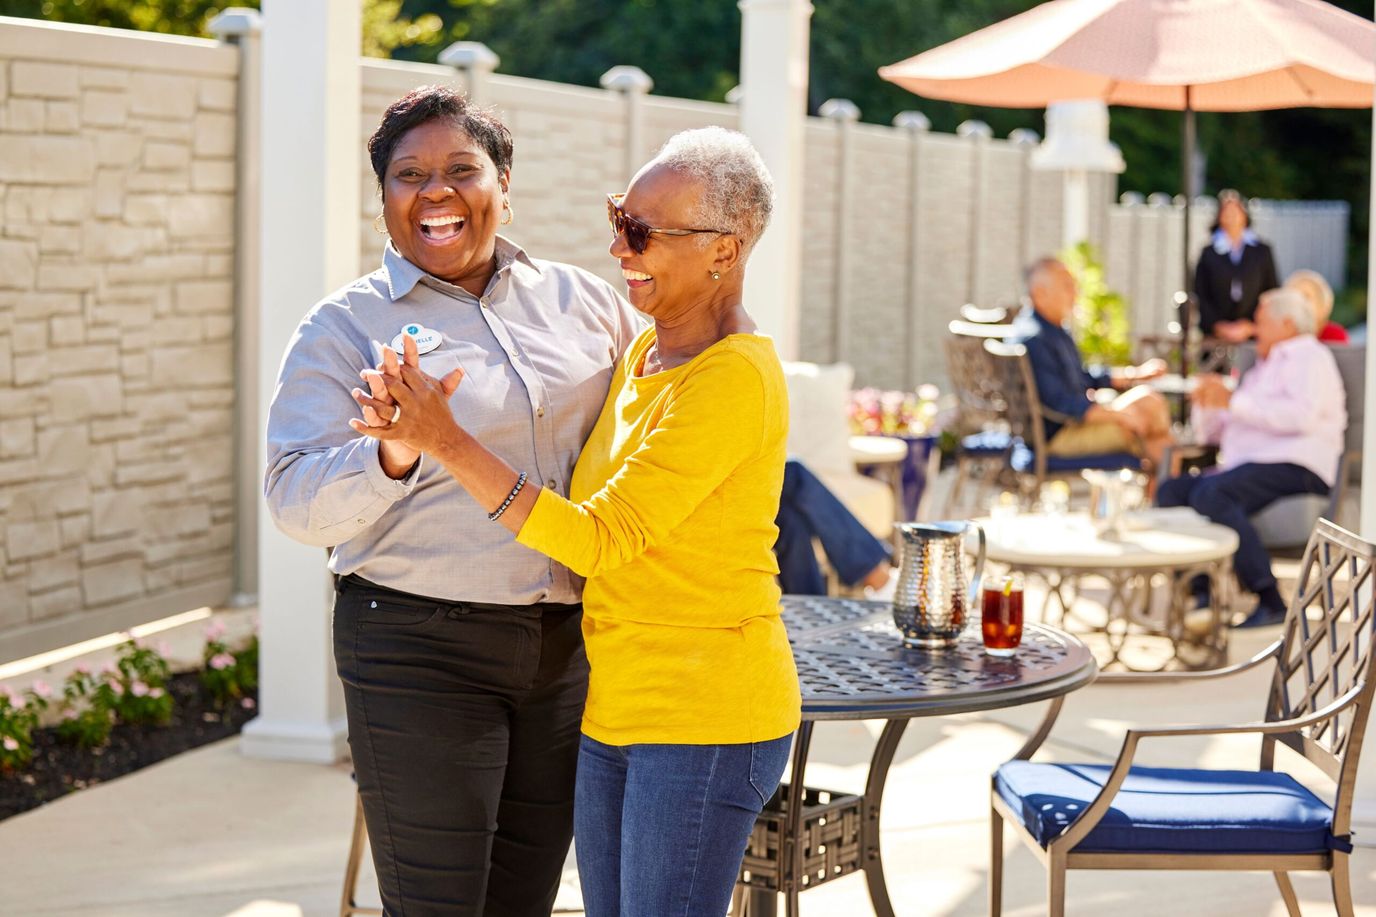
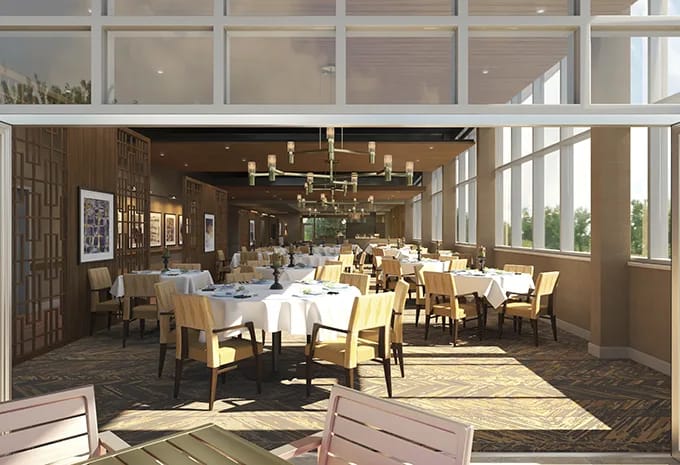
The warm and welcoming community is bathed in sunlight, creating a vibrant and lively atmosphere, and the spacious courtyards are perfect for hosting events and social gatherings that embody an active senior lifestyle. The beautifully landscaped garden and other outdoor areas provides a perfect backdrop for barbecues and outdoor activities, where residents can enjoy a cold drink or simply take in the scenery. Residents can also enjoy regional cuisine and fresh, nutritious meals that are always exciting and dynamic, with the menu changing regularly to keep things interesting.
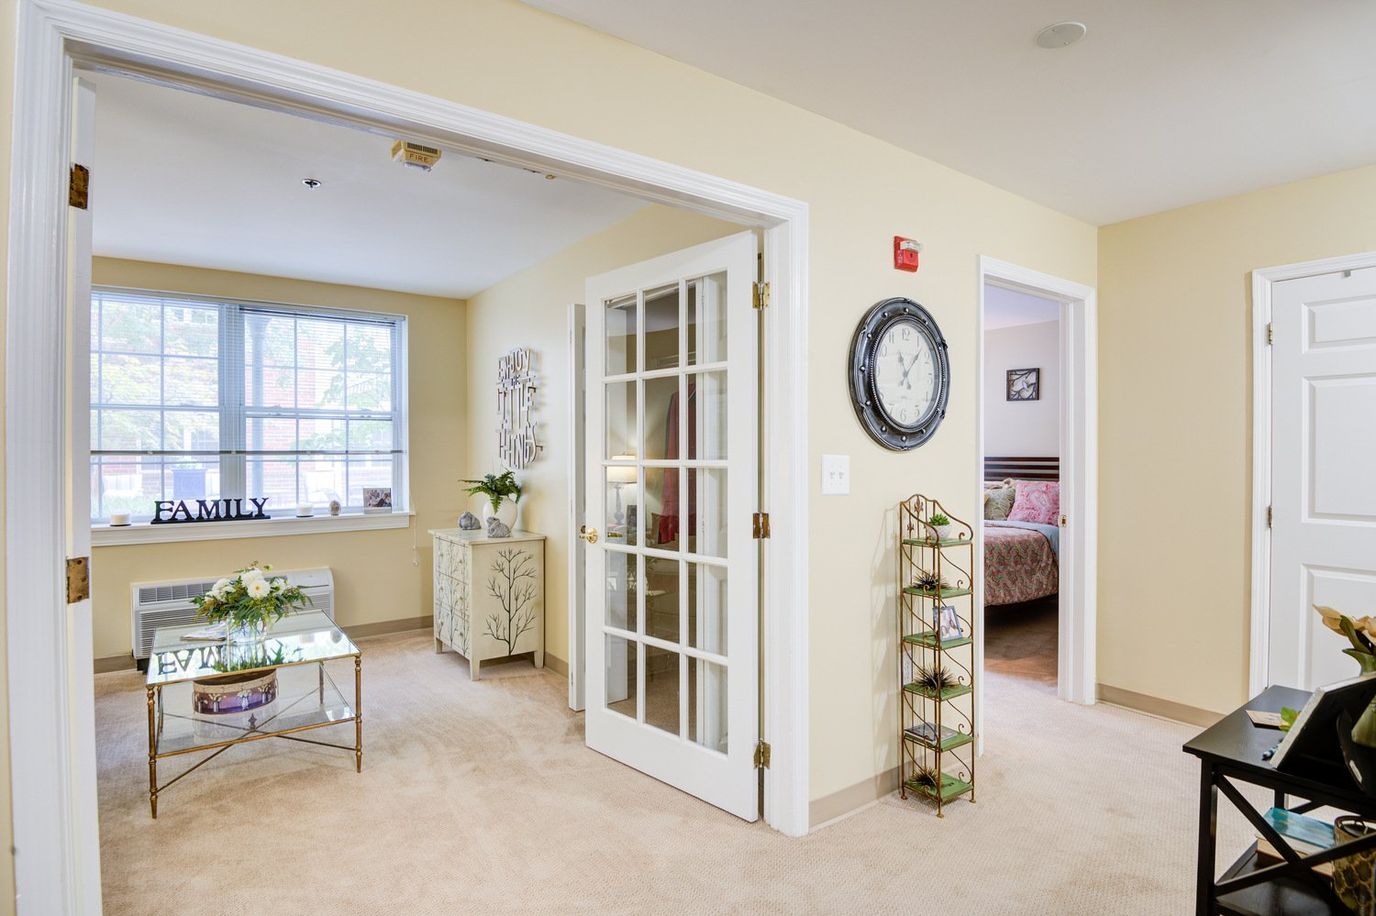
Overview of The Terraces at Tuckerman Lane
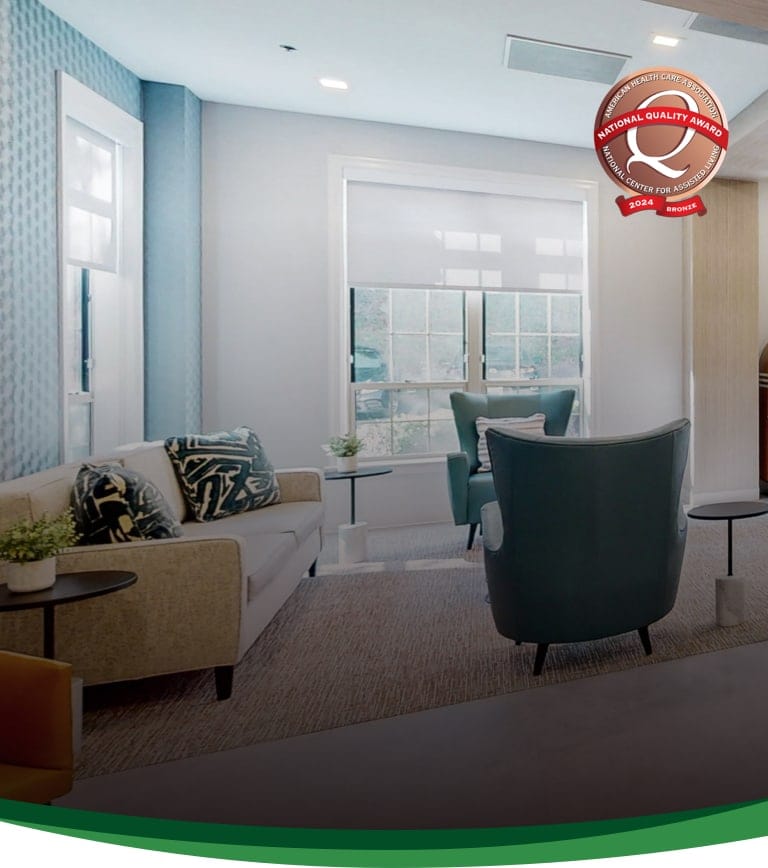
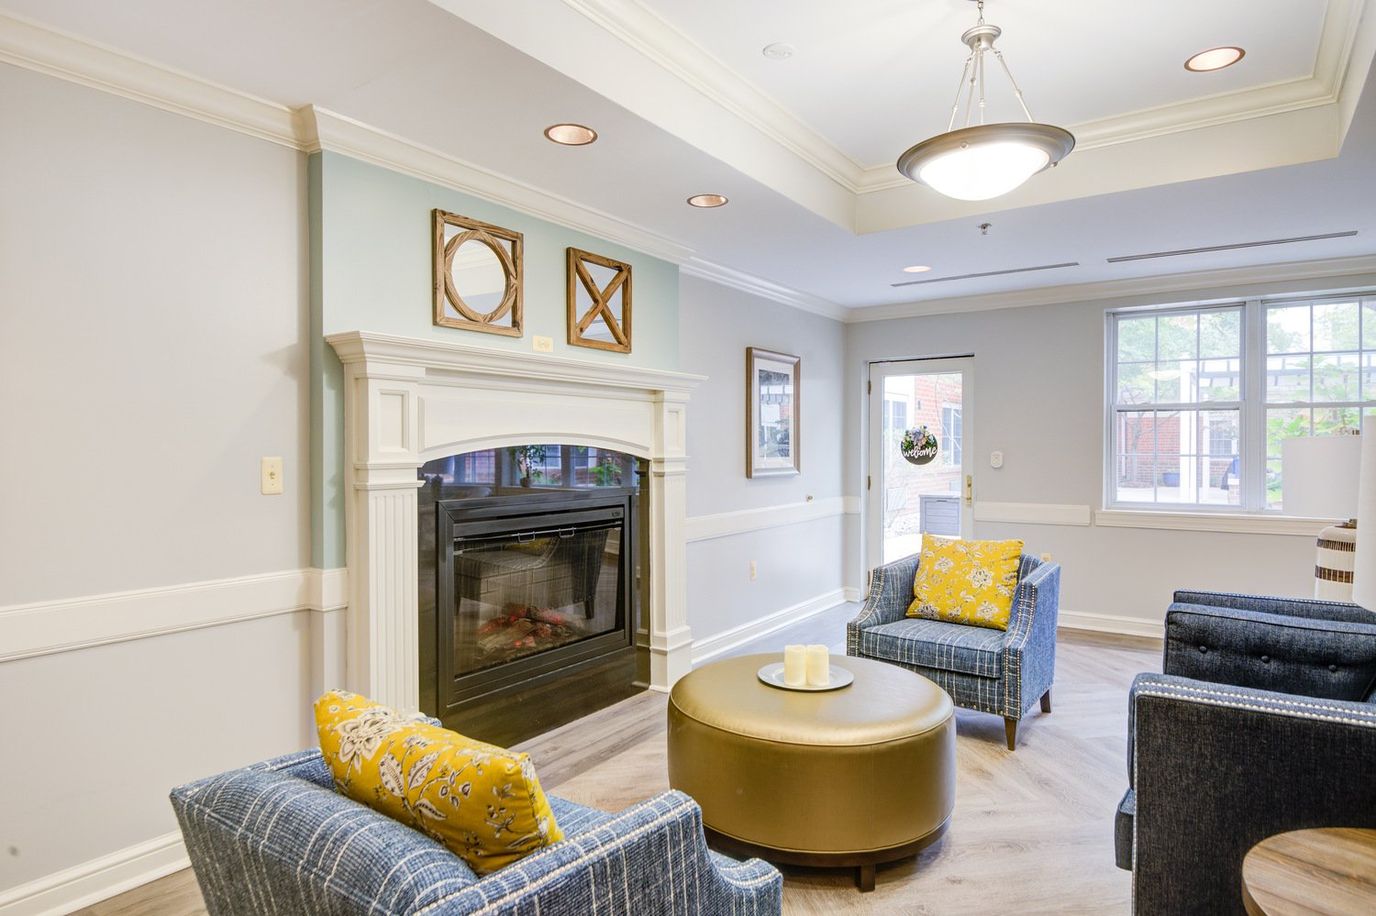
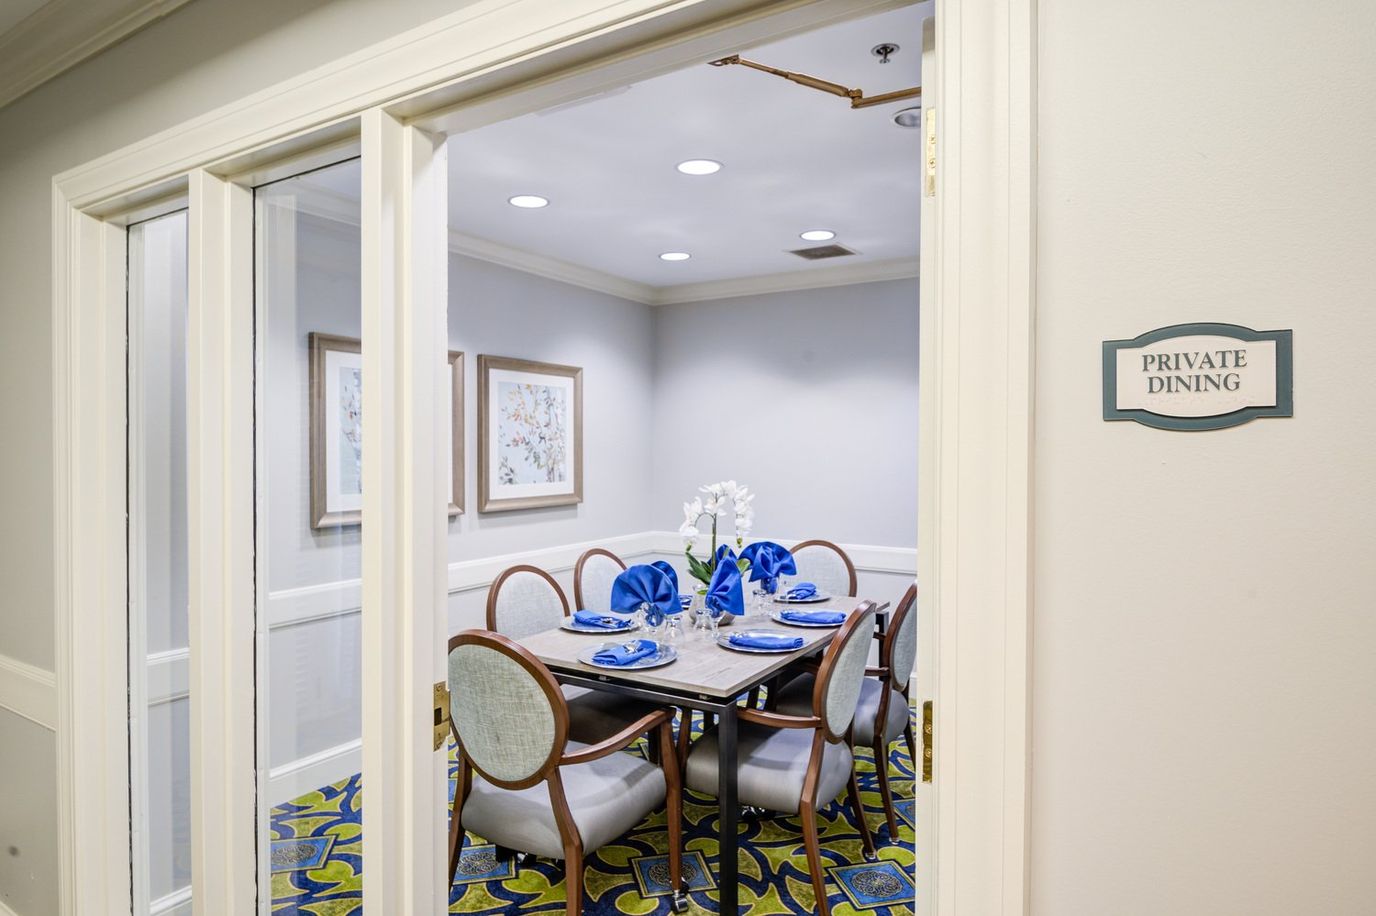
Nestled within the peaceful neighborhood of North Bethesda, Maryland, lies The Terraces at Tuckerman Lane—a home where residents are embraced by a community that radiates unwavering support. The Terraces prides itself on providing exceptional care through a range of specialized programs, including assisted living, memory care, and respite care. Regular visits from experienced physicians further enhance the well-being of residents, guaranteeing top-quality healthcare that is always within reach. Furthermore, specialized support is available for postoperative care, pain management, and other specific needs, ensuring comprehensive care throughout every step of the journey.
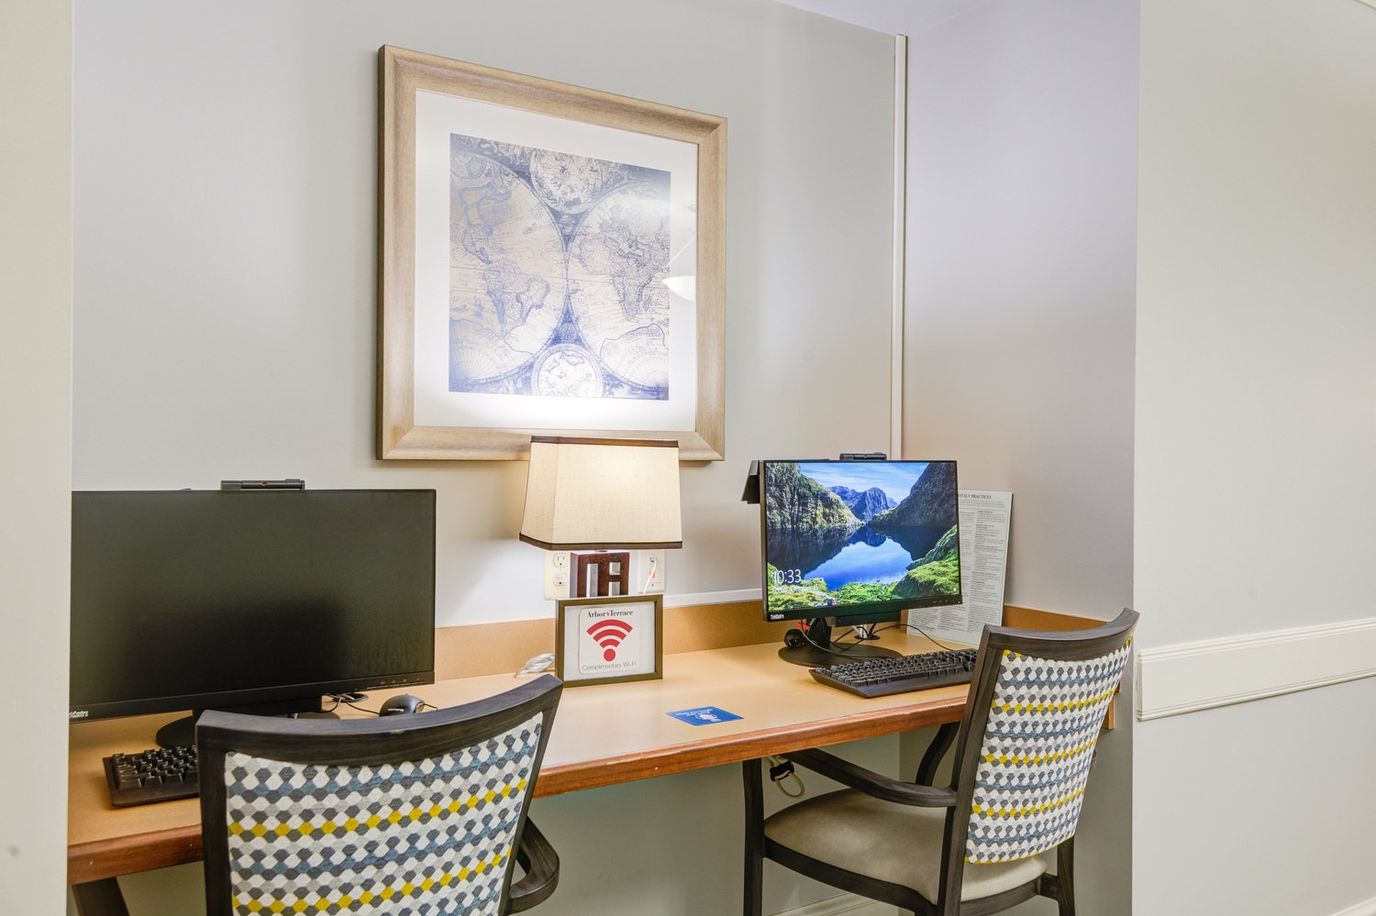
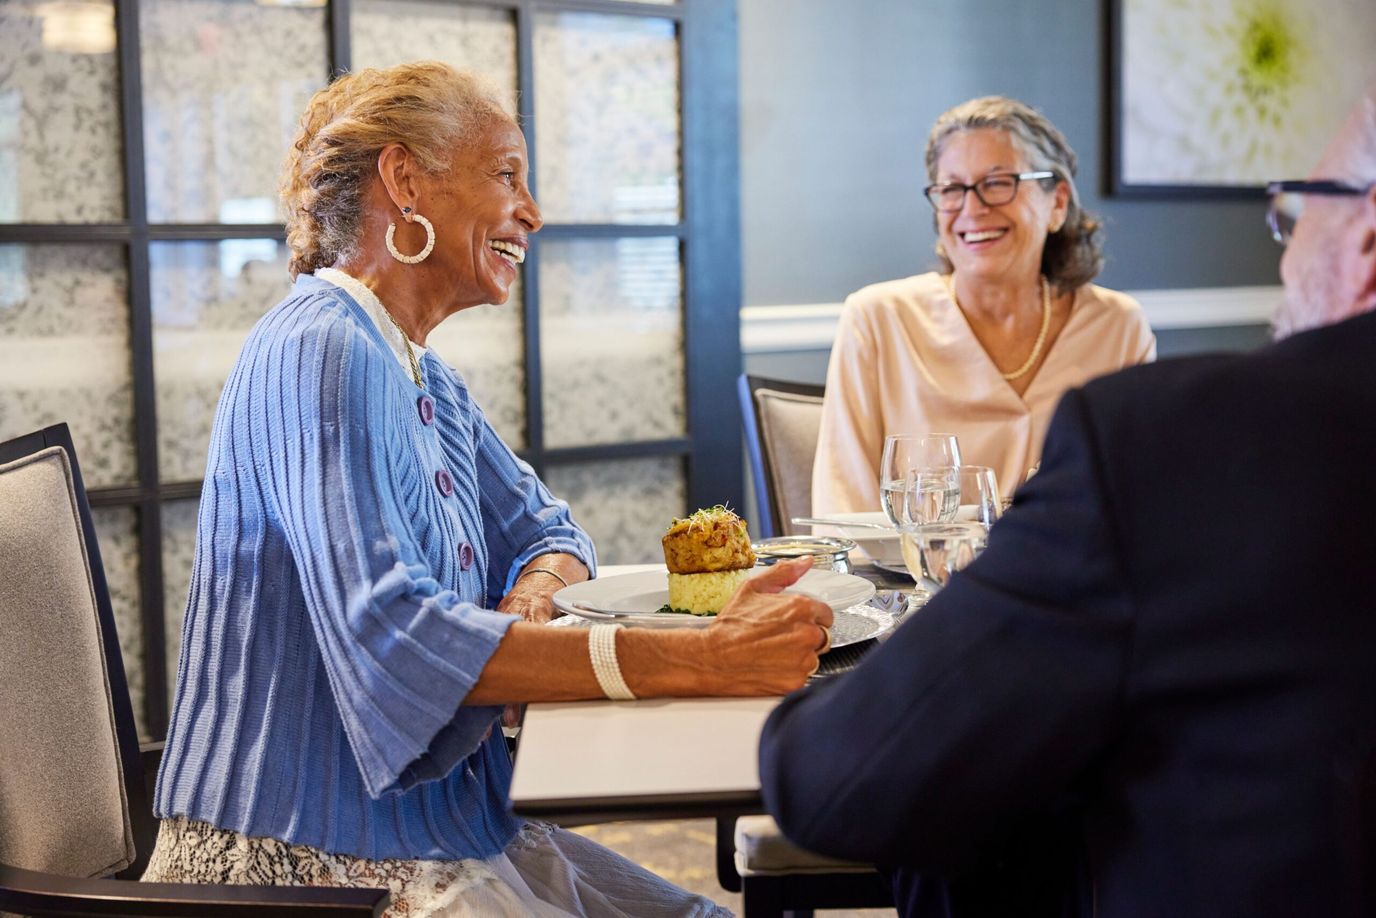
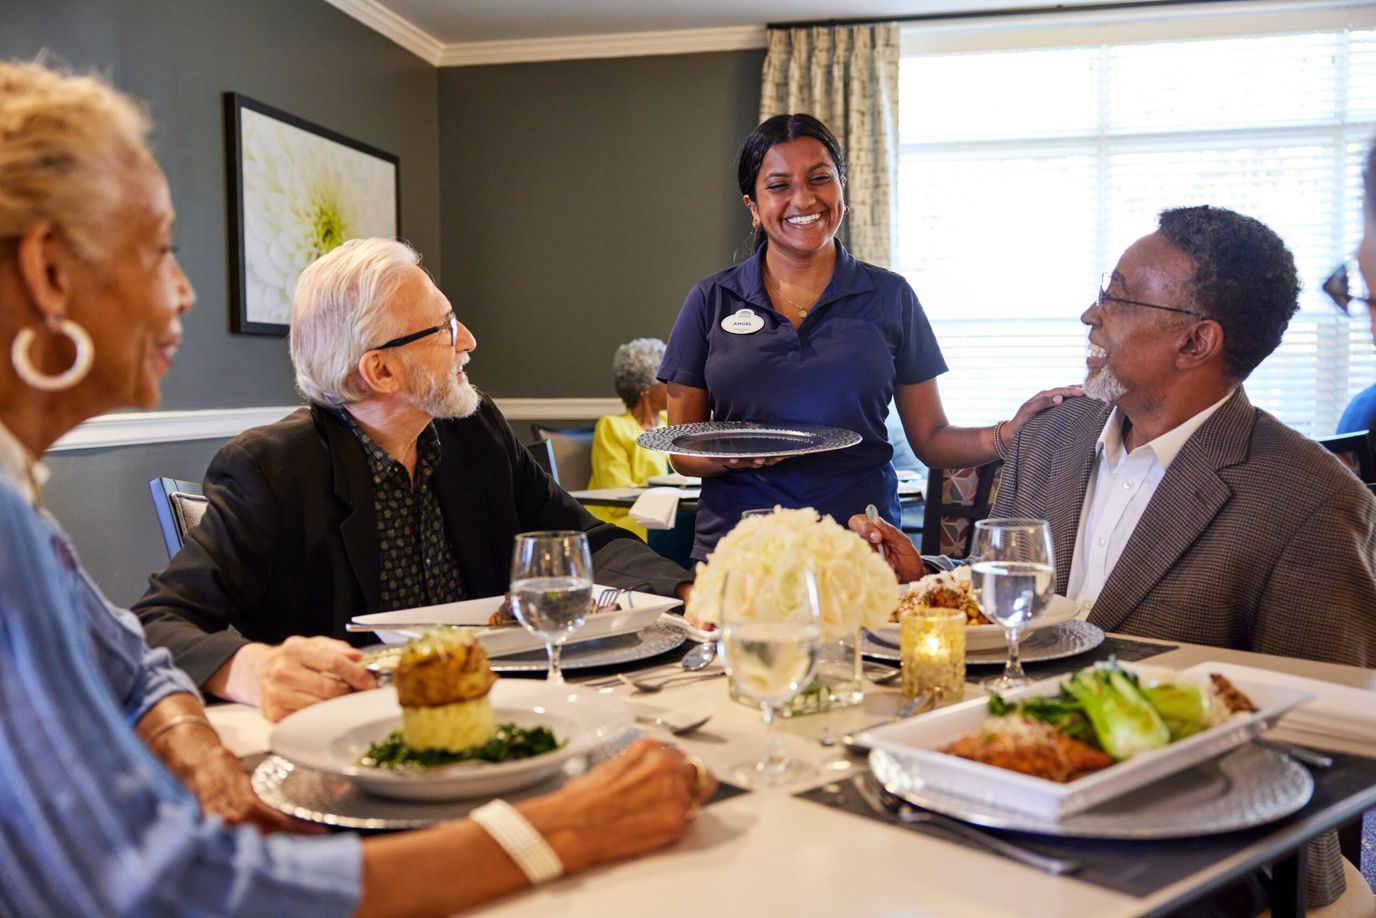
Transparency is a core value at The Terraces at Tuckerman Lane. With their all-inclusive pricing model, residents and their families gain peace of mind through the community’s offerings, eliminating any uncertainties. Culinary experiences here are exceptional, with skilled chefs preparing delectable meals that cater to individual preferences and dietary needs. State-of-the-art technology seamlessly integrates into daily life, offering innovative solutions tailored to the unique requirements of residents. Beyond exceptional care, the community also offers an array of enriching amenities, including a cozy library, a serene chapel, and a well-equipped computer center, fostering personal growth and meaningful relationships.
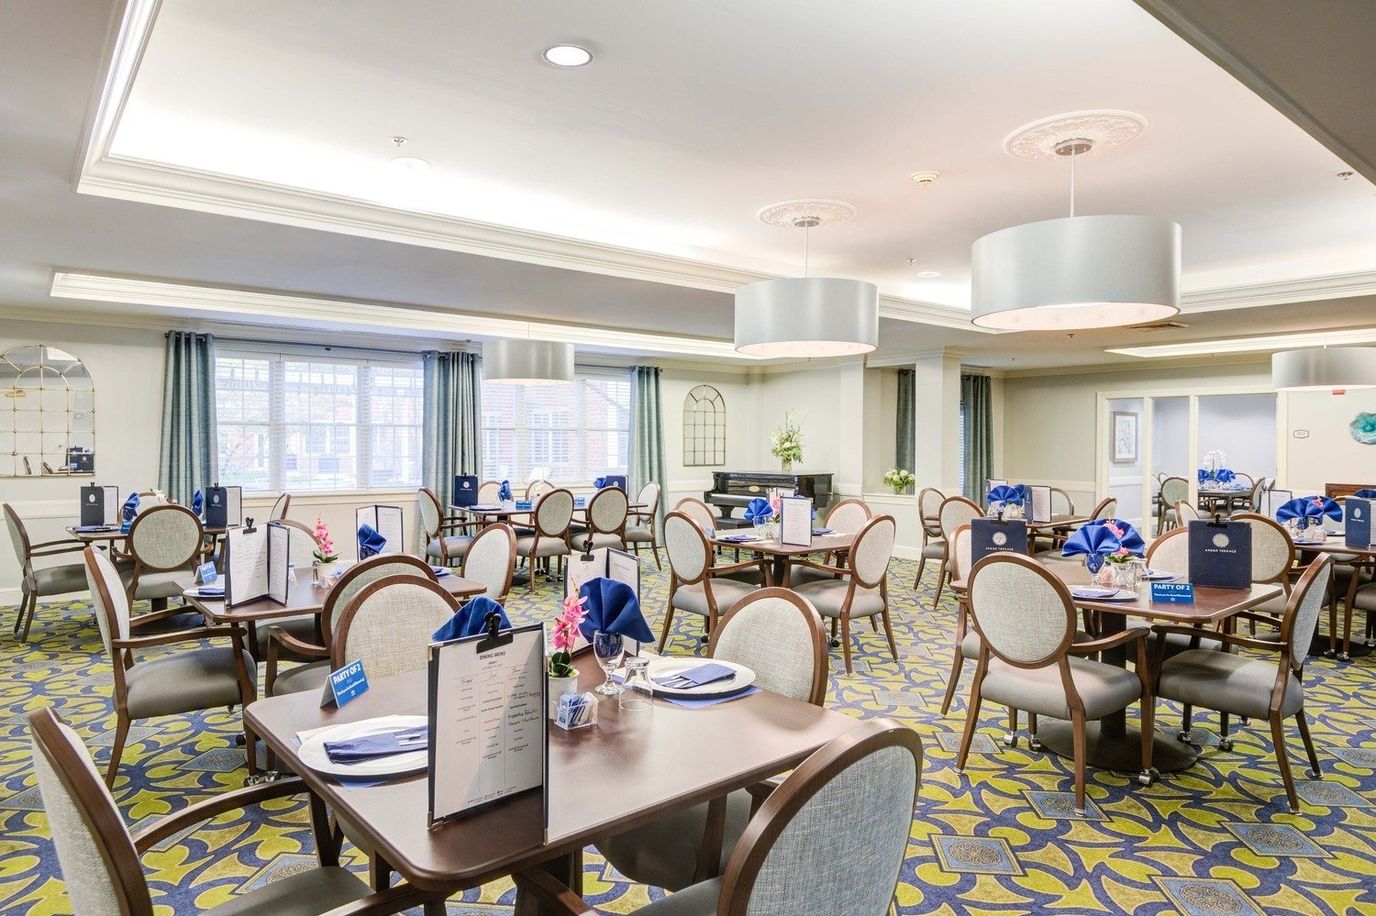
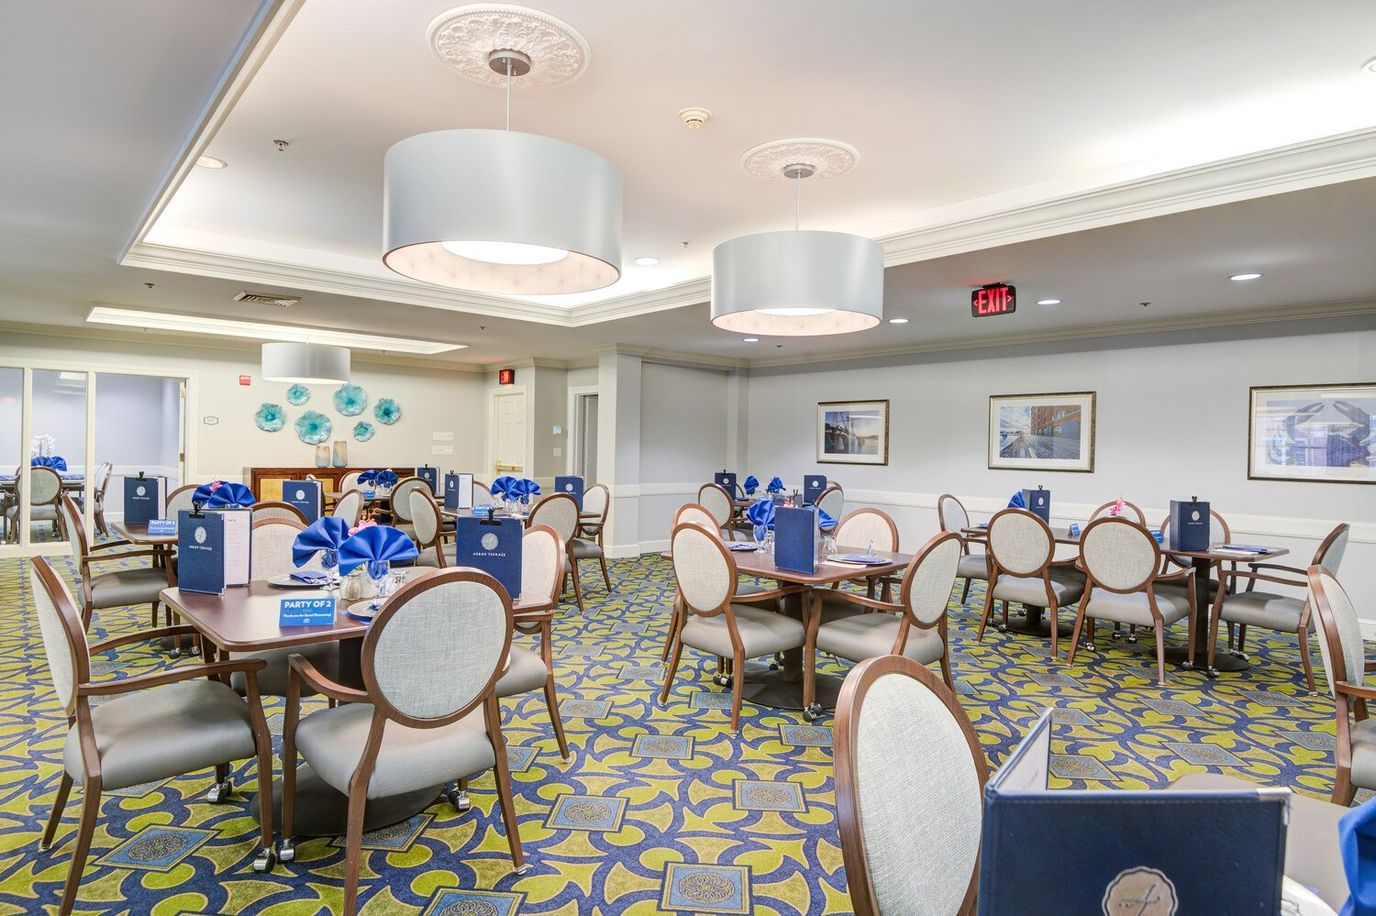
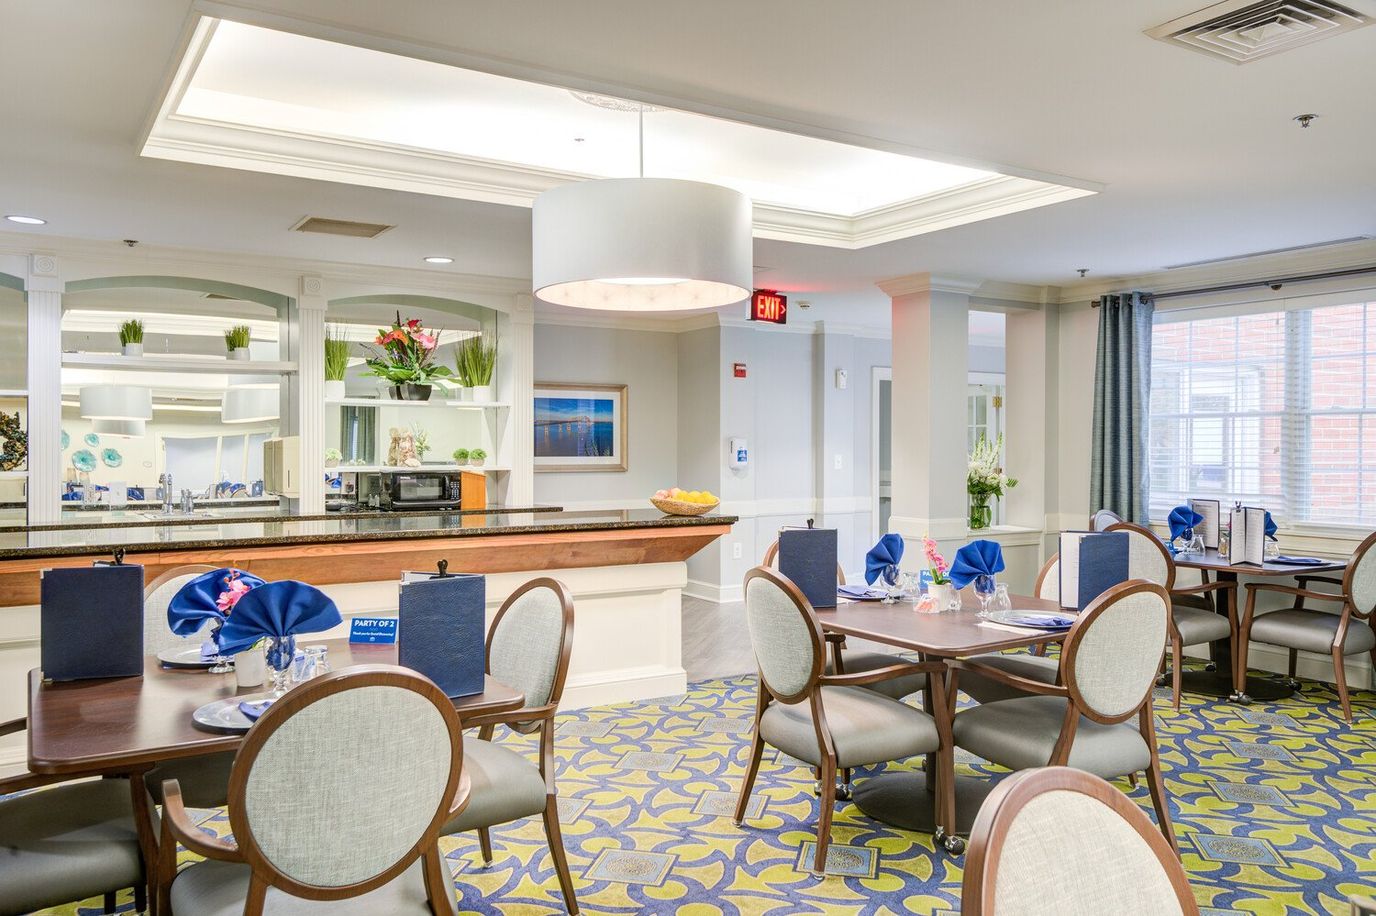
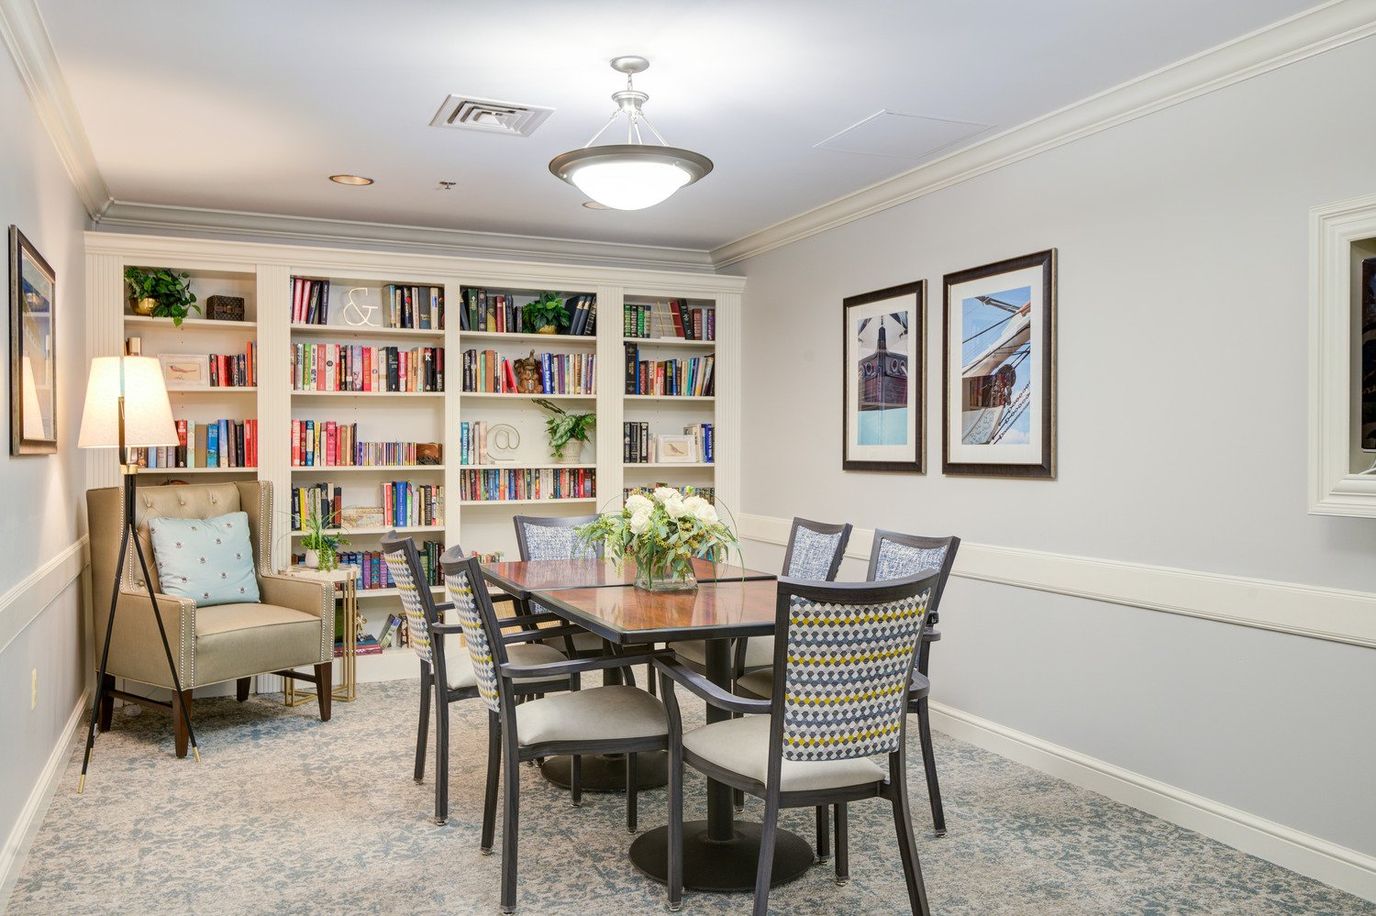
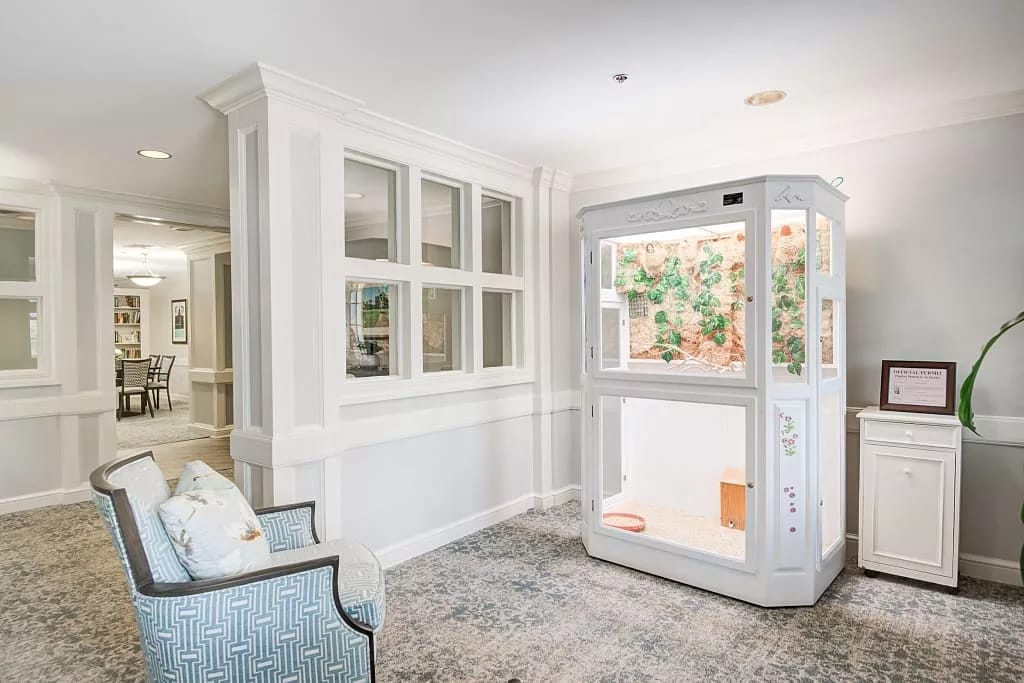
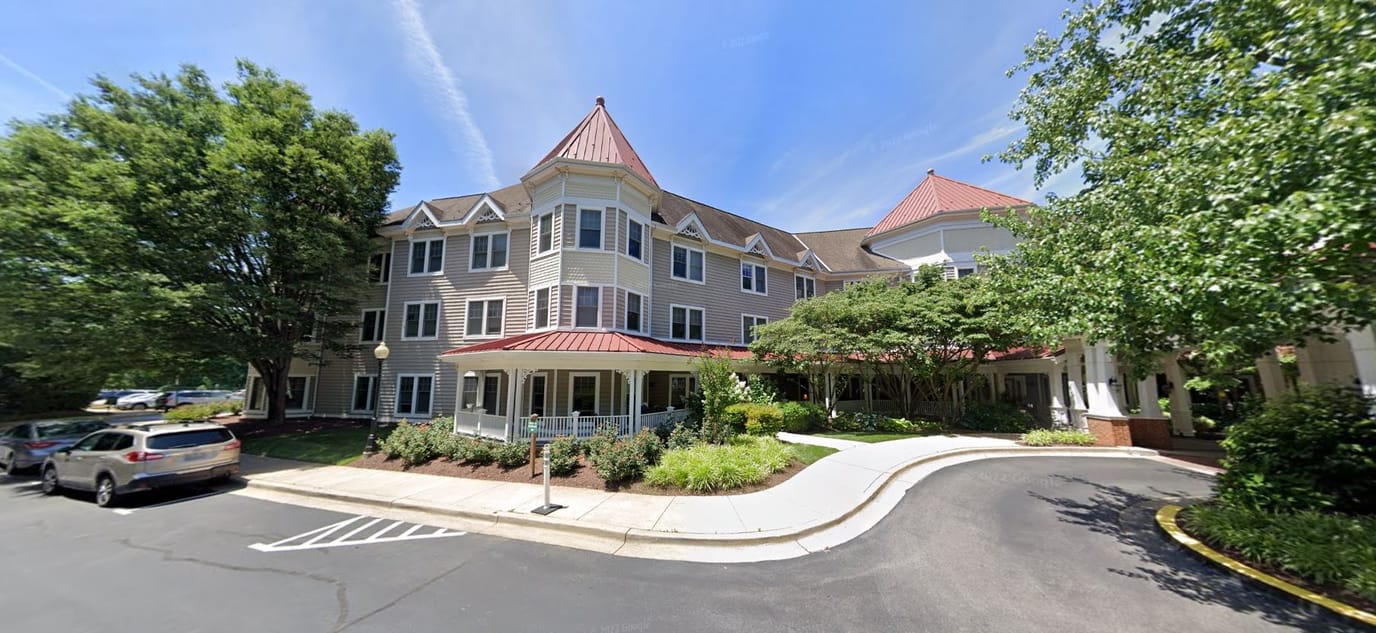
Overview of Arbor Terrace Senior Living
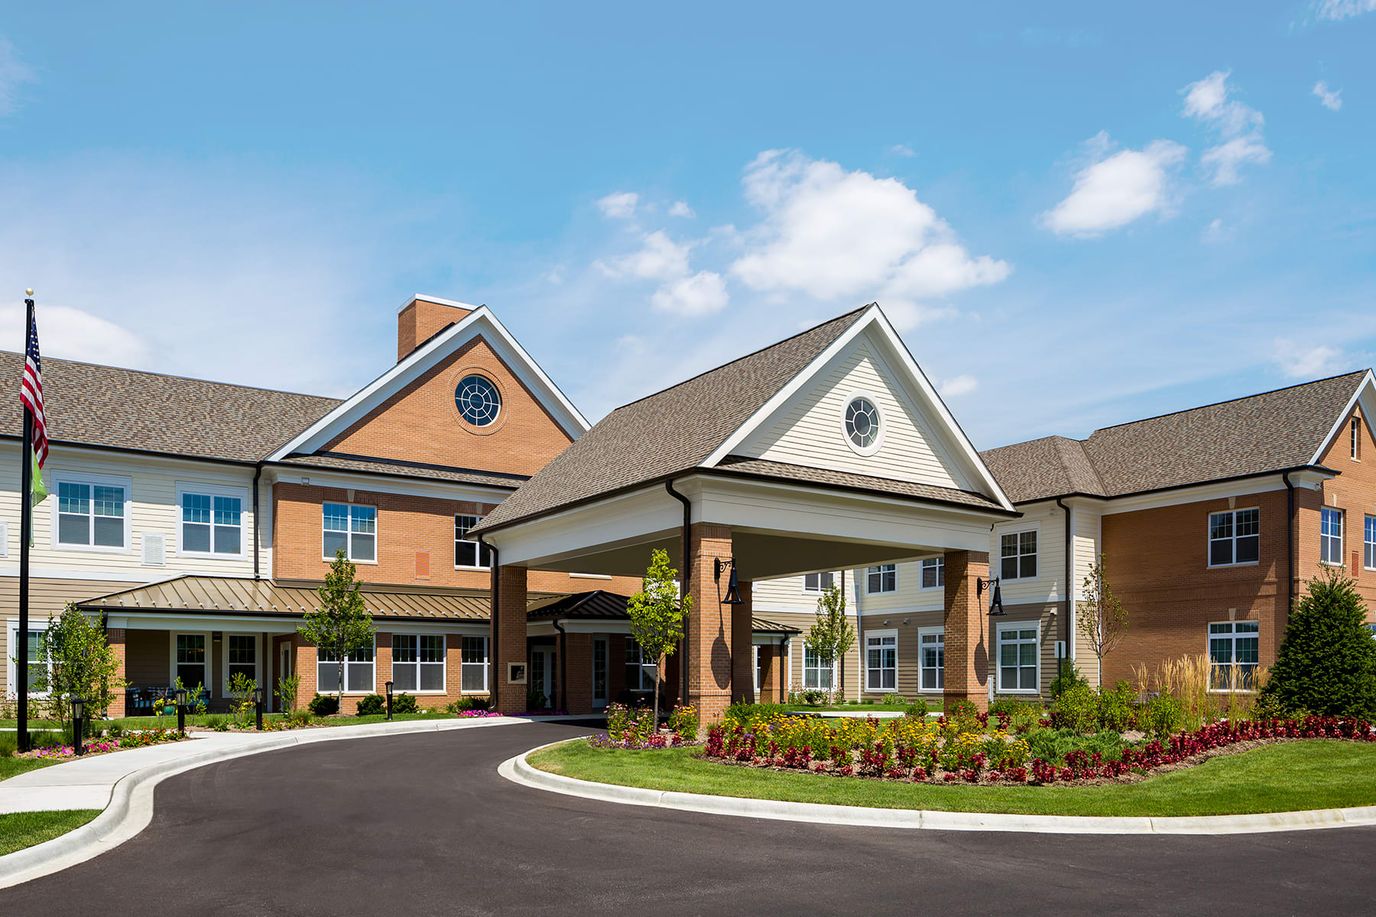
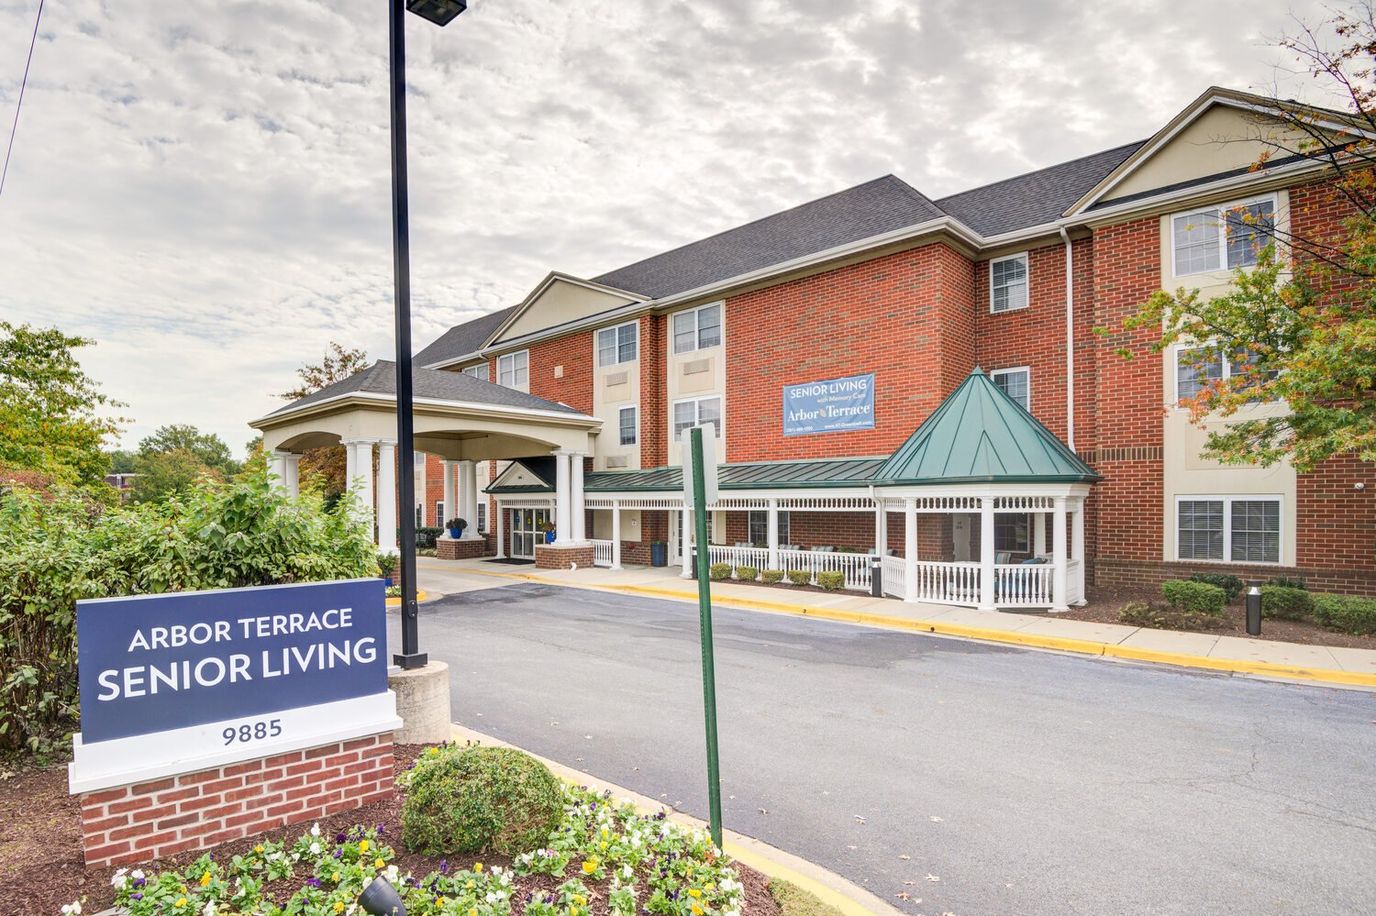
On Greenbelt Road in Lanham, Prince George’s County, Arbor Terrace Senior Living is a 125-bed community that has been running for 27 years. It offers assisted living and memory care. Assisted living starts at $3,500 per month; memory care is $6,400 per month. The community does not accept Medicare, and no Medicaid coverage is listed, so families should plan for private-pay arrangements.
UM Laurel Medical Center is 7.06 miles out. The neighborhood Walk Score is 52, which puts it in moderately walkable territory — some errands on foot, most by car.
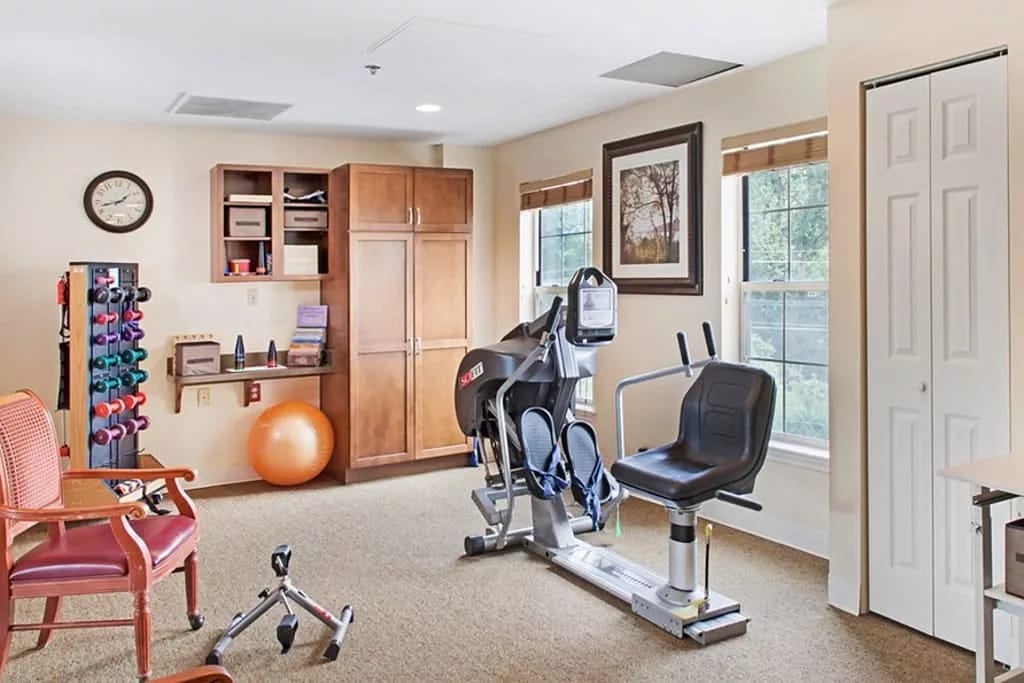
Memory care here is structured across the full progression of Alzheimer’s disease. A dedicated Alzheimer’s unit serves residents at mild, moderate, and severe stages, staffed by licensed nurses and CNAs. That range is worth noting: a community that can support someone from early diagnosis through advanced care eliminates the need to relocate as the disease progresses.
The broader amenity set includes concierge services, exercise and wellness programming, and organized activities. The community is pet-friendly. Dining uses chef-prepared meals with locally sourced ingredients.
At 27 years in operation and with a dedicated Alzheimer’s unit that spans every stage of the disease, Arbor Terrace is a well-established private-pay option in Prince George’s County for families who need assisted living or memory care and want pricing and care range spelled out clearly from the start.
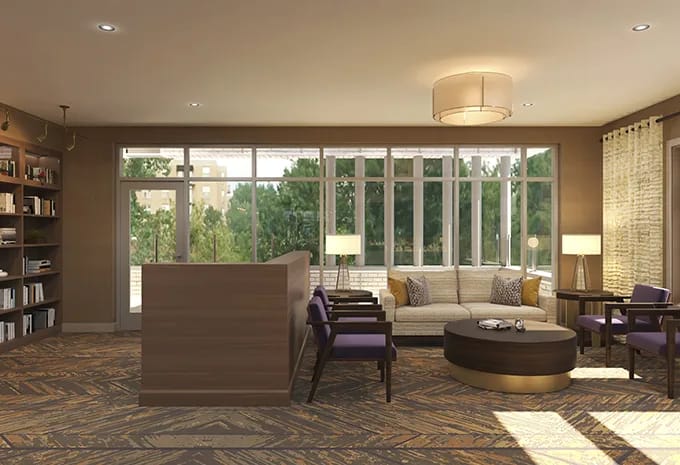
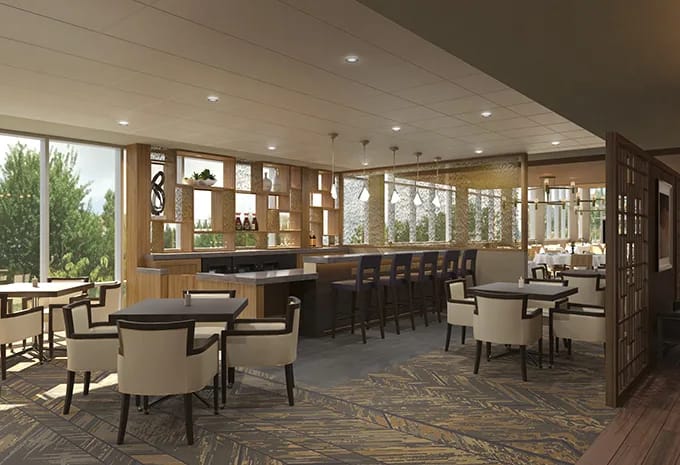
With two decades of experience in senior living, Brightview Bethesda Woodmont is a trusted choice for those seeking exceptional care. Offering a variety of floor plans, residents can find a layout that suits their needs. Gourmet dining, sophisticated amenities, and exceptional services are all part of the package, and there’s no long-term commitment required. Brightview Bethesda Woodmont is conveniently located just minutes away from the Kennedy Center and Walter Reed, offering endless opportunities for fun activities.
With a community movie theater, a beautiful rooftop deck with breathtaking views, and landscaped scenery, seniors can enjoy all that Brightview Bethesda Woodmont has to offer. They also serve delicious, freshly prepared dishes that residents can savor while taking in the sights and sounds of the cityscape.
Overview of Kensington Park Senior Living

Situated on Littledale Road in Kensington, Maryland, Kensington Park Senior Living is a residential care community that offers independent living, assisted living, and memory care. Residents can choose between private and semi-private accommodations within a three-story setting.
The neighborhood has a walkability score of 49, allowing access to some nearby destinations on foot, while most errands require transportation. Designed to support varying levels of care, the community also serves older adults seeking an active lifestyle as well as those needing daily assistance or specialized memory care.
Inspirations Assisted Living & Memory Care of Linthicum
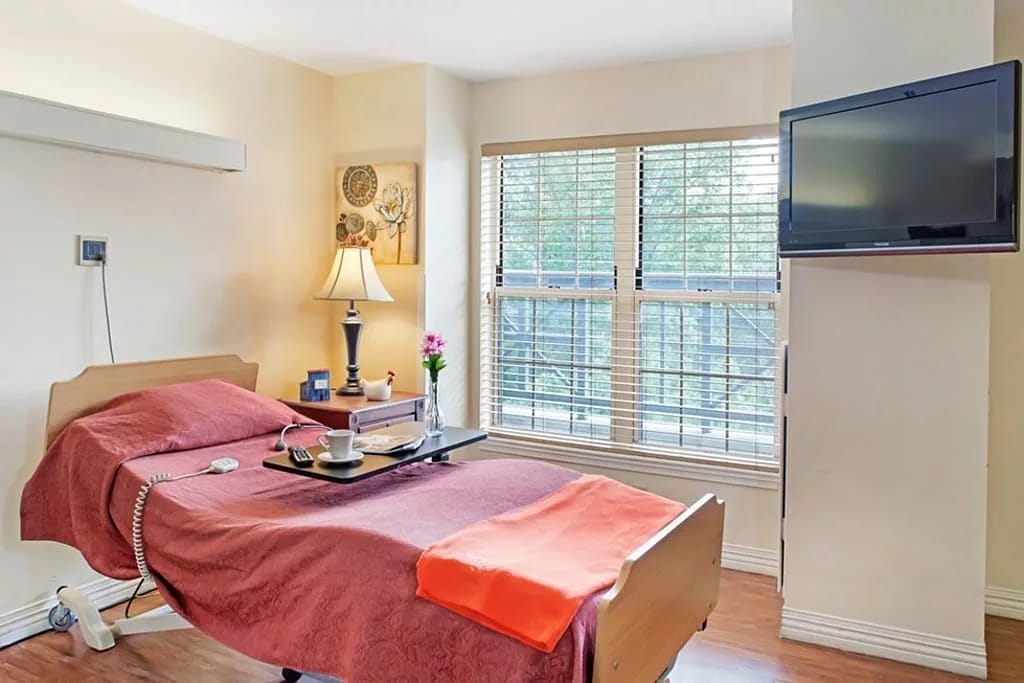
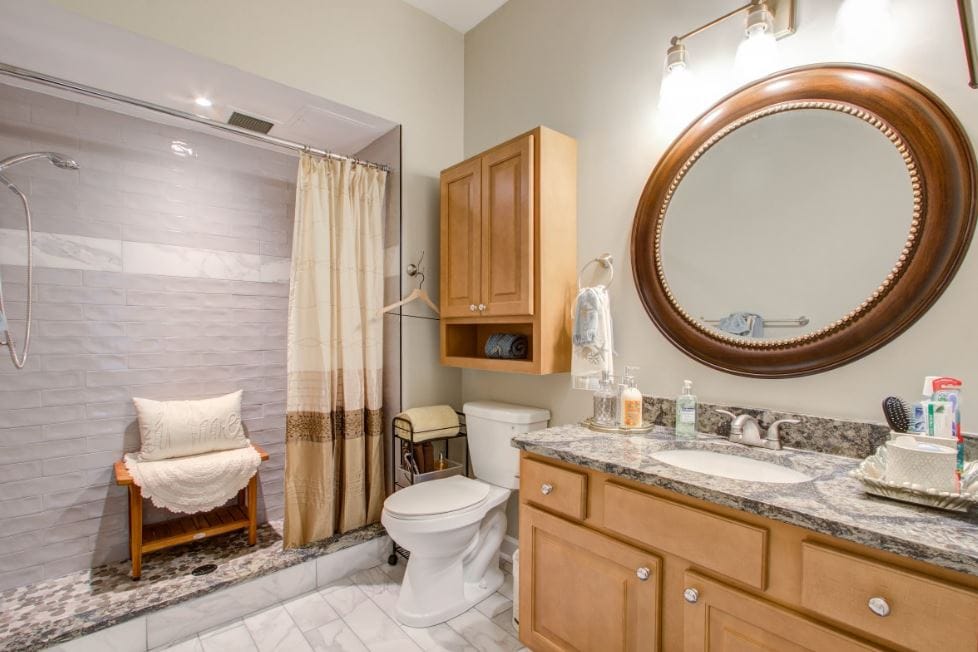
Serving assisted living and memory care occupants, Inspirations Assisted Living & Memory Care of Linthicum is a residential care community in Linthicum Heights, Maryland. Owned by Kacey Troyer, it offers all-inclusive care that includes medication management and attentive assistance with daily living activities like bathing, dressing, mobility, and dining.
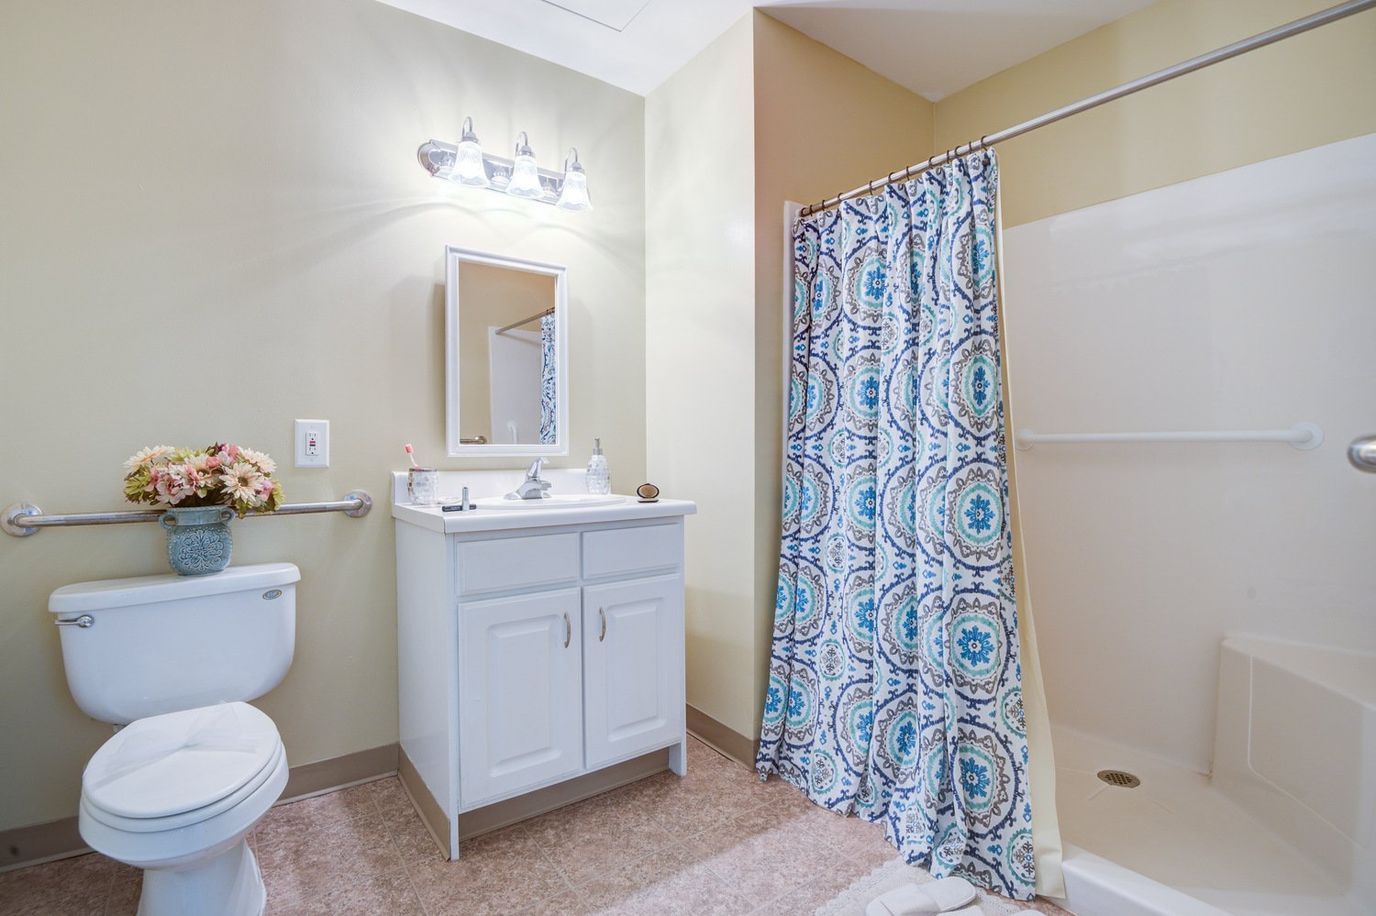
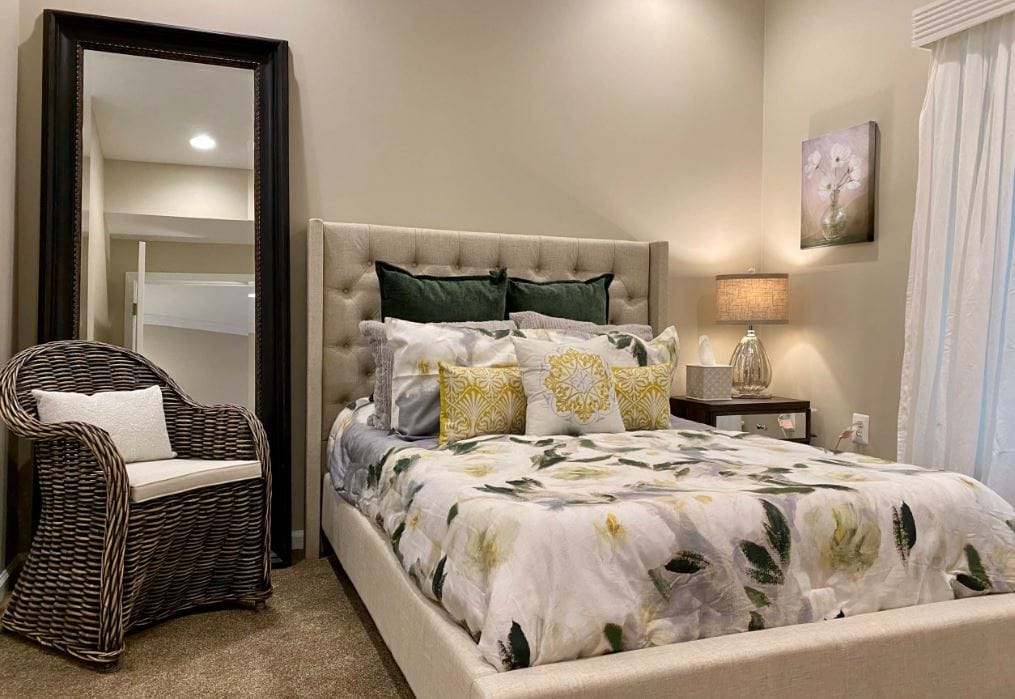
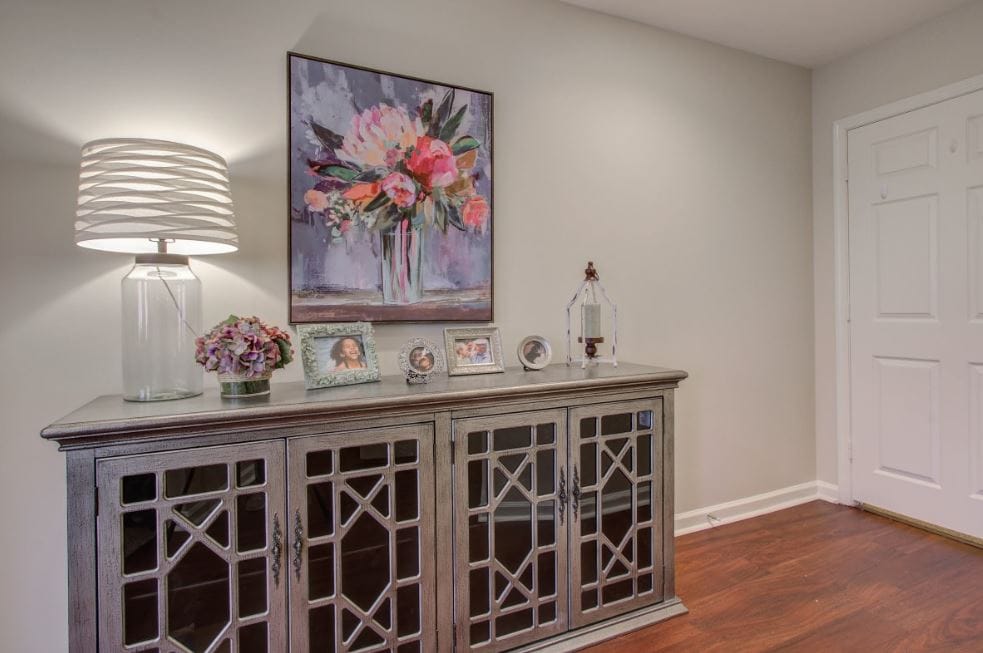
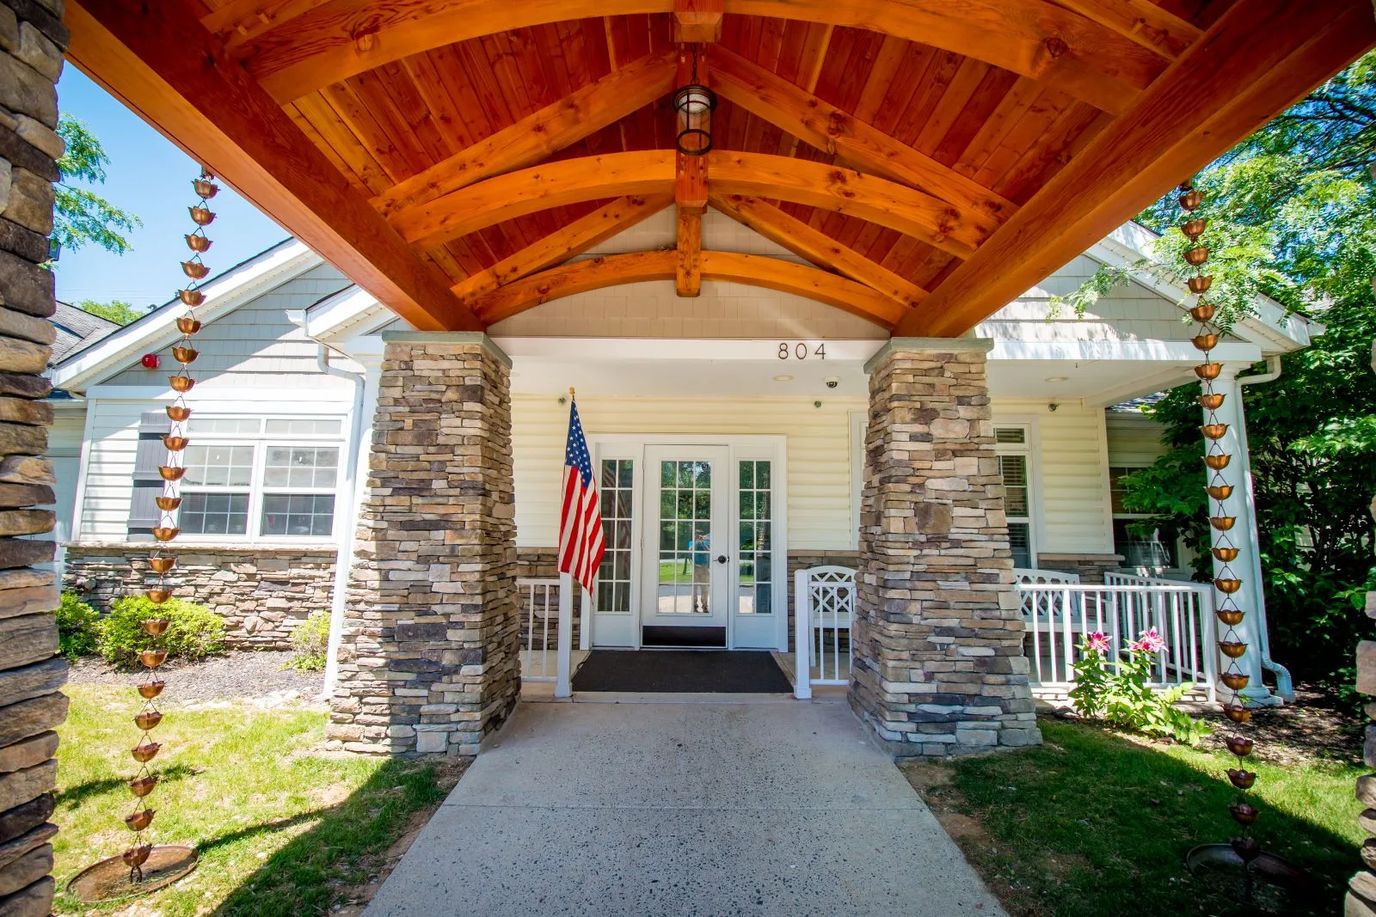
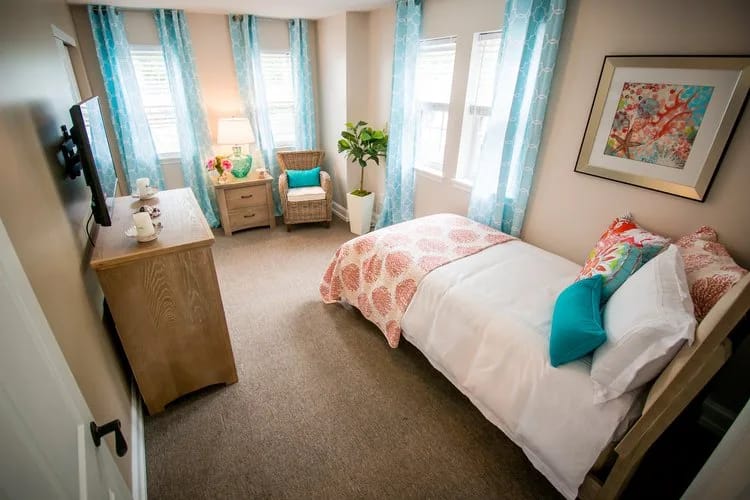
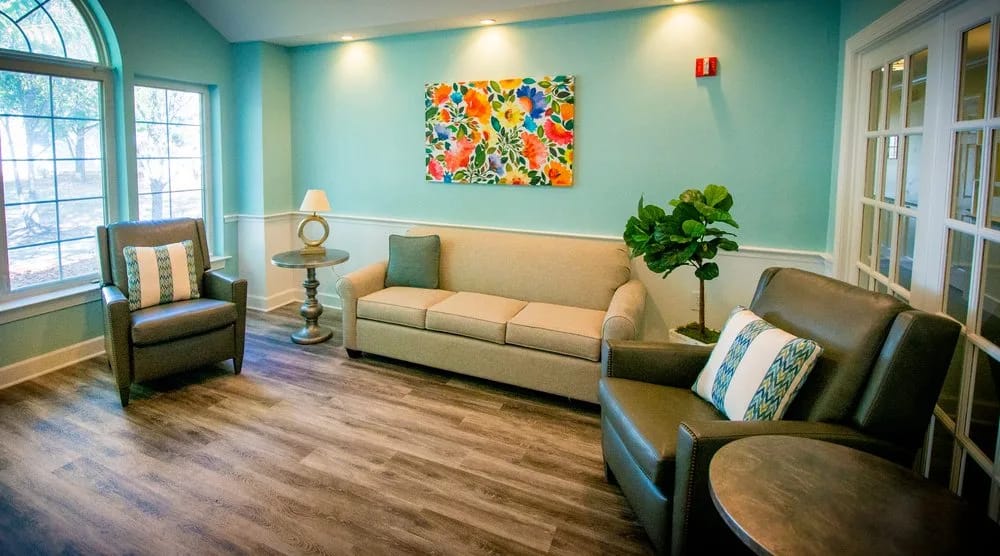
The community sits in a somewhat walkable neighborhood where some errands can be done on foot, with a blend of nearby shops and services close by. Located 0.7 miles from Linthicum Heights’ city center, the facility is well-positioned for resident accessibility and family visits. The home maintains a private-pay model and welcomes family members to visit anytime. The setting underscores a cozy, home-like environment. Residents stay in suites with private full bathrooms and custom ADA vanities, and enjoy access to raised gardens, free Wi-Fi, and flat screen TVs. The well-lit interior and secured grounds supply safety and a calm atmosphere. More offerings include art, music, and animal therapy sessions, along with field trips and life enrichment activities tailored to help occupants discover their interests and engage with the community.
The facility’s 11-year operation brings an established history in the area. The staff-to-resident ratio is described as superior, mirroring a dedication to individualized attention and care.
Overview of Complete Care in Hyattsville


On Lasalle Road in Hyattsville’s Queens Chapel neighborhood, Complete Care in Hyattsville is one of the larger nursing campuses in Prince George’s County: 270 beds, five care types, and an occupancy rate of 92.5%. CMS data puts the current resident count at 280. The average stay is 140 days, a figure consistent with a population that spans short-term rehab and extended nursing care. Getting around the area requires a car for most errands; the Walk Score is 42.
The care type list is broad: nursing home care, hospice, memory care, palliative care, and respite care are all offered on campus, administered by Antionette Doublin. Confirmed services include rehabilitation, short-term rehab, post-acute care, and respite care.
A Hoyer lift is available on-site. An Active Resident Council and a Residents Group, both confirmed through CMS Facility Characteristics, are among the organized programs. The facility accepts Medicare, Medicaid, and private pay.
Staffing figures from CMS put total nursing hours at 3 hours 17 minutes per resident per day, with RN coverage at 48 minutes and nurse aide hours at 2 hours 1 minute.
Complete Care in Hyattsville is a large, high-occupancy nursing campus with a wide care-type footprint. Families who need a facility that can accommodate shifting care needs, including hospice and memory care, within one location, and who require Medicare or Medicaid coverage, will find that this campus is structured for exactly that.
Ranking Methodology
How we rank these memory care communities
Every community above is evaluated across six weighted categories using public data including state inspection records, review platforms, BBB profiles, and operator-published materials.
Weighting overview
- 35%Resident Experience
- 25%Regulatory
- 15%Visual Media
- 10%Website
- 10%Stability
- 5%Environment
01
Resident & Family Experience 35%
The single largest share of every ranking. Aggregated review sentiment and volume from major platforms — the closest signal to real resident experience.
- Includes
- Review Sentiment
- Review Volume
02
Regulatory & Safety Record 25%
State inspection records, citations, and complaint visits. We weight per-inspection rates more heavily than raw counts.
- Includes
- State Inspections
- Citations/Inspection
- % Inspections w/ Citations
- Complaint Visits
- Accreditations
- BBB Rating
03
Visual Media & Transparency 15%
Communities that publish high-quality visuals give families a real preview. No photos or tours = a negative transparency signal.
- Includes
- Video Tours
- Virtual Walkthroughs
- Photo Quantity
- Photo Quality
04
Website & Operator Transparency 10%
Site quality and whether the operator publishes basic accountability information — staff names, contact details, ownership.
- Includes
- Website Content
- Mobile Usability
- Staff Info Available
- Owner Info Available
05
Community Stability 10%
Operational signals indicating whether a community is well-run and meeting demand.
- Includes
- Occupancy Rate
- Bed Options
06
Environment & Pricing 5%
Walkability and pricing transparency. Walk Score is weighted higher for Independent Living than for Memory Care, where most residents do not leave unaccompanied.
- Includes
- Walk Score
- Pricing Transparency
Who we are
Your Senior Care Partner, Every Step of the Way
We help families find affordable senior communities and unlock same day discounts, Medicaid, and Medicare options tailored to your needs.
Contact us Today
Frequently Asked Questions about Memory Care in Hyattsville, MD
What is the average cost of memory care in Hyattsville, MD?
The average monthly cost of memory care in Hyattsville, MD is approximately $5,000. Actual rates vary by community, level of care, and floorplan.
What is the price range for memory care in Hyattsville, MD?
Memory care in Hyattsville, MD typically ranges from $4,000–$6,500 per month, depending on the community, room type, and care needs.
What is the typical staff-to-resident ratio at memory care communities in Hyattsville, MD?
Memory care communities in Hyattsville, MD typically operate with a staff-to-resident ratio in the range of 1:5–1:8.
What's the difference between assisted living and memory care in Maryland?
Assisted living in Maryland supports residents with daily activities (bathing, dressing, medication management) while preserving independence. Memory care is a specialized form of assisted living for residents living with Alzheimer's or dementia, and adds 24/7 secured environments, dementia-trained staff, and structured routines designed to reduce confusion and wandering.
Does Maryland Medicaid cover memory care?
Maryland Medicaid does not directly pay room-and-board for memory care, but most states (including Maryland) offer Home and Community-Based Services (HCBS) waivers that can offset the cost of care services delivered inside a licensed community. Eligibility, waitlists, and covered services vary — check directly with the state Medicaid agency.
What is memory care?
Memory care is a specialized form of assisted living for residents living with Alzheimer's disease or other forms of dementia, with secured environments, dementia-trained staff, and routines built to reduce confusion and wandering.
How many memory care communities are listed on this page?
This page features 7 memory care communities in Hyattsville, MD. Use the filters and comparison tools above to compare ratings, amenities, and pricing.
Updated on
