Best Nursing Homes in Burlington, VT

Why trust this guide? Our editorial team analyzed 4 nursing homes in Burlington, VT using CMS data, inspection records, complaints, amenities, and facility-level details. How we rank nursing homes in VT
Reviewed by
Last updated
We analyzed These are the facilities in Burlington, VT our team has analyzed — not a count of every nursing home provider in Burlington, VT.
4 homes
Other senior care options in Burlington:
Avg Overall CMS Rating: 2.5/ 5The average Overall CMS Rating for all CMS-certified nursing homes in Burlington, VT. Ratings combine health inspections, staffing, and quality measures, with inspections weighted most. Individual facilities can vary widely from this average.
National Average: 3.2/ 5
Avg Staffing Rating: 2.5/ 5The average Staffing Rating across all CMS-certified nursing homes in Burlington, VT. Reflects nursing staff hours per resident per day (including RNs), adjusted for residents' care needs. Individual facilities can vary widely from this average.
National Average: 3.4/ 5
Avg Health Insp. Rating: 2.5/ 5The average Health Inspection Rating across all CMS-certified nursing homes in Burlington, VT. Based on each facility's recent inspections and complaint investigations, weighing the number, scope, and severity of deficiencies. Individual facilities can vary widely from this average.
National Average: 3.0/ 5

Compare Nursing Homes around Burlington (Metro Area)

Info below is compiled from CMS reports & the VT Dept. of Disabilities, Aging & Independent Living (DAIL), senior community websites & trusted data sources such as Walk Score & BBB.

Communities are listed from highest to lowest based on our ranking methodology.

The facility name. Click to view the full profile page on Assisted Living Magazine, including photos, services, and contact info.
CMS (Centers for Medicare & Medicaid Services, the federal agency that regulates nursing homes) Overall 5-star rating — a composite of Health Inspection, Staffing, and Quality Measures scores. 5 stars = top 10% nationally. 1 star = bottom 10%. The single most important number to start with when comparing facilities.
Care Types in This Table NH (Nursing Home): 24/7 skilled nursing care for residents with complex, ongoing medical needs. SNF (Skilled Nursing Facility): Round-the-clock nursing care, often for recovery after surgery, injury, or illness. MC (Memory Care): Secured, specialized care for people living with Alzheimer's or dementia. RC (Respite Care): Short-term temporary care that gives family caregivers a break. HOS (Hospice Care): Comfort-focused care for those with a terminal illness, prioritizing quality of life over treatment. PC (Palliative Care): Comfort-focused care for serious illness at any stage, including alongside curative treatment.
Neighborhood or city area where the facility is located. Proximity to family, hospitals, and green space matters for both quality of life and ease of visitation. Consider drive time and transit access when evaluating location.
Licensed bed capacity. Larger facilities (300+ beds) often have more specialized programs but can feel institutional. Smaller homes (under 150 beds) tend to deliver more personalized care. Compare with Avg Res/Day to understand how full the facility typically runs.
Percentage of licensed beds filled on an average day. Color indicates financial health: green (90%+) = operationally strong, typically profitable. Amber (80–89%) = stable but leaving revenue on the table. Orange (70–79%) = financial strain likely, may struggle with fixed costs. Red (<70%) = significant distress, closure or ownership change risk increases sharply.
This facility's occupancy rate compared to the statewide average for similar facilities. A positive number means above-average demand. Facilities running 5%+ above the state average are typically the most sought-after in their market — a strong proxy for reputation.
CMS-adjusted total nurse hours per resident per day (RN + LPN + CNA combined). The national average is approximately 3.5 hrs. Higher is better — more direct care time per resident. Below 3.0 is a red flag. CMS weights RN hours more heavily because RNs handle complex clinical decisions that CNAs cannot.
CMS Health Inspection star rating (1–5 stars), based on the 3 most recent annual state surveys plus any complaint investigations. This is the hardest rating to manipulate — it reflects real surveyor findings on-site. 5 stars = fewest deficiencies found. 1 star = most. It carries the heaviest weight in the Overall CMS rating.
CMS Staffing star rating (1–5 stars), based on daily nurse staffing hours submitted to CMS via verified payroll data. Compares RN, LPN, and CNA coverage relative to resident acuity level. 5 stars = well above expected staffing. Weekend staffing is evaluated separately, as that's where many facilities quietly reduce coverage.
CMS Quality Measures star rating (1–5 stars), based on 15 clinical outcome metrics including fall rates, pressure ulcers, antipsychotic drug use, and hospital readmissions. Captures actual resident health outcomes, not just compliance. High QM combined with low Health Inspection scores can indicate a facility with strong care but weak documentation practices.
Registered Nurse hours per resident/day compared to the statewide average. RNs are the highest-skilled nursing staff — they assess residents, manage medications, and respond to emergencies. A value of +50% means RN coverage is 50% above the state norm. Negative values are a concern for residents with complex or acute medical needs.
Total nursing staff hours (RN + LPN + CNA combined) per resident/day vs. the statewide average. A broader measure than RN vs State — it captures the entire care team. A facility can have high total staffing but low RN hours, meaning more aides and fewer nurses. Read both columns together for the full picture.
Total dollar amount of federal monetary fines (civil money penalties) issued by CMS in the past 3 years. Fines are only levied for serious violations — typically actual harm to residents, repeated uncorrected deficiencies, or systemic non-compliance. Even a single fine is noteworthy. Multiple fines strongly suggest a pattern, not isolated incidents.
Total health deficiency citations from the most recent standard inspection cycle. Minor citations (scope A–C) are common and often administrative in nature. Higher counts aren't always disqualifying, but should be read alongside Severe Citations to understand actual harm levels. Under 10 is strong for a large facility; 30+ warrants a closer look.
Average deficiency citations per CMS inspection (survey) in the reporting window — total citations divided by the number of inspections. Lower is better; compare alongside total Citations and Severe Citations for context.
Citations at CMS scope/severity level G or higher — G–I means actual harm occurred; J–L means residents were placed in immediate jeopardy. (D–F is potential for harm only). Examples include unaddressed falls, medication errors causing injury, neglect, or abuse.
Average number of residents in the building on any given day, derived from annual census data. Reflects true operating scale — a 400-bed facility running 200 residents/day operates very differently from one at 390. Higher resident counts generally mean more funded staffing hours.
Better Business Bureau rating (A+ to F). Reflects complaint history, business transparency, and how family disputes were resolved. A+ means no significant unresolved complaints. A blank (—) means the facility isn't BBB-accredited, which is common for healthcare providers and not necessarily a negative signal.
Walk Score® (0–100). Measures walkability of the surrounding area. 90–100 = Walker's Paradise. 70–89 = Very Walkable. 50–69 = Somewhat Walkable. Below 50 = Car-Dependent. Higher scores benefit family visitors, resident outings, and staff commuting.
The licensed owner or operator of record filed with CMS — the individual or organization legally accountable for the facility. Searching the operator name across other facilities can reveal chain or multi-site ownership, which matters: chain-operated homes tend to have more variable quality outcomes than independently run facilities.
What the home actually collects for resident care, after contractual allowances, bad debt and discounts — not gross billings. Taken from the latest complete annual cost report, so it is comparable across homes reporting the same period. Revenue alone doesn't indicate care quality, but it funds staffing and capital reinvestment. Pair with Payroll %. Figures are from each facility's most recent complete fiscal year — hover a value for the exact year; a * marks homes that report an older period than most facilities.
Staff salaries plus wage-related benefits from the latest complete annual cost report. Contract and agency labour is counted separately, under other operating costs, so a home leaning on agency staff can show a low figure here. Payroll is the cost most directly tied to care quality — compare with Payroll % for full context. Figures are from each facility's most recent complete fiscal year — hover a value for the exact year; a * marks homes that report an older period than most facilities.
Payroll as a share of NET PATIENT REVENUE (not gross revenue). Both figures come from the same cost-report year. A higher figure means more of each revenue dollar goes to staff pay. Read with the Staffing star rating to judge whether spend translates into coverage — and note that homes whose patient revenue covers only part of their operation can read implausibly high. The Vermont average is: 41.8% Figures are from each facility's most recent complete fiscal year — hover a value for the exact year; a * marks homes that report an older period than most facilities.
CMS Certification Number: the unique federal identifier for this skilled nursing provider.
Birchwood Terrace Rehab and Healthcare
NH
HOS
MC
RC
SNF
Burlington (New North End)
160
Facility 160
VT AVG 109
Rank #1 / 13
81.3%
Facility 81.3%
VT AVG 77.2
Rank #8 / 11
+5%
3.96
Facility 3.96
VT AVG 4.27
Rank #3 / 11
-2%-7%
$127.8k
Facility $127.8k
VT AVG $151.3k
Rank #8 / 12
20
Facility 20
VT AVG 28.9
Rank #3 / 12
4.0
Facility 4.0
VT AVG 4.3
Rank #5 / 12
1130-
36
Facility 36
VT AVG 45
Rank #37 / 68
Alter Rubin
$17.9MFiscal year ending 12/2023
Facility $17.9MFiscal year ending 12/2023
VT AVG $16.9M
Rank #4 / 11
$8.4MFiscal year ending 12/2023
Facility $8.4MFiscal year ending 12/2023
VT AVG $7.3M
Rank #5 / 11
46.8%Fiscal year ending 12/2023
Facility 46.8%Fiscal year ending 12/2023
VT AVG 41.8%
Rank #5 / 11
475003
Elderwood at Burlington
NH
MC
PC
RC
SNF
Burlington (New North End)
150
Facility 150
VT AVG 109
Rank #3 / 13
53.3%
Facility 53.3%
VT AVG 77.2
Rank #10 / 11
-31%
3.88
Facility 3.88
VT AVG 4.27
Rank #4 / 11
+21%-9%
$221.0k
Facility $221.0k
VT AVG $151.3k
Rank #11 / 12
83
Facility 83
VT AVG 28.9
Rank #11 / 12
7.6
Facility 7.6
VT AVG 4.3
Rank #12 / 12
1580-
7
Facility 7
VT AVG 45
Rank #66 / 68
98 Starr Farm Road Operating Holdco LLC
$17.4MFiscal year ending 12/2023
Facility $17.4MFiscal year ending 12/2023
VT AVG $16.9M
Rank #5 / 11
$8.2MFiscal year ending 12/2023
Facility $8.2MFiscal year ending 12/2023
VT AVG $7.3M
Rank #6 / 11
46.9%Fiscal year ending 12/2023
Facility 46.9%Fiscal year ending 12/2023
VT AVG 41.8%
Rank #4 / 11
475030

Rank badges are statewide: each community is ranked against every VT community we track that reports that metric, not just the 4 analyzed for Burlington.

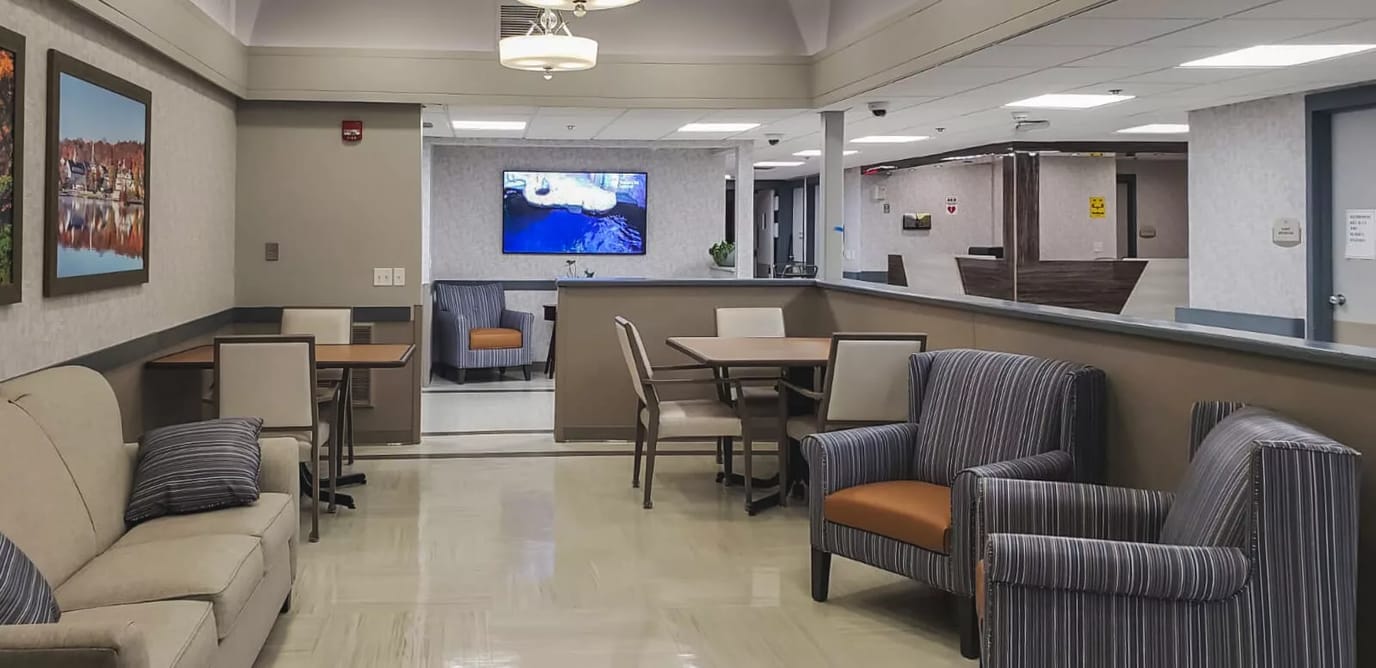
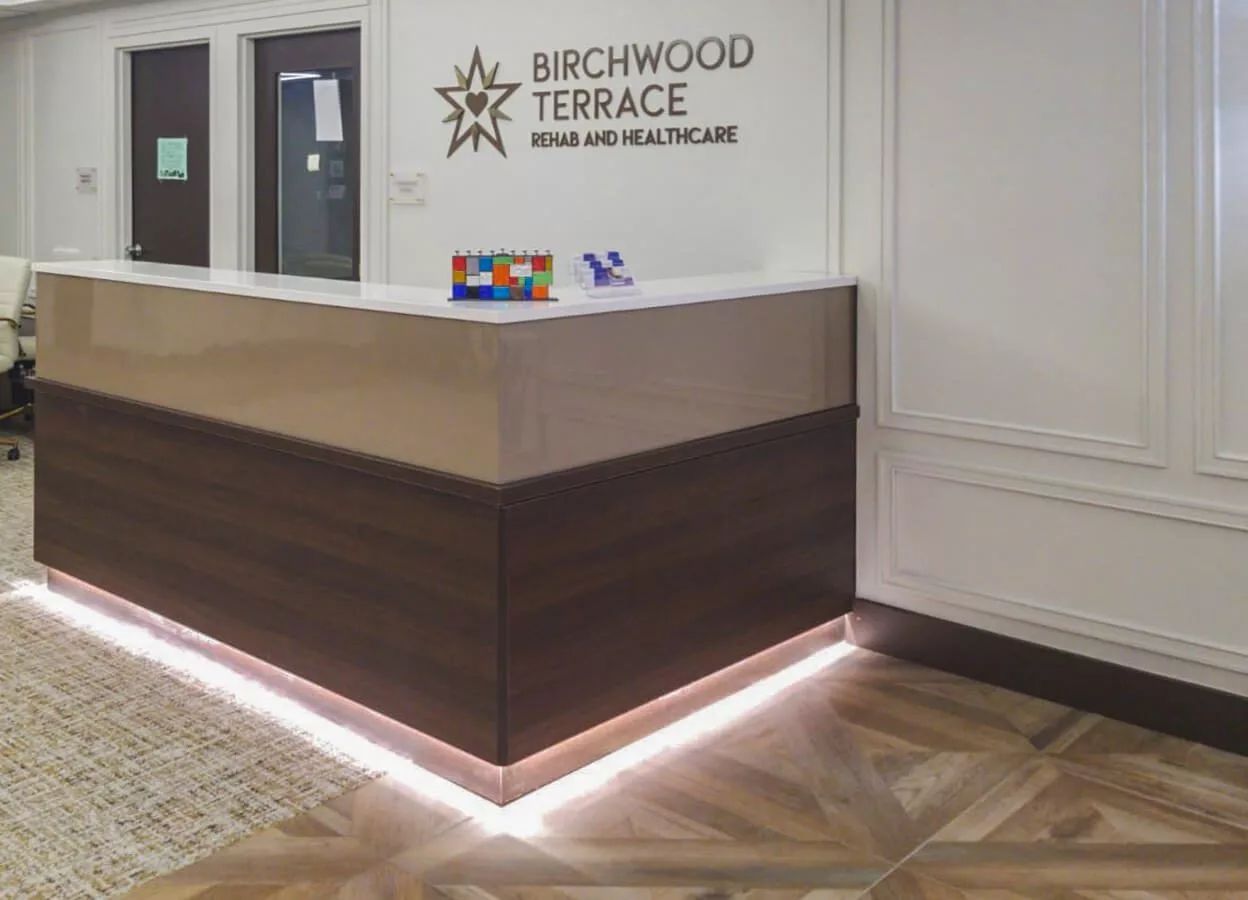
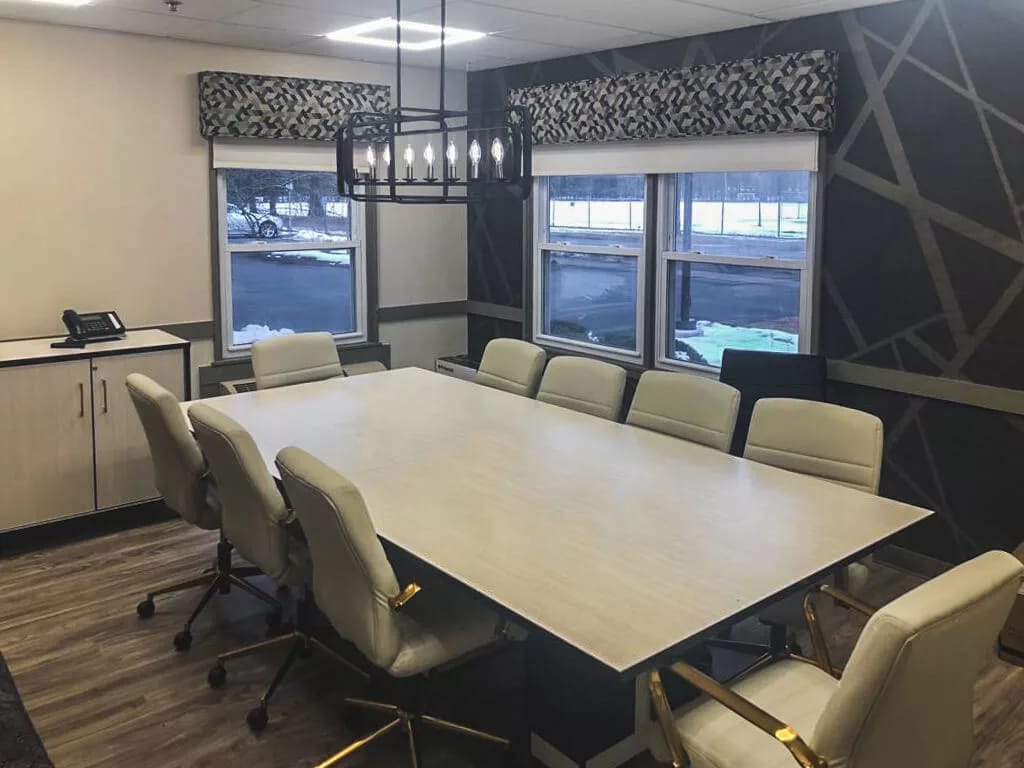
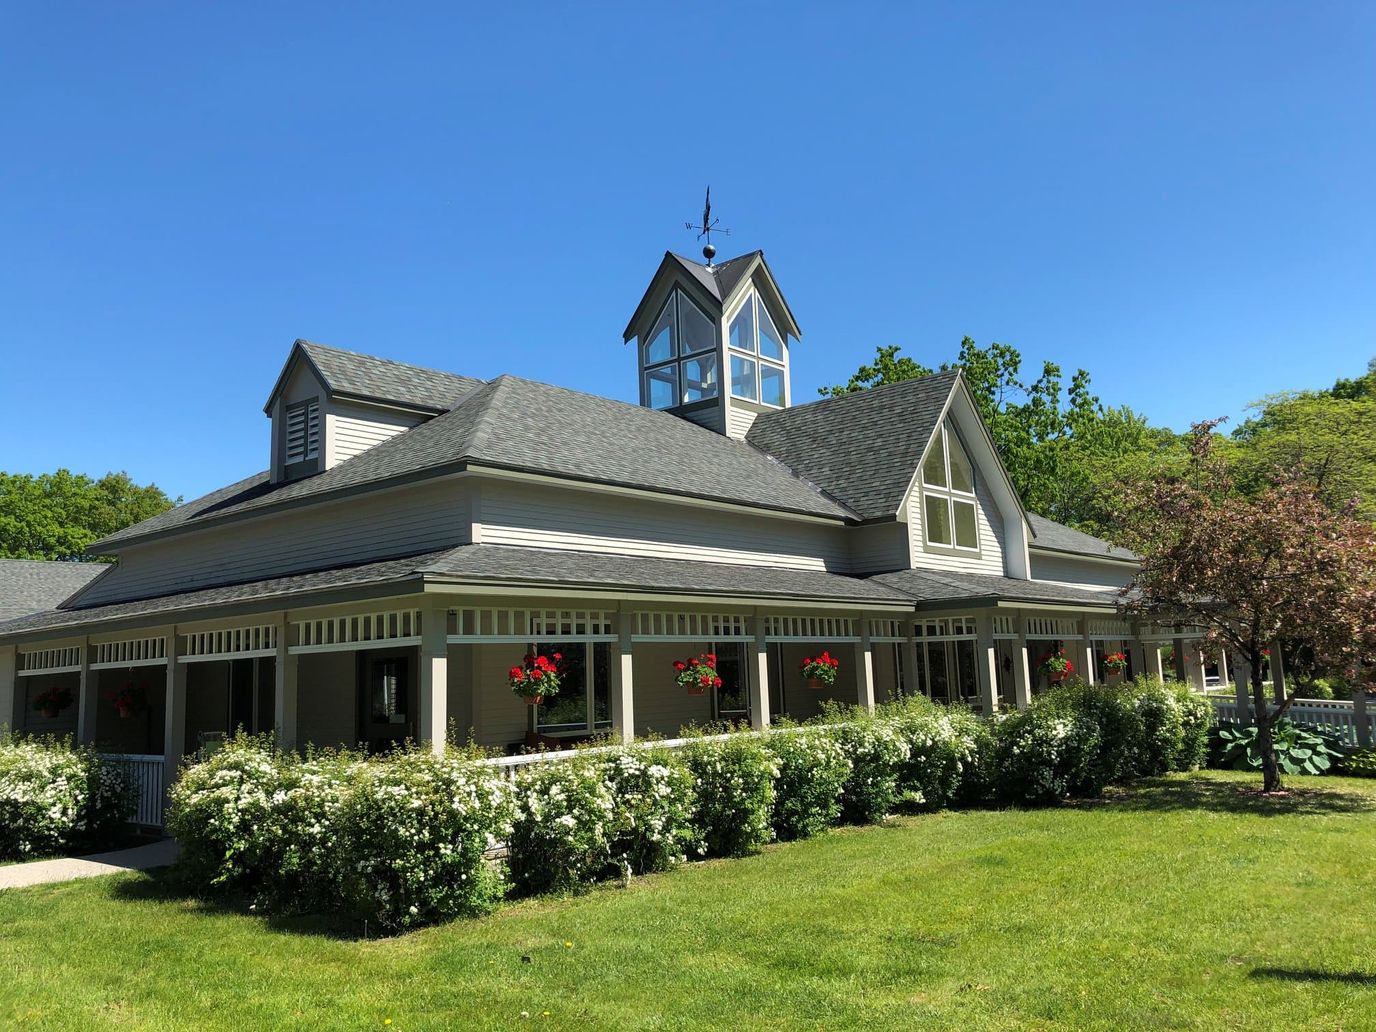
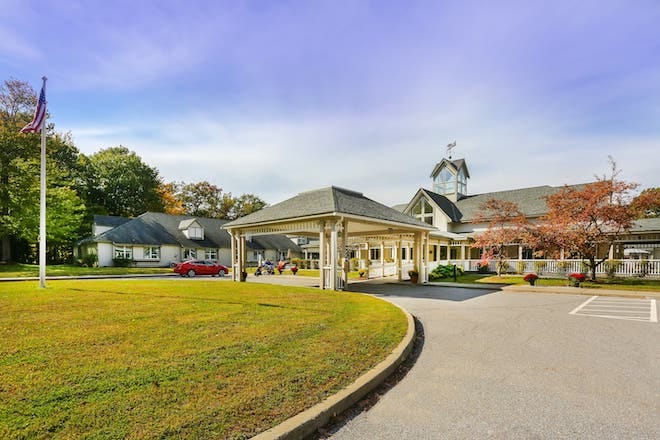
Overview of Birchwood Terrace Rehab and Healthcare

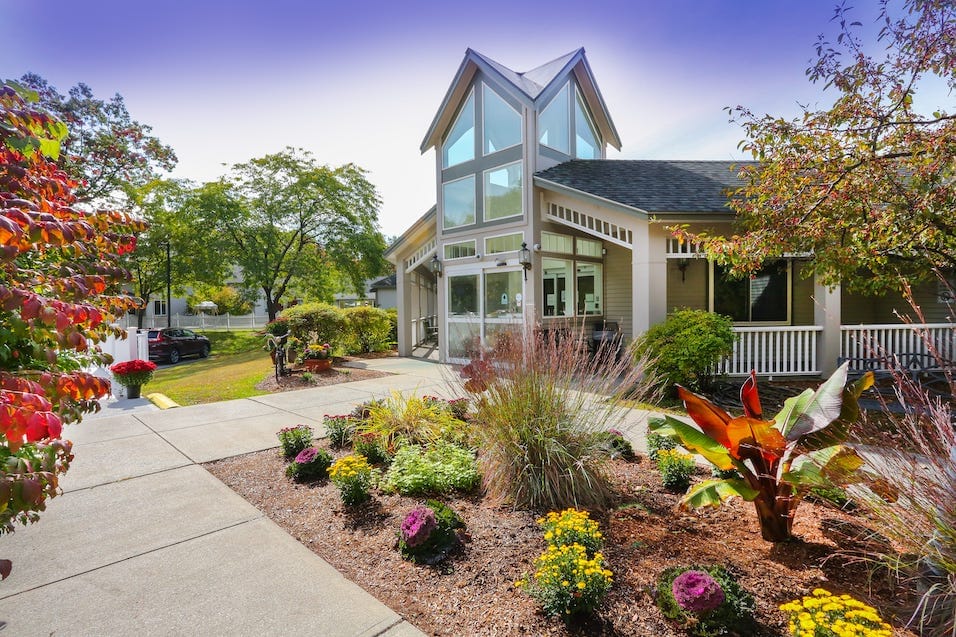
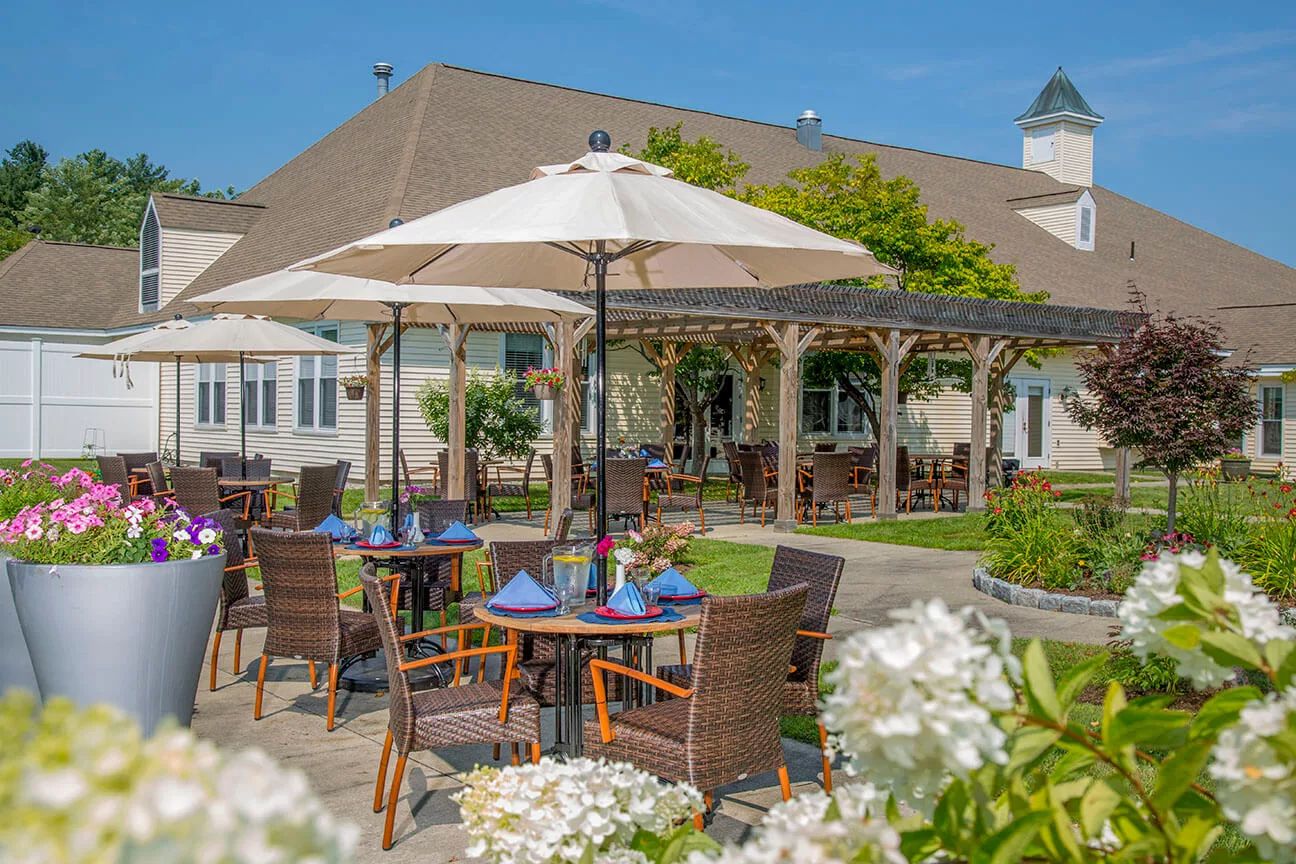
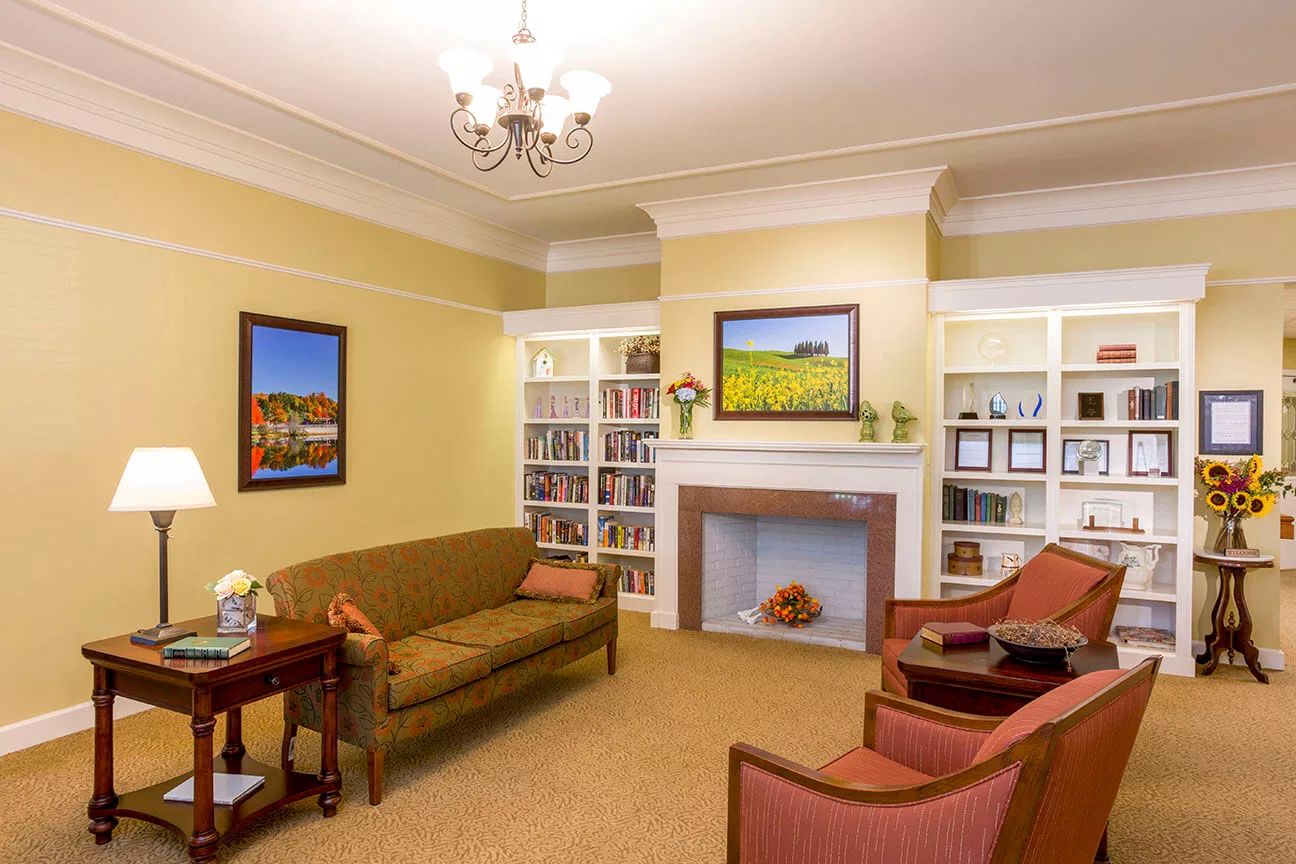
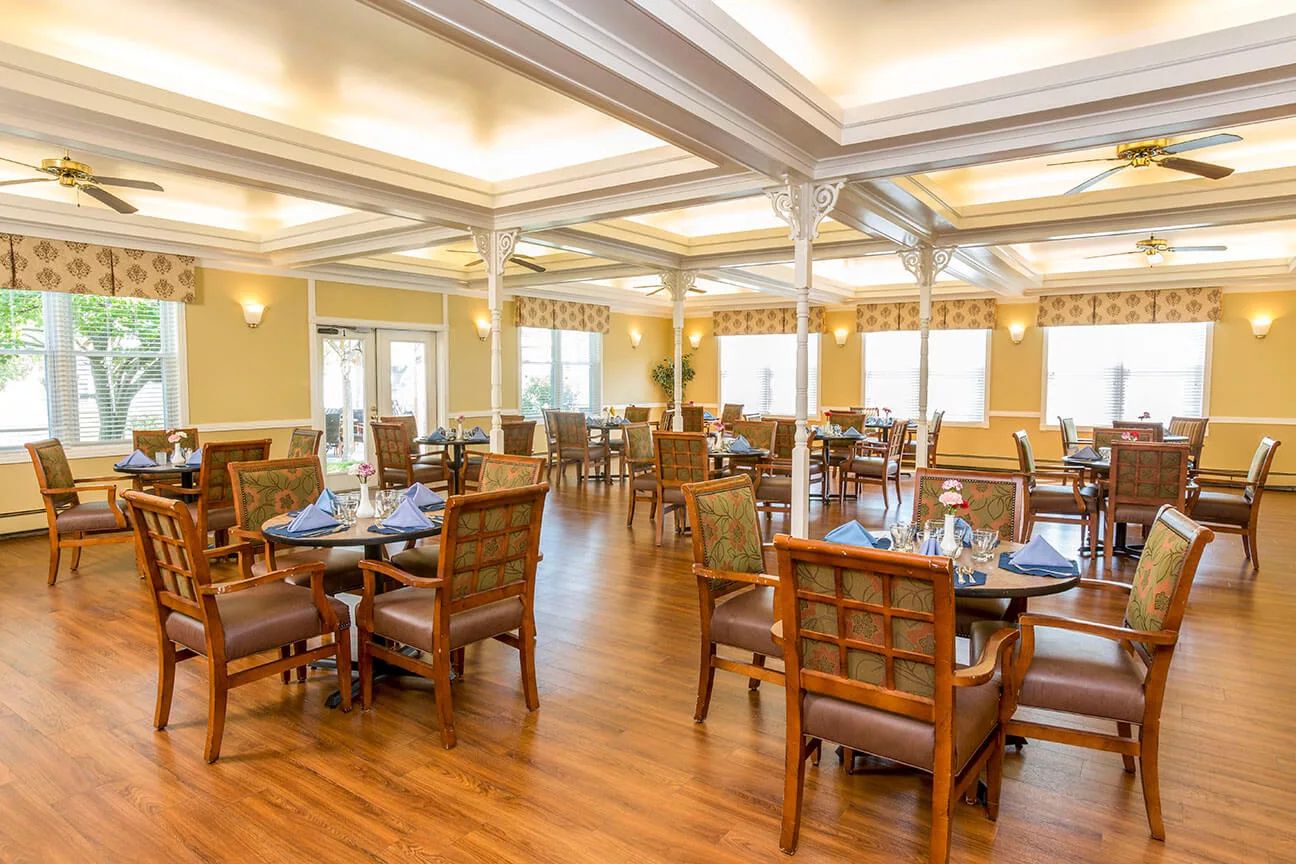
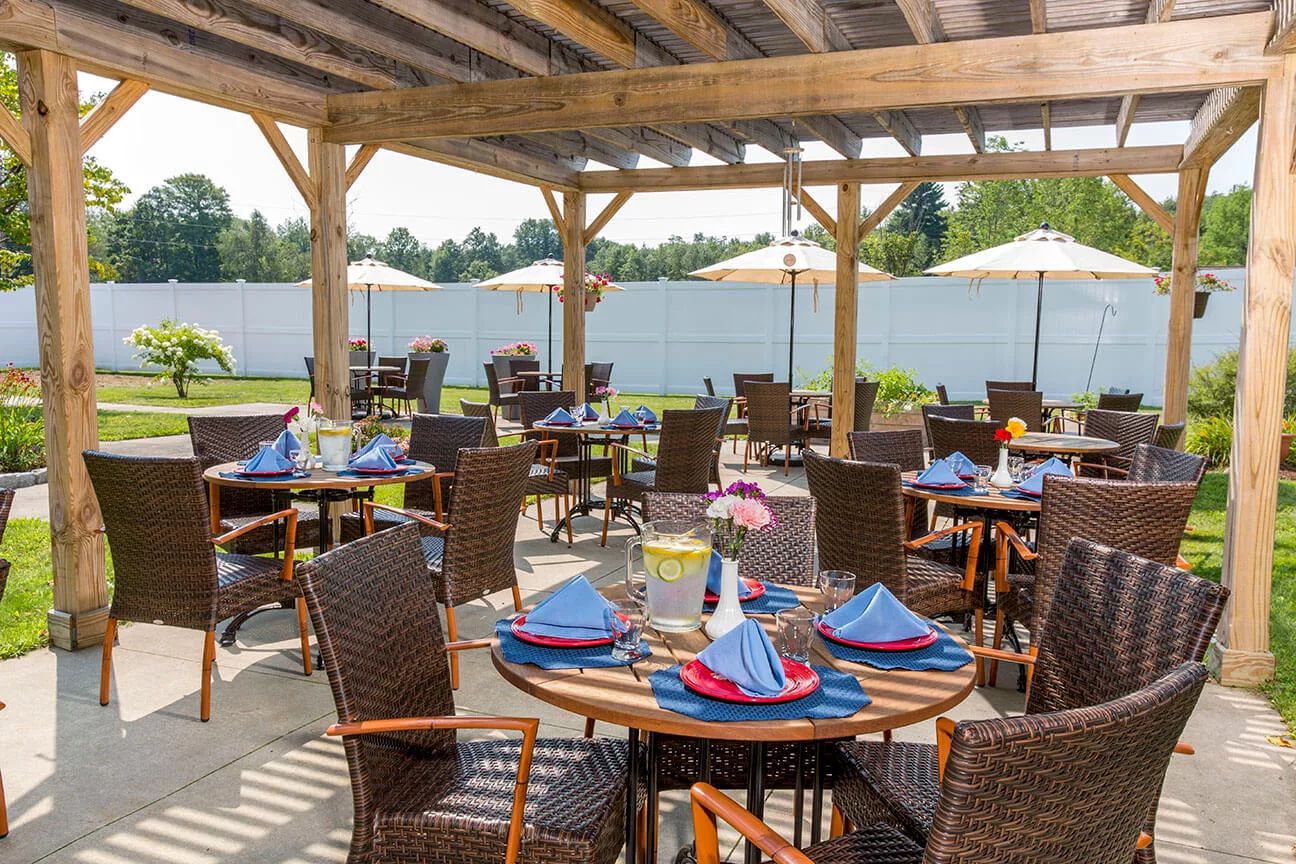
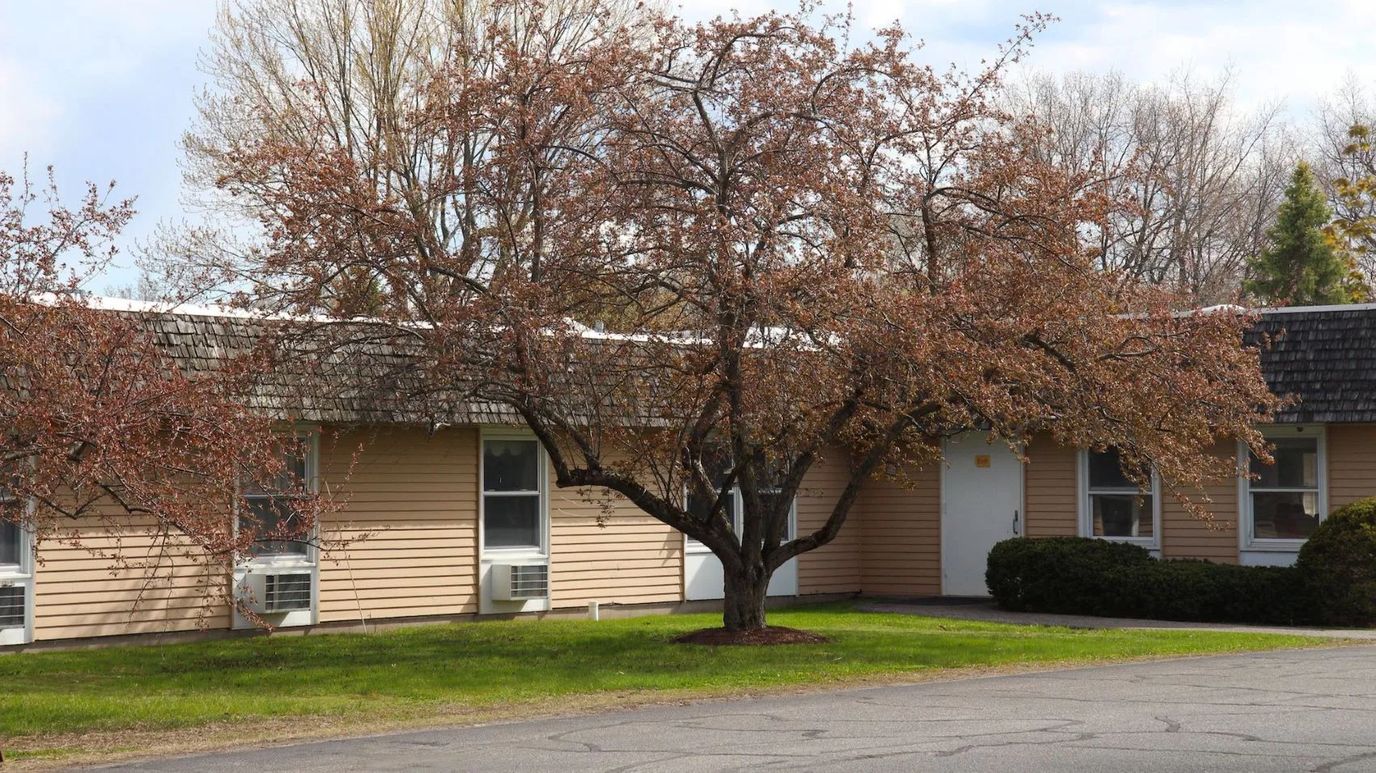
Burlington’s New North End is home to Birchwood Terrace Rehab and Healthcare, a 160-bed nursing home that also provides hospice care, memory care, and respite care. The Walk Score sits at 36, so residents’ families might reach a nearby pharmacy or coffee shop on foot, but most errands mean driving.

132 people call the facility’s 160 beds home. Ninety one days is the averagelength of stay. On the staffing side, residents get roughly four hours of total nursing care per day, split across RNs, LPNs, and nurse aides, plus a smaller daily allotment specifically from registered nursing staff.

Two resident-led groups operate here: an Active Resident Council and a Residents Group, both of which meet regularly to weigh in on facility policy, care quality, and the daily rhythm of activities. There’s also something a little less common: a state-approved Nurse Aide Training and Competency Evaluation Program that runs on-site.

Coverage-wise, Birchwood Terrace takes Medicare and private pay, so families have more than one route to financing care. When state inspectors visit facilities like this one, their attention tends to land on the operational basics: medication handling, infection control, staffing credentials, food service, environmental safety, and resident rights, rather than clinical care decisions themselves.

Birchwood Terrace Rehab is a 160-bed nursing home running hospice, memory care, and respite services in parallel, with resident councils built into its structure, organized around a wide range of needs.
Contact Birchwood Terrace Rehab and Healthcare

Overview of Elderwood at Burlington

Elderwood at Burlington is a trusted senior care community located in Burlington, Vermont. When it comes to providing exceptional care and support for older adults, Elderwood knows how to do it right. This community offers a range of services to meet the unique needs of each resident, including skilled nursing care, rehabilitation therapies, and specialized programs. The dedicated team of professionals at Elderwood is committed to ensuring the well-being and comfort of every individual in their care.
Elderwood at Burlington prides themselves on their commitment to personalized care. Each resident receives individualized attention and assistance based on their specific needs and preferences. Whether it’s helping with daily activities, providing specialized memory care, or offering rehabilitation services, Elderwood at Burlington is equipped to provide compassionate support and a nurturing environment. The community promotes engagement and social connection, with a variety of activities and programs available for residents to enjoy. From fitness classes to educational seminars, there’s always something exciting happening at Elderwood.

Contact Elderwood at Burlington

Overview of The Arbors of Shelburne

The Arbors of Shelburne is a residential care community serving Shelburne, Vermont’s older adults with independent living, assisted living, and memory care options. Located at 687 Harbor Rd in Chittenden County, the community sits less than a mile from the town center and is close to University of Vermont Health, about 5 miles away. The 29-year operational history reflects a sustained presence in the local community.
The community operates in a single-story building with studio apartment options designed for personalized living space. A staff available 24 hours a day supports residents’ daily needs, whether they are independent and seeking an active community or require assistance with activities of daily living or specialized memory care. Leadership includes Tom Grape, serving as Chairperson and Chief Executive Officer.
Residents enjoy chef-prepared meals and a calendar of coordinated social and recreational activities, giving each person opportunities to stay engaged and connected. The pet-friendly policy welcomes those who wish to bring a companion with them. The neighborhood, with a Walk Score of 28, means residents can reach some nearby services on foot, though most outings will require transportation.
For families exploring The Arbors of Shelburne, an in-person visit is the best way to tour the apartments, learn about the care services available for each level of need, view the daily activity programming, and discuss pricing and payment options.

Contact The Arbors of Shelburne

Overview of Starr Farm Nursing Center

Starr Farm Nursing Center is another jewel in the pride of Burlington, Vermont. The center offers an array of therapies and personalized care services designed to empower residents on their journey to reclaim their freedom. With a team of skilled nurses, licensed care professionals, and dedicated therapists, the concept of senior living is elevated through exceptional medical support.

The importance of bridging the gap between hospital care and the comfort of home is understood. The short-term rehabilitation programs are carefully tailored to ensure a seamless transition, assisting residents in regaining their strength and independence. Whether recovering from an illness, injury, or surgery, the compassionate team is there every step of the way, providing comprehensive support. For those seeking long-term care, the community offers a haven of safety and tranquility. Within the secure environment, residents can embrace their golden years with confidence and peace of mind. Additionally, a range of senior living house plans is available to suit individual preferences and needs, ensuring that residents find the perfect place to call home.

Contact Starr Farm Nursing Center

Ranking Methodology

How we rank these nursing homes

Every nursing home above is evaluated across five weighted categories using CMS data including Care Compare, Payroll-Based Journal, and Medicare Cost Reports.

  • CMS data
  • 5 weighted categories
  • Updated quarterly
Full methodology

Weighting overview

  • 35%
    Care Quality
  • 20%
    Staffing
  • 20%
    Regulatory
  • 20%
    Operational
  • 5%
    Environment
01

Care Quality 35%

The largest single share of every ranking. CMS star ratings and quality measures that reflect actual care delivered to residents.

  • Includes
  • Overall Rating
  • Health Inspection
  • QM Rating
  • Long-Stay QM
  • Short-Stay QM
02

Staffing Adequacy 20%

The strongest predictor of resident outcomes. Volume and stability of nursing care, drawn from CMS Payroll-Based Journal.

  • Includes
  • Nurse Hrs/Res/Day
  • RN vs State
  • Total Nurse Staff Hrs vs State
  • RN Turnover
03

Regulatory & Safety Record 20%

Inspection patterns that star ratings can mask. We weight per-inspection rates more heavily than raw counts.

  • Includes
  • Citations
  • Citations/Inspection
  • Severe Citations
  • Fines
  • Accreditations
04

Operational & Financial Stability 20%

Stable operations and sound finances are leading indicators of consistent care over time.

  • Includes
  • Occupancy vs State
  • Avg Length of Stay
  • Revenue
  • Payroll %
  • Years in Operation
  • Admin Tenure
05

Environment & Accessibility 5%

Context that matters to families but doesn't directly measure clinical care. Weighted lower for nursing homes than for assisted or independent living.

  • Includes
  • Walk Score
  • BBB Rating
No paid rankings Facilities cannot pay to influence placement.
How we're paid: If we help you find a home and you move in, that home may pay us a referral fee. This never affects where they rank or what you pay. Learn more
Submit a correction
Who we are

Your Senior Care Partner, Every Step of the Way

We help families find affordable senior communities and unlock same day discounts, Medicaid, and Medicare options tailored to your needs.

Contact us Today

Frequently Asked Questions about Nursing Homes in Burlington, VT

What's the difference between assisted living and a nursing home in Vermont?

Assisted living in Vermont is a residential model focused on housing, hospitality, and help with daily activities. Nursing homes (skilled nursing facilities) provide 24/7 medical care from licensed nurses for residents with significant health needs, and are regulated more strictly under both state and federal CMS rules.

Does Vermont Medicaid cover nursing home care?

Yes — Vermont Medicaid covers nursing home care for residents who meet income, asset, and medical-need eligibility requirements. Most CMS-certified nursing homes accept Medicaid as a primary payer once long-term-care eligibility is established.

What is nursing home care?

Nursing homes (also called skilled nursing facilities) provide 24/7 medical care from licensed nurses, rehabilitation services, and long-term custodial care for residents with significant health or functional needs.

How many nursing homes are listed on this page?

This page features 4 nursing homes in Burlington, VT. Use the filters and comparison tools above to compare ratings, amenities, and pricing.

How do I choose the right nursing home in Burlington, VT?

Start by matching the level of care offered to the resident's current and anticipated needs, then compare licensing status, staff-to-resident ratios, recent inspection results, and pricing. Tour at least two or three communities in Burlington, VT, talk to current residents and families, and confirm what is included in the base rate versus billed as add-on services.

What should I look for when visiting nursing homes in Burlington, VT?

Pay attention to staff interactions with residents, cleanliness and odor, food quality at meal times, the activity calendar, and how questions about pricing and care plans are answered. Ask to see the most recent state inspection report, the move-out / level-of-care-change policy, and a sample monthly bill that lists every fee.