


Total health inspections
5
Vermont average 6.5
Last Health inspection on Dec 2024
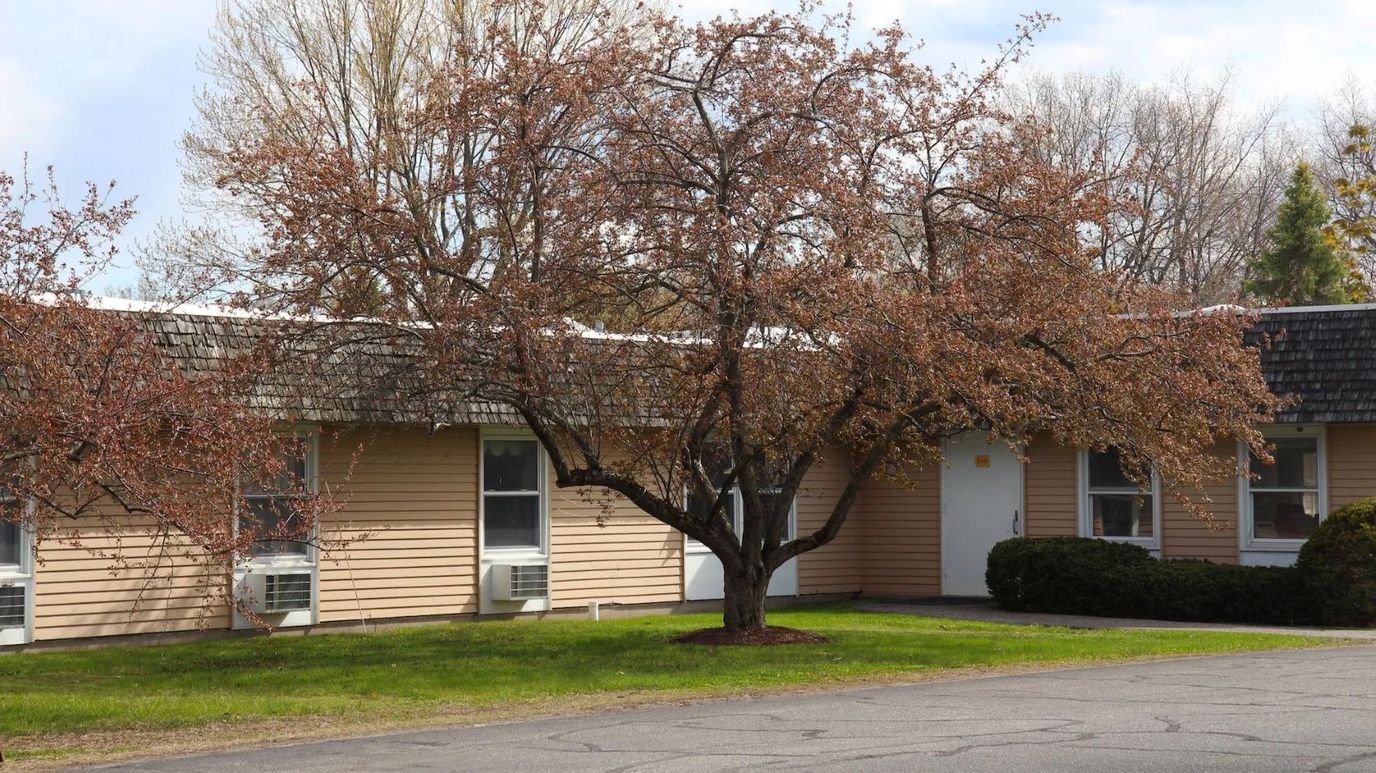
Burlington’s New North End is home to Birchwood Terrace Rehab and Healthcare, a 160-bed nursing home that also provides hospice care, memory care, and respite care. The Walk Score sits at 36, so residents’ families might reach a nearby pharmacy or coffee shop on foot, but most errands mean driving.
132 people call the facility’s 160 beds home. Ninety one days is the averagelength of stay. On the staffing side, residents get roughly four hours of total nursing care per day, split across RNs, LPNs, and nurse aides, plus a smaller daily allotment specifically from registered nursing staff.
Two resident-led groups operate here: an Active Resident Council and a Residents Group, both of which meet regularly to weigh in on facility policy, care quality, and the daily rhythm of activities. There’s also something a little less common: a state-approved Nurse Aide Training and Competency Evaluation Program that runs on-site.
Coverage-wise, Birchwood Terrace takes Medicare and private pay, so families have more than one route to financing care. When state inspectors visit facilities like this one, their attention tends to land on the operational basics: medication handling, infection control, staffing credentials, food service, environmental safety, and resident rights, rather than clinical care decisions themselves.
Birchwood Terrace Rehab is a 160-bed nursing home running hospice, memory care, and respite services in parallel, with resident councils built into its structure, organized around a wide range of needs.
| Staff type | Hours / Day / Resident | vs state avg |
|---|---|---|
|
Registered Nurse (RN)
| 23m per day | ▼ 52% State avg: 49m per day · National avg: 41m per day |
|
LPN / LVN
| 1h 13m per day | ▲ 38% State avg: 53m per day · National avg: 52m per day |
|
Nurse Aide
| 2h 6m per day | ▼ 19% State avg: 2h 35m per day · National avg: 2h 21m per day |
|
Weekend Total Nursing
| 3h 10m per day | ▼ 14% State avg: 3h 41m per day · National avg: 3h 26m per day |
|
Physical Therapist
| 7m per day | ▲ 10% State avg: 6m per day · National avg: 4m per day |
|
Weekend RN
| 9m per day | ▼ 71% State avg: 32m per day · National avg: 29m per day |
In Vermont, the Department of Disabilities, Aging and Independent Living is the authority responsible for inspecting facilities and investigating complaints to protect resident well-being.
Deficiencies
| This Facility | VT Average | vs. VT Avg |
|---|---|---|---|
|
Total deficiencies
| 21 | 41 | This facility has 49% fewer total deficiencies than a typical Vermont nursing home (21 vs. VT avg 41).↓ 49% better |
Vermont average 6.5
Last Health inspection on Dec 2024
Vermont average 28.9
Vermont average 4.31
Health citations are formal notices following inspections when they fail to comply with safety and care standards.
17 of 20 citations resulted from standard inspections; and 3 of 20 resulted from complaint investigations.
Vermont average: 0.7
Vermont average: 1.9
Reporting period: October 1 – December 31, 2025 (Q4 2025). Source: CMS Payroll-Based Journal report.
Manages medical care and health needs.
Assists with medical care and medications.
Helps with daily care and mobility.
Total hours from contractors
12,110 contractor hours this quarter
| Certified Nursing Assistant | 51 | 7 | 58 | 26,480 | 92 | 100% | 10 |
| Licensed Practical Nurse | 19 | 20 | 39 | 15,364 | 92 | 100% | 8.6 |
| Registered Nurse | 15 | 2 | 17 | 4,484 | 92 | 100% | 7.7 |
| Occupational Therapy Aide | 9 | 0 | 9 | 3,902 | 92 | 100% | 8.4 |
| Other Dietary Services Staff | 6 | 0 | 6 | 1,863 | 84 | 91% | 7.3 |
| Respiratory Therapy Technician | 2 | 2 | 4 | 1,396 | 72 | 78% | 7.6 |
| Physical Therapy Assistant | 3 | 0 | 3 | 1,251 | 80 | 87% | 7.1 |
| Dental Services Staff | 2 | 0 | 2 | 1,077 | 75 | 82% | 8.8 |
| Qualified Social Worker | 3 | 1 | 4 | 904 | 67 | 73% | 7.3 |
| Speech Language Pathologist | 2 | 0 | 2 | 505 | 62 | 67% | 7.7 |
| Administrator | 1 | 0 | 1 | 504 | 63 | 68% | 8 |
| Nurse Practitioner | 1 | 0 | 1 | 424 | 53 | 58% | 8 |
| Medical Director | 0 | 1 | 1 | 83 | 63 | 68% | 1.3 |
| Qualified Activities Professional | 1 | 0 | 1 | 55 | 26 | 28% | 2.1 |
Includes penalties issued in 2024
Federal penalties imposed by CMS for regulatory violations, including civil money penalties (fines) and denials of payment for new Medicare/Medicaid admissions.
Source: CMS Penalties Database (Data as of Jan 2026)
Vermont average: $128K
Vermont average: 1.8
Vermont average: 0.5
Penalties are imposed by CMS for violations of federal nursing home regulations.
1 penalty in the past 3 years
Sep 3, 2024 · $128K
Last updated: Jan 2026
These measures show how residents usually do over time at this home, based on health outcomes and preventive care.
Vermont average: 11.6
Vermont average: 22.7
Vermont average: 20.4%
Vermont average: 20.1%
Vermont average: 27.6%
Vermont average: 5.8%
Vermont average: 6.4%
Vermont average: 2.5%
Vermont average: 5.5%
Vermont average: 10.0%
Vermont average: 19.4%
Vermont average: 95.6%
Vermont average: 97.6%
Vermont average: 1.44
Vermont average: 2.48
Vermont average: 86.3%
Vermont average: 1.7%
Vermont average: 78.9%
Vermont average: 21.5%
Vermont average: 17.6%
Vermont average: 0.8%
Vermont average: 53.7%
Vermont average: 50.6%
Quality measures are calculated from Minimum Data Set (MDS) assessments. For most measures, lower percentages indicate better care quality.
62% of new residents, usually for short-term rehab.
38% of new residents, often for short stays.
Source: CMS Long-Term Care Facility Characteristics (Data as of Jan 2026)
Residents meet regularly to discuss policies, care quality, and activities
State-approved Nurse Aide Training and Competency Evaluation Program on-site
Organized group of residents that meets regularly to discuss facility policies, quality of life, and activities.
Data sourced from CMS Long-Term Care Facility Characteristics quarterly report. Payer mix reflects the current resident census by primary payment source.
Historical financial and operational data for Birchwood Terrace Rehab and Healthcare from 2012–2023, based on CMS SNF Cost Reports.
Key figures below are for fiscal year ending in 12/2023.
Based on CMS SNF Cost Report for fiscal year ending in 12/2023.
Most residents typically stay for a few weeks or months before returning home or moving on.
Most new residents arrive under Medicare (62% of admissions), and a typical Medicare stay runs around 22 days.
Coverage residents most often arrive under.
Coverage residents most often leave under.
![]() 3.6 miles from city center
3.6 miles from city center
![]() Estimated distance in miles from Burlington's city center to Birchwood Terrace Rehab and Healthcare's address, calculated via Google Maps.
Estimated distance in miles from Burlington's city center to Birchwood Terrace Rehab and Healthcare's address, calculated via Google Maps.
Add your location
Info below is compiled from CMS reports & the VT Dept. of Disabilities, Aging & Independent Living (DAIL), senior community websites & trusted data sources such as Walk Score & BBB.
Communities are listed from highest to lowest based on our ranking methodology.
| Birchwood Terrace Rehab and Healthcare | NH HOS MC RC SNF | Burlington (New North End) | 160
Facility
160
VT AVG
109
Rank
#1 / 13 |
81.3%
Facility
81.3%
VT AVG
76.7
Rank
#7 / 11 | +6% | 4.06
Facility
4.06
VT AVG
4.27
Rank
#3 / 12 | -2% | -5% | $127.8k
Facility
$127.8k
VT AVG
$151.3k
Rank
#8 / 12 | 20
Facility
20
VT AVG
28.9
Rank
#3 / 12 | 4.0
Facility
4.0
VT AVG
4.3
Rank
#5 / 12 | 1 | 130 | - |
36
Facility
36
VT AVG
44
Rank
#37 / 70 | Alter Rubin | $17.9MFiscal year ending 12/2023
Facility
$17.9MFiscal year ending 12/2023
VT AVG
$12.1M
Rank
#7 / 11 | $8.4MFiscal year ending 12/2023
Facility
$8.4MFiscal year ending 12/2023
VT AVG
$4.4M
Rank
#7 / 11 | 46.8%Fiscal year ending 12/2023
Facility
46.8%Fiscal year ending 12/2023
VT AVG
38%
Rank
#5 / 11 | 475003 | ||||
| Elderwood at Burlington | NH MC PC RC SNF | Burlington (New North End) | 150
Facility
150
VT AVG
109
Rank
#3 / 13 |
53.3%
Facility
53.3%
VT AVG
76.7
Rank
#10 / 11 | -30% | 3.71
Facility
3.71
VT AVG
4.27
Rank
#7 / 12 | +21% | -13% | $221.0k
Facility
$221.0k
VT AVG
$151.3k
Rank
#11 / 12 | 83
Facility
83
VT AVG
28.9
Rank
#11 / 12 | 7.6
Facility
7.6
VT AVG
4.3
Rank
#12 / 12 | 15 | 80 | - |
7
Facility
7
VT AVG
44
Rank
#66 / 70 | 98 Starr Farm Road Operating Holdco LLC | $17.4MFiscal year ending 12/2023
Facility
$17.4MFiscal year ending 12/2023
VT AVG
$12.1M
Rank
#5 / 11 | $8.2MFiscal year ending 12/2023
Facility
$8.2MFiscal year ending 12/2023
VT AVG
$4.4M
Rank
#2 / 11 | 46.9%Fiscal year ending 12/2023
Facility
46.9%Fiscal year ending 12/2023
VT AVG
38%
Rank
#3 / 11 | 475030 |
Birchwood Terrace Rehab and Healthcare is located in Burlington, Vermont.
Here are the financial assistance programs available to residents in Vermont.
Birchwood Terrace Rehab and Healthcare is in the New North End neighborhood of Burlington.
Birchwood Terrace Rehab and Healthcare has a walk score of 36. Somewhat walkable. A few nearby services may be reachable on foot, but most trips require transportation.
Birchwood Terrace Rehab and Healthcare's occupancy is 86.8%.
No, Birchwood Terrace Rehab and Healthcare has a no-pet policy.
Birchwood Terrace Rehab and Healthcare is registered as a for-profit in VT.
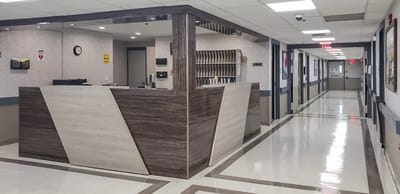
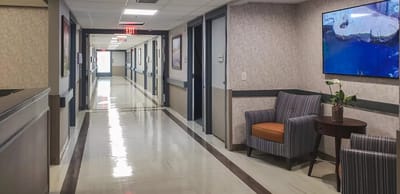
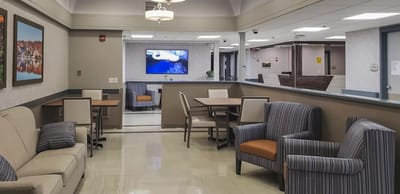
Yes — there are 6 photos of Birchwood Terrace Rehab and Healthcare in the photo gallery on this page.
Birchwood Terrace Rehab and Healthcare is located at 43 Starr Farm Rd, Burlington, VT 05408.
Care Cost Calculator: See Prices in Your Area
Nursing Home Data Explorer
Don’t Wait Too Long: 7 Red Flag Signs Your Parent Needs Assisted Living Now
The True Cost of Assisted Living in 2025 – And How Families Are Paying For It
Understanding Senior Living Costs: Pricing Models, Discounts & Financial Assistance


