Page 4 of Best Senior Care in Maryland

Why trust this guide? Our editorial team analyzed 997 senior care communities in MD using MD Dept. of Health (OHCQ) data, inspection records, complaints, amenities, and facility-level details. How we rank senior care in MD
Reviewed by
Last updated
Jul 2026
We analyzed
997 homes
Avg Walk Score: 43/ 100The average Walk Score across facilities in Maryland. A third-party neighborhood walkability score (0–100) measuring convenience and context, not healthcare quality. Individual facilities can vary widely from this average.
National Average: 50/ 100
Avg No. of Beds: 42The average licensed bed capacity across facilities in Maryland. Individual facilities can vary widely from this average.
National Average: 90

Compare Senior Care around Maryland

Info below is compiled from the MD Dept. of Health (OHCQ), senior community websites & trusted data sources such as Walk Score & BBB.

Communities are listed from highest to lowest based on our ranking methodology.

Bedford Court, a CCRC
SC
AL
HOS
IL
MC
NH
RC
SNF
Silver Spring (International Drive)
76
Facility 76
MD AVG 42
Rank #174 / 685
Yes
64
Facility 64
MD AVG 43
Rank #261 / 985
Studio / 1 Bed
34
Facility 34
MD AVG 21
Rank #22 / 210
-
15%

Male Residents — State Benchmarked 15% of residents are male, compared to the Maryland average of 31%. This facility caters to a majority female resident pool (85% female), consistent with the broader assisted living trend where women significantly outnumber men.

85%

Female Residents — State Benchmarked 85% of residents are female, compared to the Maryland average of 69%. Women comprise the large majority, consistent with national assisted living demographics where women live longer and enter care facilities at higher rates.

95%

White Residents — State Benchmarked 95% of residents are reported as White, compared to the Maryland average of 81%. A higher White share than is typical for assisted living in Maryland in this dataset — compare with peer facilities for local context.

3%

African American Residents — State Benchmarked 3% of residents are reported as African American or Black, compared to the Maryland average of 13%. A lower African American share than is typical in Maryland; local markets still vary widely.

2%

Other Ethnicity Residents — State Benchmarked 2% of residents fall into categories other than White or African American (combined), compared to the Maryland average of 6%. This column aggregates Hispanic, Asian, multiracial, and any other labeled groups that are not classified as White or African American. Reported subgroups in this total: Asian (2%).

2%

Residents Age 65–74 — State Benchmarked 2% of residents are 65–74, compared to the Maryland average of 13%. Fewer younger seniors suggests the resident population skews older, likely requiring higher acuity care and more hands-on support.

8%

Residents Age 75–84 — State Benchmarked 8% of residents are 75–84, compared to the Maryland average of 31%. Below the state norm — the resident mix may skew either younger or older than this typical middle bracket.

65%

Residents Age 85–94 — State Benchmarked 65% of residents are 85–94, compared to the Maryland average of 44%. A high concentration of very elderly residents signals a higher-acuity facility with experience caring for advanced age-related needs.

26%

Residents Age 95+ — State Benchmarked 26% of residents are 95 or older, compared to the Maryland average of 16%. A high proportion of the oldest-old suggests strong end-of-life care experience and very-high-acuity capabilities.

Edenwald Senior Living
SC
AL
IL
MC
NH
SNF
Towson (Southerly Road)
94
Facility 94
MD AVG 42
Rank #139 / 685
No
83
Facility 83
MD AVG 43
Rank #70 / 985
1 Bed / 2 Bed-A+
18%

Male Residents — State Benchmarked 18% of residents are male, compared to the Maryland average of 31%. This facility caters to a majority female resident pool (82% female), consistent with the broader assisted living trend where women significantly outnumber men.

82%

Female Residents — State Benchmarked 82% of residents are female, compared to the Maryland average of 69%. Women comprise the large majority, consistent with national assisted living demographics where women live longer and enter care facilities at higher rates.

100%

White Residents — State Benchmarked 100% of residents are reported as White, compared to the Maryland average of 81%. A higher White share than is typical for assisted living in Maryland in this dataset — compare with peer facilities for local context.

0%

African American Residents — State Benchmarked 0% of residents are reported as African American or Black, compared to the Maryland average of 13%. A lower African American share than is typical in Maryland; local markets still vary widely.

0%

Other Ethnicity Residents — State Benchmarked 0% of residents fall into categories other than White or African American (combined), compared to the Maryland average of 6%. This column aggregates Hispanic, Asian, multiracial, and any other labeled groups that are not classified as White or African American.

-
13%

Residents Age 75–84 — State Benchmarked 13% of residents are 75–84, compared to the Maryland average of 31%. Below the state norm — the resident mix may skew either younger or older than this typical middle bracket.

53%

Residents Age 85–94 — State Benchmarked 53% of residents are 85–94, compared to the Maryland average of 44%. A high concentration of very elderly residents signals a higher-acuity facility with experience caring for advanced age-related needs.

35%

Residents Age 95+ — State Benchmarked 35% of residents are 95 or older, compared to the Maryland average of 16%. A high proportion of the oldest-old suggests strong end-of-life care experience and very-high-acuity capabilities.

Lutheran Village at Miller’s Grant
SC
AL
IL
NH
SNF
Ellicott City (Lutheran Village At Miller’s Grant)
36
Facility 36
MD AVG 42
Rank #230 / 685
Yes
19
Facility 19
MD AVG 43
Rank #746 / 985
1 Bed / 2 Bed
21
Facility 21
MD AVG 21
Rank #108 / 210
-
17%

Male Residents — State Benchmarked 17% of residents are male, compared to the Maryland average of 31%. This facility caters to a majority female resident pool (83% female), consistent with the broader assisted living trend where women significantly outnumber men.

83%

Female Residents — State Benchmarked 83% of residents are female, compared to the Maryland average of 69%. Women comprise the large majority, consistent with national assisted living demographics where women live longer and enter care facilities at higher rates.

83%

White Residents — State Benchmarked 83% of residents are reported as White, compared to the Maryland average of 81%. Close to the average for this category among assisted living facilities in Maryland with reported race/ethnicity data.

11%

African American Residents — State Benchmarked 11% of residents are reported as African American or Black, compared to the Maryland average of 13%. In line with the Maryland average for African American residents among facilities reporting this breakdown.

6%

Other Ethnicity Residents — State Benchmarked 6% of residents fall into categories other than White or African American (combined), compared to the Maryland average of 6%. This column aggregates Hispanic, Asian, multiracial, and any other labeled groups that are not classified as White or African American. Reported subgroups in this total: Asian (6%).

-
33%

Residents Age 75–84 — State Benchmarked 33% of residents are 75–84, compared to the Maryland average of 31%. This is the second most common age bracket in assisted living, representing residents with moderate care needs.

44%

Residents Age 85–94 — State Benchmarked 44% of residents are 85–94, compared to the Maryland average of 44%. This is typically the most common age bracket in assisted living — this facility is in line with the statewide norm.

22%

Residents Age 95+ — State Benchmarked 22% of residents are 95 or older, compared to the Maryland average of 16%. A high proportion of the oldest-old suggests strong end-of-life care experience and very-high-acuity capabilities.

Friends House Retirement Community
SC
AL
IL
NH
SNF
Sandy Spring
24
Facility 24
MD AVG 42
Rank #242 / 685
Yes
6
Facility 6
MD AVG 43
Rank #891 / 985
-
20
Facility 20
MD AVG 21
Rank #112 / 210
-
6%

Male Residents — State Benchmarked 6% of residents are male, compared to the Maryland average of 31%. This facility caters to a majority female resident pool (94% female), consistent with the broader assisted living trend where women significantly outnumber men.

94%

Female Residents — State Benchmarked 94% of residents are female, compared to the Maryland average of 69%. Women comprise the large majority, consistent with national assisted living demographics where women live longer and enter care facilities at higher rates.

94%

White Residents — State Benchmarked 94% of residents are reported as White, compared to the Maryland average of 81%. A higher White share than is typical for assisted living in Maryland in this dataset — compare with peer facilities for local context.

0%

African American Residents — State Benchmarked 0% of residents are reported as African American or Black, compared to the Maryland average of 13%. A lower African American share than is typical in Maryland; local markets still vary widely.

6%

Other Ethnicity Residents — State Benchmarked 6% of residents fall into categories other than White or African American (combined), compared to the Maryland average of 6%. This column aggregates Hispanic, Asian, multiracial, and any other labeled groups that are not classified as White or African American. Reported subgroups in this total: Asian (6%).

6%

Residents Age 65–74 — State Benchmarked 6% of residents are 65–74, compared to the Maryland average of 13%. Fewer younger seniors suggests the resident population skews older, likely requiring higher acuity care and more hands-on support.

18%

Residents Age 75–84 — State Benchmarked 18% of residents are 75–84, compared to the Maryland average of 31%. Below the state norm — the resident mix may skew either younger or older than this typical middle bracket.

53%

Residents Age 85–94 — State Benchmarked 53% of residents are 85–94, compared to the Maryland average of 44%. A high concentration of very elderly residents signals a higher-acuity facility with experience caring for advanced age-related needs.

24%

Residents Age 95+ — State Benchmarked 24% of residents are 95 or older, compared to the Maryland average of 16%. A high proportion of the oldest-old suggests strong end-of-life care experience and very-high-acuity capabilities.

Sunrise of Rockville
SC
AL
HOS
MC
Rockville (Baltimore Road)
89
Facility 89
MD AVG 42
Rank #150 / 685
Yes
89
Facility 89
MD AVG 43
Rank #32 / 985
Studio / 1 Bed / 2 Bed
45
Facility 45
MD AVG 21
Rank #4 / 210
A-
23%

Male Residents — State Benchmarked 23% of residents are male, compared to the Maryland average of 31%. This facility caters to a majority female resident pool (77% female), consistent with the broader assisted living trend where women significantly outnumber men.

77%

Female Residents — State Benchmarked 77% of residents are female, compared to the Maryland average of 69%. Women comprise the large majority, consistent with national assisted living demographics where women live longer and enter care facilities at higher rates.

87%

White Residents — State Benchmarked 87% of residents are reported as White, compared to the Maryland average of 81%. Close to the average for this category among assisted living facilities in Maryland with reported race/ethnicity data.

2%

African American Residents — State Benchmarked 2% of residents are reported as African American or Black, compared to the Maryland average of 13%. A lower African American share than is typical in Maryland; local markets still vary widely.

11%

Other Ethnicity Residents — State Benchmarked 11% of residents fall into categories other than White or African American (combined), compared to the Maryland average of 6%. This column aggregates Hispanic, Asian, multiracial, and any other labeled groups that are not classified as White or African American. Reported subgroups in this total: Mixed Race (6%), Hispanic (3%), Asian (2%).

3%

Residents Age 65–74 — State Benchmarked 3% of residents are 65–74, compared to the Maryland average of 13%. Fewer younger seniors suggests the resident population skews older, likely requiring higher acuity care and more hands-on support.

31%

Residents Age 75–84 — State Benchmarked 31% of residents are 75–84, compared to the Maryland average of 31%. This is the second most common age bracket in assisted living, representing residents with moderate care needs.

56%

Residents Age 85–94 — State Benchmarked 56% of residents are 85–94, compared to the Maryland average of 44%. A high concentration of very elderly residents signals a higher-acuity facility with experience caring for advanced age-related needs.

10%

Residents Age 95+ — State Benchmarked 10% of residents are 95 or older, compared to the Maryland average of 16%. Most residents here have not yet reached the oldest-old bracket, suggesting a younger overall community.

Maplewood Park Place
SC
AL
IL
MC
NH
SNF
Bethesda (Pooks Hill)
29
Facility 29
MD AVG 42
Rank #240 / 685
Yes
38
Facility 38
MD AVG 43
Rank #542 / 985
1 Bed / 2 Bed
30
Facility 30
MD AVG 21
Rank #44 / 210
-
18%

Male Residents — State Benchmarked 18% of residents are male, compared to the Maryland average of 31%. This facility caters to a majority female resident pool (82% female), consistent with the broader assisted living trend where women significantly outnumber men.

82%

Female Residents — State Benchmarked 82% of residents are female, compared to the Maryland average of 69%. Women comprise the large majority, consistent with national assisted living demographics where women live longer and enter care facilities at higher rates.

100%

White Residents — State Benchmarked 100% of residents are reported as White, compared to the Maryland average of 81%. A higher White share than is typical for assisted living in Maryland in this dataset — compare with peer facilities for local context.

0%

African American Residents — State Benchmarked 0% of residents are reported as African American or Black, compared to the Maryland average of 13%. A lower African American share than is typical in Maryland; local markets still vary widely.

0%

Other Ethnicity Residents — State Benchmarked 0% of residents fall into categories other than White or African American (combined), compared to the Maryland average of 6%. This column aggregates Hispanic, Asian, multiracial, and any other labeled groups that are not classified as White or African American.

-
6%

Residents Age 75–84 — State Benchmarked 6% of residents are 75–84, compared to the Maryland average of 31%. Below the state norm — the resident mix may skew either younger or older than this typical middle bracket.

24%

Residents Age 85–94 — State Benchmarked 24% of residents are 85–94, compared to the Maryland average of 44%. The population here skews younger than the statewide norm, which may indicate a more active, lower-acuity community.

71%

Residents Age 95+ — State Benchmarked 71% of residents are 95 or older, compared to the Maryland average of 16%. A high proportion of the oldest-old suggests strong end-of-life care experience and very-high-acuity capabilities.

Ingleside at King Farm
SC
AL
IL
MC
NH
SNF
Rockville (King Farm)
45
Facility 45
MD AVG 42
Rank #219 / 685
Yes
73
Facility 73
MD AVG 43
Rank #152 / 985
1 Bed / 2 Bed-----------
Homewood Living Frederick
SC
AL
IL
MC
NH
SNF
Frederick
120
Facility 120
MD AVG 42
Rank #73 / 685
Yes
14
Facility 14
MD AVG 43
Rank #788 / 985
1 Bed / 2 Bed-----------
Residences at Vantage Point
SC
AL
HC
IL
MC
NH
SNF
Columbia (Town Center)
44
Facility 44
MD AVG 42
Rank #222 / 685
Yes
52
Facility 52
MD AVG 43
Rank #402 / 985
Studio / 1 Bed / 2 Bed
36
Facility 36
MD AVG 21
Rank #16 / 210
----------
Buckingham‘s Choice
SC
AL
MC
NH
RC
SNF
Adamstown (Baker Circle)
42
Facility 42
MD AVG 42
Rank #223 / 685
No
3
Facility 3
MD AVG 43
Rank #930 / 985
Private Rooms
31
Facility 31
MD AVG 21
Rank #39 / 210
----------
Sunrise of Pikesville
SC
NH
AL
HOS
MC
Pikesville (Old Court Road)
96
Facility 96
MD AVG 42
Rank #131 / 685
Yes
75
Facility 75
MD AVG 43
Rank #131 / 985
Studio / 1 Bed / 2 Bed
45
Facility 45
MD AVG 21
Rank #4 / 210
A-
30%

Male Residents — State Benchmarked 30% of residents are male, compared to the Maryland average of 31%. This facility caters to a majority female resident pool (70% female), consistent with the broader assisted living trend where women significantly outnumber men.

70%

Female Residents — State Benchmarked 70% of residents are female, compared to the Maryland average of 69%. Women comprise the large majority, consistent with national assisted living demographics where women live longer and enter care facilities at higher rates.

63%

White Residents — State Benchmarked 63% of residents are reported as White, compared to the Maryland average of 81%. A lower White share than the Maryland average — the community may draw a more diverse resident mix relative to other facilities in Maryland.

37%

African American Residents — State Benchmarked 37% of residents are reported as African American or Black, compared to the Maryland average of 13%. A higher African American share than the typical Maryland average — useful context when comparing cultural fit and community composition.

0%

Other Ethnicity Residents — State Benchmarked 0% of residents fall into categories other than White or African American (combined), compared to the Maryland average of 6%. This column aggregates Hispanic, Asian, multiracial, and any other labeled groups that are not classified as White or African American.

15%

Residents Age 65–74 — State Benchmarked 15% of residents are 65–74, compared to the Maryland average of 13%. In line with the statewide profile for this youngest senior bracket in assisted living.

27%

Residents Age 75–84 — State Benchmarked 27% of residents are 75–84, compared to the Maryland average of 31%. This is the second most common age bracket in assisted living, representing residents with moderate care needs.

41%

Residents Age 85–94 — State Benchmarked 41% of residents are 85–94, compared to the Maryland average of 44%. This is typically the most common age bracket in assisted living — this facility is in line with the statewide norm.

15%

Residents Age 95+ — State Benchmarked 15% of residents are 95 or older, compared to the Maryland average of 16%. In line with the statewide profile for the oldest resident bracket.

Brighton Gardens of Friendship Heights
SC
AL
HOS
MC
Chevy Chase (Friendship Boulevard)
154
Facility 154
MD AVG 42
Rank #39 / 685
Yes
86
Facility 86
MD AVG 43
Rank #47 / 985
Studio / 1 Bed / 2 Bed
29
Facility 29
MD AVG 21
Rank #48 / 210
-
20%

Male Residents — State Benchmarked 20% of residents are male, compared to the Maryland average of 31%. This facility caters to a majority female resident pool (80% female), consistent with the broader assisted living trend where women significantly outnumber men.

80%

Female Residents — State Benchmarked 80% of residents are female, compared to the Maryland average of 69%. Women comprise the large majority, consistent with national assisted living demographics where women live longer and enter care facilities at higher rates.

96%

White Residents — State Benchmarked 96% of residents are reported as White, compared to the Maryland average of 81%. A higher White share than is typical for assisted living in Maryland in this dataset — compare with peer facilities for local context.

1%

African American Residents — State Benchmarked 1% of residents are reported as African American or Black, compared to the Maryland average of 13%. A lower African American share than is typical in Maryland; local markets still vary widely.

3%

Other Ethnicity Residents — State Benchmarked 3% of residents fall into categories other than White or African American (combined), compared to the Maryland average of 6%. This column aggregates Hispanic, Asian, multiracial, and any other labeled groups that are not classified as White or African American. Reported subgroups in this total: Asian (2%), Hispanic (1%).

3%

Residents Age 65–74 — State Benchmarked 3% of residents are 65–74, compared to the Maryland average of 13%. Fewer younger seniors suggests the resident population skews older, likely requiring higher acuity care and more hands-on support.

31%

Residents Age 75–84 — State Benchmarked 31% of residents are 75–84, compared to the Maryland average of 31%. This is the second most common age bracket in assisted living, representing residents with moderate care needs.

49%

Residents Age 85–94 — State Benchmarked 49% of residents are 85–94, compared to the Maryland average of 44%. A high concentration of very elderly residents signals a higher-acuity facility with experience caring for advanced age-related needs.

15%

Residents Age 95+ — State Benchmarked 15% of residents are 95 or older, compared to the Maryland average of 16%. In line with the statewide profile for the oldest resident bracket.

Sunrise of Frederick
SC
AL
MC
Frederick (Waterford)
88
Facility 88
MD AVG 42
Rank #152 / 685
Yes
62
Facility 62
MD AVG 43
Rank #286 / 985
Studio / Suite / 2 Bed
45
Facility 45
MD AVG 21
Rank #4 / 210
A-
31%

Male Residents — State Benchmarked 31% of residents are male, compared to the Maryland average of 31%. This facility caters to a majority female resident pool (69% female), consistent with the broader assisted living trend where women significantly outnumber men.

69%

Female Residents — State Benchmarked 69% of residents are female, compared to the Maryland average of 69%. Women comprise the large majority, consistent with national assisted living demographics where women live longer and enter care facilities at higher rates.

97%

White Residents — State Benchmarked 97% of residents are reported as White, compared to the Maryland average of 81%. A higher White share than is typical for assisted living in Maryland in this dataset — compare with peer facilities for local context.

2%

African American Residents — State Benchmarked 2% of residents are reported as African American or Black, compared to the Maryland average of 13%. A lower African American share than is typical in Maryland; local markets still vary widely.

2%

Other Ethnicity Residents — State Benchmarked 2% of residents fall into categories other than White or African American (combined), compared to the Maryland average of 6%. This column aggregates Hispanic, Asian, multiracial, and any other labeled groups that are not classified as White or African American. Reported subgroups in this total: Hispanic (2%).

10%

Residents Age 65–74 — State Benchmarked 10% of residents are 65–74, compared to the Maryland average of 13%. Fewer younger seniors suggests the resident population skews older, likely requiring higher acuity care and more hands-on support.

34%

Residents Age 75–84 — State Benchmarked 34% of residents are 75–84, compared to the Maryland average of 31%. This is the second most common age bracket in assisted living, representing residents with moderate care needs.

48%

Residents Age 85–94 — State Benchmarked 48% of residents are 85–94, compared to the Maryland average of 44%. This is typically the most common age bracket in assisted living — this facility is in line with the statewide norm.

6%

Residents Age 95+ — State Benchmarked 6% of residents are 95 or older, compared to the Maryland average of 16%. Most residents here have not yet reached the oldest-old bracket, suggesting a younger overall community.

Autumn Lake Healthcare at Riverview
SC
HOS
NH
PC
RC
SNF
Essex
238
Facility 238
MD AVG 42
Rank #5 / 685
No
61
Facility 61
MD AVG 43
Rank #301 / 985
------------
Sterling Care Hillhaven Assisted Living and Memory Care
SC
AL
HOS
MC
NH
SNF
Adelphi (Knollwood)
66
Facility 66
MD AVG 42
Rank #188 / 685
No
25
Facility 25
MD AVG 43
Rank #684 / 985
Studio / 1 Bed-----------
Rows per page:
View all Nearby Homes
Overview of Sterling Care Forest Hill

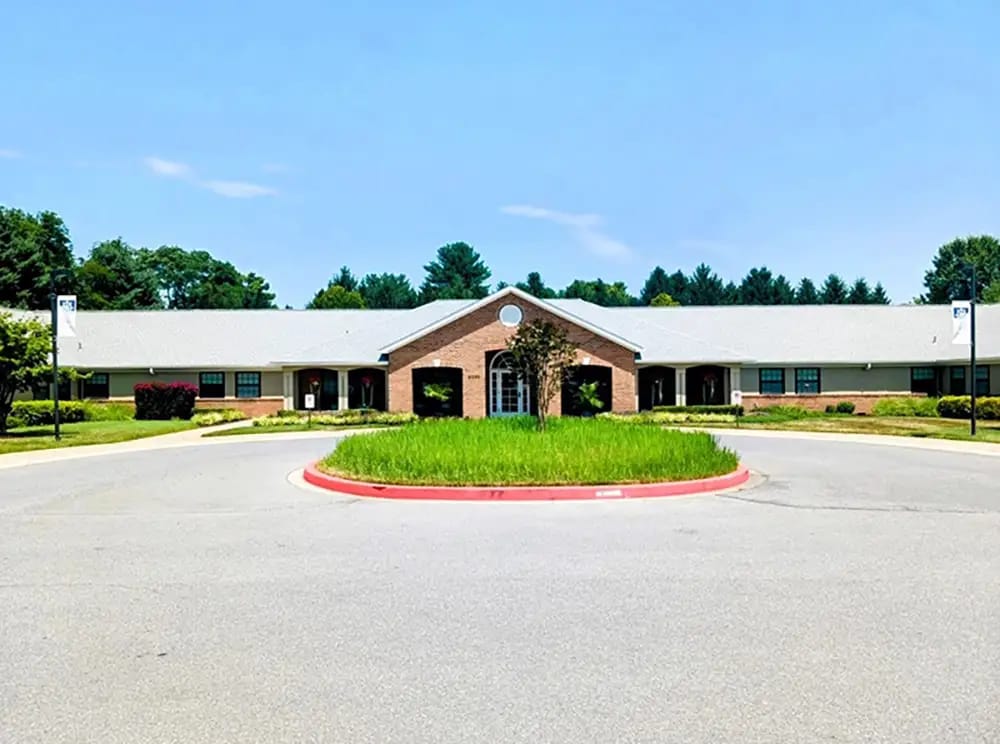
Settled in the tranquil neighborhood of Forest Valley Drive, Forest Hill, MD, Sterling Care Forest Hill is a reliable senior living community focusing on medical services including long-term care, skilled nursing, outpatient therapy, cardiac care, and hospice services. Featuring newly renovated residences, the community ensures seniors experience unrivaled comfort and convenience. The community strives to provide the highest quality of care and assistance around the clock for seniors to flourish and reach their full potential.

Alongside comprehensive care, the community also features state-of-the-art amenities to promote an active and blissful retirement. Outdoor trips and plenty of fun games are orchestrated for residents’ enjoyment. Sterling Care Forest Hill is great for seniors looking to make the most out of their golden years in its beautifully designed campus.

Contact Sterling Care Forest Hill

Overview of Sunrise of Severna Park

Nestled in the serene neighborhood of Severna Park, Sunrise of Severna Park is a distinguished senior living community dedicated to providing exceptional care and enriching the lives of its residents. With its picturesque surroundings and elegant architecture, this community offers a tranquil and inviting atmosphere for seniors looking to embrace a vibrant and fulfilling lifestyle. The spacious and thoughtfully designed apartments are tailored to meet the unique needs of each resident, offering a range of floor plans to choose from. Each apartment features modern amenities, ample natural light, and beautiful views, providing a comfortable and welcoming space to call home.

At Sunrise of Severna Park, residents are greeted with warmth and compassion. The dedicated team of caregivers is available around the clock to offer personalized assistance and support, ensuring the well-being and safety of each resident. The community promotes a holistic approach to senior living, offering a wide array of engaging activities and programs designed to nurture the mind, body, and spirit. From social gatherings and outings to fitness classes and educational opportunities, there is always something to inspire and entertain residents. With a focus on creating a close-knit community, Sunrise of Severna Park encourages meaningful connections and fosters a sense of belonging for all residents.

Contact Sunrise of Severna Park

Overview of Sunrise of Montgomery Village

Sunrise of Montgomery Village is a senior living community conveniently located near Gaithersburg. With easy access to Washington, D.C., this vibrant assisted living community offers seniors the opportunity to embrace the local culture and enjoy an active lifestyle tailored to their preferences. Sunrise of Montgomery Village provides a range of living options, including Independent Living, Assisted Living, Memory Care, Short-Term Stays, and Hospice Coordination. Their experienced design team has thoughtfully crafted comfortable and well-appointed spaces, ensuring ease of navigation for residents. With a variety of floor plans available, individuals can select the suite that best suits their unique needs and preferences.

At Sunrise of Montgomery Village, residents can expect personalized care, engaging activities, and a warm and inviting atmosphere. The community is dedicated to creating a supportive environment that promotes independence and overall well-being. Whether enjoying the amenities, participating in enriching programs, or connecting with friends and neighbors, residents can truly make the most of their senior living experience. 

Contact Sunrise of Montgomery Village

Overview of Brighton Gardens of Columbia

Brighton Gardens of Columbia is renowned for its exceptional services in promoting wellness and happiness. Their accolades speak volumes about the outstanding care they provide. Crafted with expertise, their social events, exercise classes, and culinary delights ensure residents experience a vibrant and fulfilling lifestyle. This Baltimore, Maryland gem not only excels in assisted living but also specializes in top-tier memory care. They welcome short-term stays and seamlessly coordinate hospice care, offering a comprehensive range of services.

Caregivers here are not just efficient but also incredibly pleasant, ensuring a warm and inviting environment. The community’s dedication, honed over 35 years, reflects in the pristine cleanliness, making it a highly recommended choice for those seeking a nurturing and comfortable living experience. Brighton Gardens of Columbia, with its unparalleled commitment, is where seniors truly find a haven of top-notch care and genuine warmth. Families often echo this sentiment in their glowing memory care reviews, underscoring the community’s exceptional memory care services, making it a trusted choice for those seeking the best.

Contact Brighton Gardens of Columbia

Overview of Rolling Meadows

Nestled in Catonsville, Rolling Meadows designed for memory care for seniors. This upscale community fosters an individuality, with personalized care plans tailored to each resident’s unique needs. Rolling Meadows prioritizes warmth and respect in their care approach. A dedicated staff gets to know each resident, creating a personalized care plan that fosters growth and a sense of purpose. Family-like treatment ensures residents feel loved and supported.

The community features a computerized wandering detection system and is equipped to handle residents prone to wandering or exhibiting challenging behaviors. A doctor is on call 24/7 for added reassurance. Rolling Meadows strives to keep residents active and engaged. They offer a social calendar with a variety of recreational activities designed to stimulate the mind and body. Residents can also enjoy delicious home-cooked meals and participate in devotional services.

Contact Rolling Meadows

Revitz House

6111 Montrose Road, Rockville, MD 20852
Overview of Revitz House

Revitz House is an esteemed community in the harmonious neighborhood of Montrose Road, North Bethesda, MD, offering independent living. With beautifully designed one-bedroom accommodations and round-the-clock concierge, residents’ comfort and convenience are guaranteed. The community’s convenient location near local amenities, combined with state-of-the-art amenities, ensures residents have easy access to their needs and wants.

Elevate your retirement with a fun-filled calendar of activities and engaging events, tailored to your enjoyment and wellness. With a personal emergency response system and a pet-friendly environment, the community strives to keep residents safe and happy. The community also collaborates with trusted care providers to meet residents’ healthcare needs. Live a blissful retirement amidst the community’s vibrant and inviting setting, while staying on a budget.

Contact Revitz House

Broadmead

13801 York Road, Cockeysville, MD 21030
Overview of Broadmead

Operating for 47 years, Broadmead is a 40-bed nursing home on York Road in Cockeysville, Maryland. The community owned by Ann Patterson currently serves 25 residents at around 61 percent occupancy. The average stay duration is 38 days, indicating a mix of short-term rehabilitation stays and longer-term nursing care.

Staffing mirrors a dedication to daily hands-on care. Total nursing support averages 6 hours 49 minutes per resident day, comprising registered nurses, nurse aides, and licensed practical nurses who provide support across clinical and personal care needs. The home is found in a car-dependent residential area of Cockeysville, with limited nearby walkable options. Most errands and visits demand a brief drive. Broadmead accepts Medicare, Medicaid, and private pay to give families multiple ways to afford short-term recovery and continuous care needs. The community’s specific focus areas span a Campus program, Supported Living services, and Centers of Excellence initiatives.

Contact Broadmead

Overview of Blakehurst (chestnut Green)

Operated by The Chestnut Real Estate and located at 1055 W. Joppa Road, Blakehurst (Chestnut Green) is a 35-bed nursing home in Towson, Maryland. Serving the community for 32 years, it accepts Medicare and private pay, offering families direct-pay and insurance-covered routes for care.

At 88 percent occupancy, the home maintains a stable resident census, averaging a stay length of 134 days, indicating a mix of short-term rehabilitation and longer-term nursing care. It’s oriented toward rehabilitative care, with dedicated rehabilitation services available as part of its clinical programming. Total nursing care averages 5 hours 15 minutes per resident day, supported by a team comprising registered nurses, nurse aides, and licensed practical nurses on staff. This level of care supports occupants with attentive support for activities of daily living and medical oversight. The community sits in a car-dependent area of Towson where most errands and activities need a vehicle, though it offers easy access to local roads. Care prices start at $5,271 monthly.

Families touring Blakehurst (Chestnut Green) are welcome to speak directly with staff regarding specific programs, amenities, and activities for occupants, plus room options and dining arrangements that best match their dearest one’s needs.

Contact Blakehurst (Chestnut Green)

Ginger Cove

4000 River Crescent Dr, Annapolis, MD 21401
Overview of Ginger Cove

Ginger Cove in Annapolis, Maryland, offers a environment for residents of all needs. This Life-Care community caters to individuals 60 and over, providing independent living, assisted living, memory care, and nursing care options. Ginger Cove prioritizes resident well-being with a heartfelt, resident-centered approach. Their dedicated staff crafts personalized care plans to ensure your loved one receives the exact level of support needed. Residents thrive in a cozy, relaxing, and fun-filled atmosphere, enjoying delicious and nutritious meals served daily, along with a vibrant calendar of social gatherings, educational activities, and specialized programs.

A life free from everyday chores. Ginger Cove takes care of housekeeping, laundry, and even transportation to appointments. With newfound free time, residents can explore their interests in a variety of ways. Continuing education programs encourage lifelong learning, while an on-site wellness center and resort-inspired amenities like an indoor pool and walking trails promote physical and mental well-being. Prefer for a quiet afternoon in the meditation garden, a friendly game of croquet with neighbors, or a kayaking expedition on Gingerville Creek, there’s something for everyone. For those seeking adventure beyond campus, Ginger Cove provides safe and secure living while you explore historic Annapolis, venture to Washington D.C., or international Travels.

Contact Ginger Cove

Landow House

1799 E Jefferson St, Rockville, MD 20852
Overview of Landow House

Nestled within the heart of Rockville, Maryland, Landow House stands as a haven where seniors can cherish their independence while residing in luxurious assisted living apartments. With a commitment to exceptional service, this residence offers daily assistance and provides a seamless blend of comfort and quality within its assisted living facilities. Here, residents find themselves immersed in a world of meaningful experiences that cater to their unique needs.

With the presence of an on-site licensed nurse available around the clock, as well as rigorous cleaning protocols for high-touch areas, the community fosters an environment of safety and reassurance. State-of-the-art amenities, including physical, occupational, and speech therapy services, further enhance the quality of life here. Physician services are conveniently offered on campus, and a diverse array of floor plans for assisted living apartments cater to individual preferences. From engaging leisure activities to delightful dining options, Landow House features a future movie theater, an inviting library, an art gallery, an outdoor garden, and more, creating a multi-awarded community that continues to exceed expectations in its commitment to excellence.

Contact Landow House

Weighting overview

  • 35%
    Resident Experience
  • 25%
    Regulatory
  • 15%
    Visual Media
  • 10%
    Website
  • 10%
    Stability
  • 5%
    Environment
01

Resident & Family Experience 35%

The single largest share of every ranking. Aggregated review sentiment and volume from major platforms — the closest signal to real resident experience.

  • Includes
  • Review Sentiment
  • Review Volume
02

Regulatory & Safety Record 25%

State inspection records, citations, and complaint visits. We weight per-inspection rates more heavily than raw counts.

  • Includes
  • State Inspections
  • Citations/Inspection
  • % Inspections w/ Citations
  • Complaint Visits
  • Accreditations
  • BBB Rating
03

Visual Media & Transparency 15%

Communities that publish high-quality visuals give families a real preview. No photos or tours = a negative transparency signal.

  • Includes
  • Video Tours
  • Virtual Walkthroughs
  • Photo Quantity
  • Photo Quality
04

Website & Operator Transparency 10%

Site quality and whether the operator publishes basic accountability information — staff names, contact details, ownership.

  • Includes
  • Website Content
  • Mobile Usability
  • Staff Info Available
  • Owner Info Available
05

Community Stability 10%

Operational signals indicating whether a community is well-run and meeting demand.

  • Includes
  • Occupancy Rate
  • Bed Options
06

Environment & Pricing 5%

Walkability and pricing transparency. Walk Score is weighted higher for Independent Living than for Memory Care, where most residents do not leave unaccompanied.

  • Includes
  • Walk Score
  • Pricing Transparency
No paid rankings Communities cannot pay to influence placement.
How we're paid: If we help you find a community and you move in, that community may pay us a referral fee. This never affects where they rank or what you pay. Learn more
Submit a correction

Nearby Cities

Who we are

Your Senior Care Partner, Every Step of the Way

We help families find affordable senior communities and unlock same day discounts, Medicaid, and Medicare options tailored to your needs.

Contact us Today