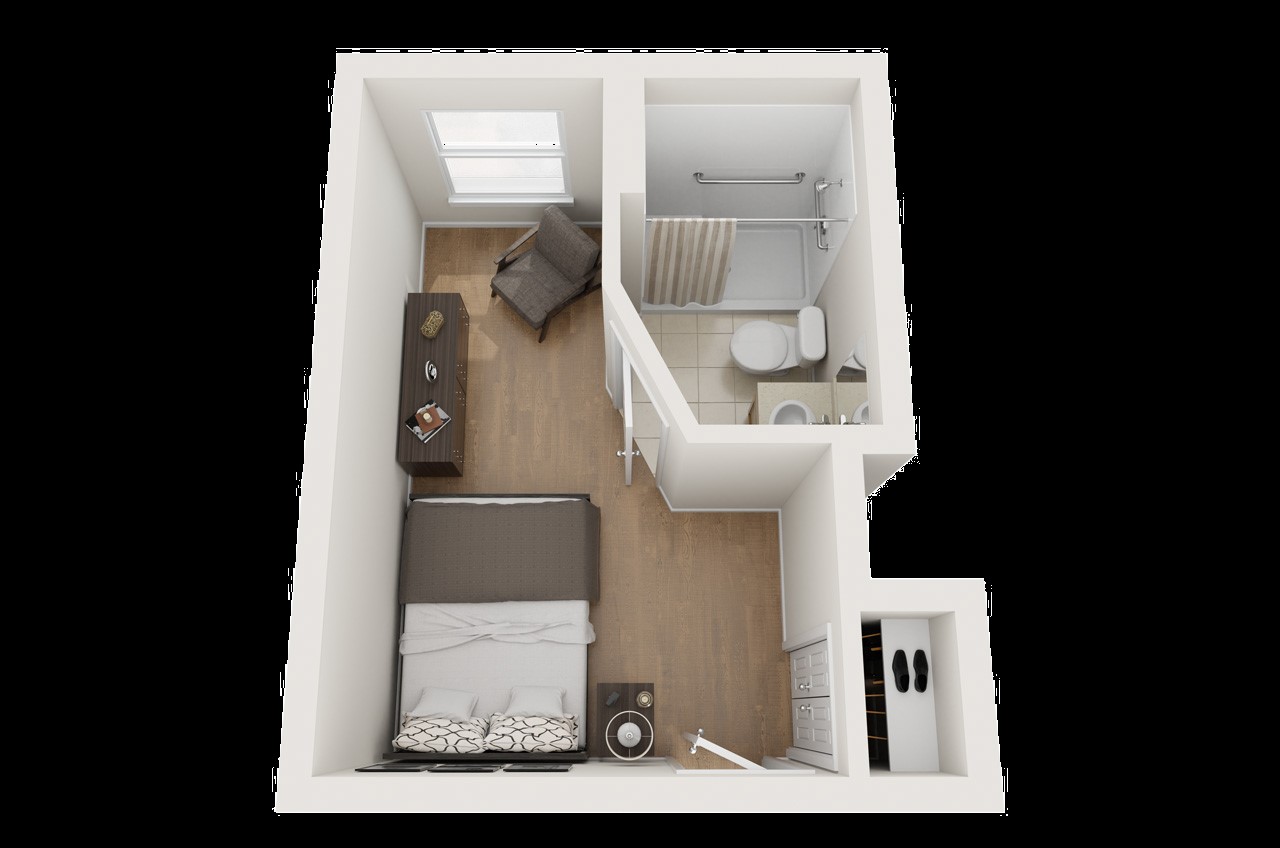
|
| | Bethesda | 108 | Yes | | Studio / 1 Bed / 2 Bed | 8 |
29%
Male Residents — State Benchmarked
29% of residents are male, compared to the Maryland average of 31%. This facility caters to a majority female resident pool (71% female), consistent with the broader assisted living trend where women significantly outnumber men. |
71%
Female Residents — State Benchmarked
71% of residents are female, compared to the Maryland average of 69%. Women comprise the large majority, consistent with national assisted living demographics where women live longer and enter care facilities at higher rates. |
79%
White Residents — State Benchmarked
79% of residents are reported as White, compared to the Maryland average of 81%. Close to the average for this category among assisted living facilities in Maryland with reported race/ethnicity data. |
6%
African American Residents — State Benchmarked
6% of residents are reported as African American or Black, compared to the Maryland average of 13%. In line with the Maryland average for African American residents among facilities reporting this breakdown. |
15%
Other Ethnicity Residents — State Benchmarked
15% of residents fall into categories other than White or African American (combined), compared to the Maryland average of 6%. This column aggregates Hispanic, Asian, multiracial, and any other labeled groups that are not classified as White or African American. Reported subgroups in this total: Other (8%), Asian (4%), Hispanic (2%), Mixed Race (2%). |
6%
Residents Age 65–74 — State Benchmarked
6% of residents are 65–74, compared to the Maryland average of 13%. Fewer younger seniors suggests the resident population skews older, likely requiring higher acuity care and more hands-on support. |
40%
Residents Age 75–84 — State Benchmarked
40% of residents are 75–84, compared to the Maryland average of 31%. A high concentration in this mid-range bracket, where residents typically need moderate support with daily activities. |
44%
Residents Age 85–94 — State Benchmarked
44% of residents are 85–94, compared to the Maryland average of 44%. This is typically the most common age bracket in assisted living — this facility is in line with the statewide norm. |
8%
Residents Age 95+ — State Benchmarked
8% of residents are 95 or older, compared to the Maryland average of 16%. Most residents here have not yet reached the oldest-old bracket, suggesting a younger overall community. |
|
| | Bethesda | 105 | Yes | | Studio / Suite / 1 Bed | 17 |
45%
Male Residents — State Benchmarked
45% of residents are male, compared to the Maryland average of 31%. A relatively balanced gender mix for assisted living, where facilities typically skew heavily female. |
55%
Female Residents — State Benchmarked
55% of residents are female, compared to the Maryland average of 69%. Closer to an even gender split than most assisted living facilities, which typically have 65–75% female residents. |
81%
White Residents — State Benchmarked
81% of residents are reported as White, compared to the Maryland average of 81%. Close to the average for this category among assisted living facilities in Maryland with reported race/ethnicity data. |
0%
African American Residents — State Benchmarked
0% of residents are reported as African American or Black, compared to the Maryland average of 13%. A lower African American share than is typical in Maryland; local markets still vary widely. |
19%
Other Ethnicity Residents — State Benchmarked
19% of residents fall into categories other than White or African American (combined), compared to the Maryland average of 6%. This column aggregates Hispanic, Asian, multiracial, and any other labeled groups that are not classified as White or African American. Reported subgroups in this total: Asian (6%), Mixed Race (6%), Hawaiian/Pacific Islander (4%), Hispanic (4%). |
6%
Residents Age 65–74 — State Benchmarked
6% of residents are 65–74, compared to the Maryland average of 13%. Fewer younger seniors suggests the resident population skews older, likely requiring higher acuity care and more hands-on support. |
23%
Residents Age 75–84 — State Benchmarked
23% of residents are 75–84, compared to the Maryland average of 31%. Below the state norm — the resident mix may skew either younger or older than this typical middle bracket. |
58%
Residents Age 85–94 — State Benchmarked
58% of residents are 85–94, compared to the Maryland average of 44%. A high concentration of very elderly residents signals a higher-acuity facility with experience caring for advanced age-related needs. |
11%
Residents Age 95+ — State Benchmarked
11% of residents are 95 or older, compared to the Maryland average of 16%. Most residents here have not yet reached the oldest-old bracket, suggesting a younger overall community. |
|
| | Bethesda (Pooks Hill) | 104 | Yes | | Deluxe Apartments | 6 |
45%
Male Residents — State Benchmarked
45% of residents are male, compared to the Maryland average of 31%. A relatively balanced gender mix for assisted living, where facilities typically skew heavily female. |
55%
Female Residents — State Benchmarked
55% of residents are female, compared to the Maryland average of 69%. Closer to an even gender split than most assisted living facilities, which typically have 65–75% female residents. |
90%
White Residents — State Benchmarked
90% of residents are reported as White, compared to the Maryland average of 81%. A higher White share than is typical for assisted living in Maryland in this dataset — compare with peer facilities for local context. |
0%
African American Residents — State Benchmarked
0% of residents are reported as African American or Black, compared to the Maryland average of 13%. A lower African American share than is typical in Maryland; local markets still vary widely. |
10%
Other Ethnicity Residents — State Benchmarked
10% of residents fall into categories other than White or African American (combined), compared to the Maryland average of 6%. This column aggregates Hispanic, Asian, multiracial, and any other labeled groups that are not classified as White or African American. Reported subgroups in this total: Asian (6%), Hispanic (3%), Hawaiian/Pacific Islander (1%). |
4%
Residents Age 65–74 — State Benchmarked
4% of residents are 65–74, compared to the Maryland average of 13%. Fewer younger seniors suggests the resident population skews older, likely requiring higher acuity care and more hands-on support. |
25%
Residents Age 75–84 — State Benchmarked
25% of residents are 75–84, compared to the Maryland average of 31%. Below the state norm — the resident mix may skew either younger or older than this typical middle bracket. |
60%
Residents Age 85–94 — State Benchmarked
60% of residents are 85–94, compared to the Maryland average of 44%. A high concentration of very elderly residents signals a higher-acuity facility with experience caring for advanced age-related needs. |
10%
Residents Age 95+ — State Benchmarked
10% of residents are 95 or older, compared to the Maryland average of 16%. Most residents here have not yet reached the oldest-old bracket, suggesting a younger overall community. |
|
| | Bethesda | 72 | No | | - | 4 |
57%
Male Residents — State Benchmarked
57% of residents are male, compared to the Maryland average of 31%. An unusually high male share for assisted living, where most facilities skew heavily female. |
43%
Female Residents — State Benchmarked
43% of residents are female, compared to the Maryland average of 69%. An unusually low female share — most assisted living facilities have 65–75% female residents. |
100%
White Residents — State Benchmarked
100% of residents are reported as White, compared to the Maryland average of 81%. A higher White share than is typical for assisted living in Maryland in this dataset — compare with peer facilities for local context. |
0%
African American Residents — State Benchmarked
0% of residents are reported as African American or Black, compared to the Maryland average of 13%. A lower African American share than is typical in Maryland; local markets still vary widely. |
0%
Other Ethnicity Residents — State Benchmarked
0% of residents fall into categories other than White or African American (combined), compared to the Maryland average of 6%. This column aggregates Hispanic, Asian, multiracial, and any other labeled groups that are not classified as White or African American. |
21%
Residents Age 65–74 — State Benchmarked
21% of residents are 65–74, compared to the Maryland average of 13%. A higher share of younger seniors often signals a more independent, active resident community with lower acuity care needs. |
7%
Residents Age 75–84 — State Benchmarked
7% of residents are 75–84, compared to the Maryland average of 31%. Below the state norm — the resident mix may skew either younger or older than this typical middle bracket. |
29%
Residents Age 85–94 — State Benchmarked
29% of residents are 85–94, compared to the Maryland average of 44%. The population here skews younger than the statewide norm, which may indicate a more active, lower-acuity community. |
36%
Residents Age 95+ — State Benchmarked
36% of residents are 95 or older, compared to the Maryland average of 16%. A high proportion of the oldest-old suggests strong end-of-life care experience and very-high-acuity capabilities. |
|
| | Bethesda (Pooks Hill) | 29 | Yes | | 1 Bed / 2 Bed | 30 |
18%
Male Residents — State Benchmarked
18% of residents are male, compared to the Maryland average of 31%. This facility caters to a majority female resident pool (82% female), consistent with the broader assisted living trend where women significantly outnumber men. |
82%
Female Residents — State Benchmarked
82% of residents are female, compared to the Maryland average of 69%. Women comprise the large majority, consistent with national assisted living demographics where women live longer and enter care facilities at higher rates. |
100%
White Residents — State Benchmarked
100% of residents are reported as White, compared to the Maryland average of 81%. A higher White share than is typical for assisted living in Maryland in this dataset — compare with peer facilities for local context. |
0%
African American Residents — State Benchmarked
0% of residents are reported as African American or Black, compared to the Maryland average of 13%. A lower African American share than is typical in Maryland; local markets still vary widely. |
0%
Other Ethnicity Residents — State Benchmarked
0% of residents fall into categories other than White or African American (combined), compared to the Maryland average of 6%. This column aggregates Hispanic, Asian, multiracial, and any other labeled groups that are not classified as White or African American. | - |
6%
Residents Age 75–84 — State Benchmarked
6% of residents are 75–84, compared to the Maryland average of 31%. Below the state norm — the resident mix may skew either younger or older than this typical middle bracket. |
24%
Residents Age 85–94 — State Benchmarked
24% of residents are 85–94, compared to the Maryland average of 44%. The population here skews younger than the statewide norm, which may indicate a more active, lower-acuity community. |
71%
Residents Age 95+ — State Benchmarked
71% of residents are 95 or older, compared to the Maryland average of 16%. A high proportion of the oldest-old suggests strong end-of-life care experience and very-high-acuity capabilities. |





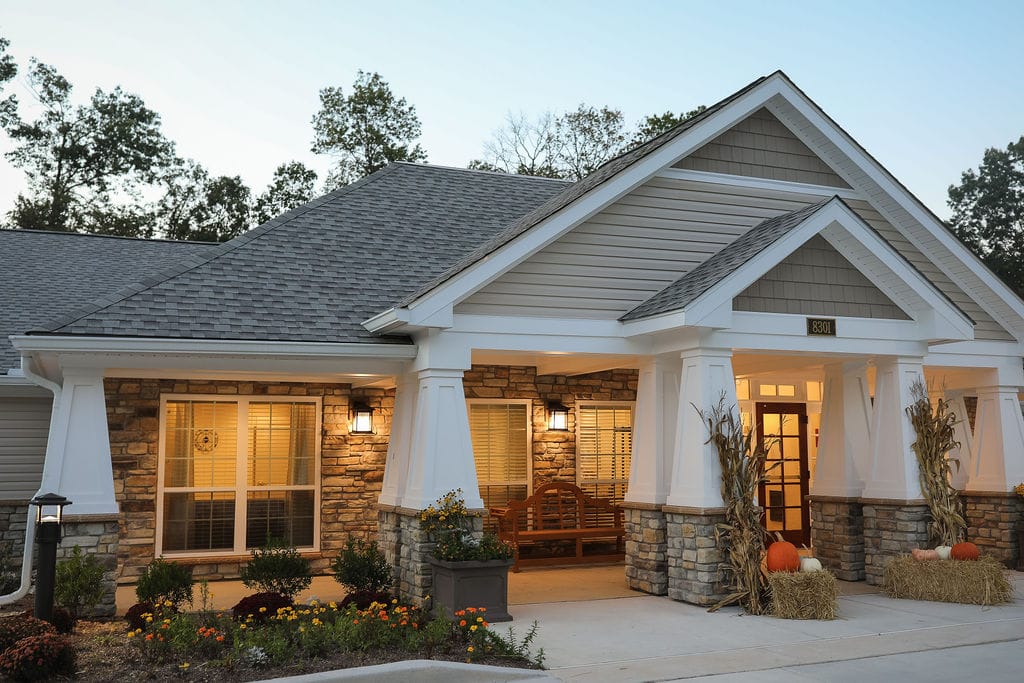
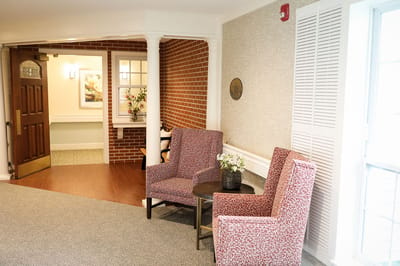


 A smaller, more intimate setting that may offer a quieter environment and closer staff-resident interactions.
72
Rank #104 / 242Bed count — State benchmarked This memory care community is ranked 104th out of 242 memory care communities we track in Maryland for bed count. Shows this facility's certified or reported bed count compared to other Maryland facilities. Larger communities may offer more amenities, programs, and on-site services for residents and families. Communities with the same value for a metric share the same rank. Rankings compare like with like: every memory care community we track in Maryland that reports data for that category. Memory care communities without available data are excluded, so the pool size varies from metric to metric.
A smaller, more intimate setting that may offer a quieter environment and closer staff-resident interactions.
72
Rank #104 / 242Bed count — State benchmarked This memory care community is ranked 104th out of 242 memory care communities we track in Maryland for bed count. Shows this facility's certified or reported bed count compared to other Maryland facilities. Larger communities may offer more amenities, programs, and on-site services for residents and families. Communities with the same value for a metric share the same rank. Rankings compare like with like: every memory care community we track in Maryland that reports data for that category. Memory care communities without available data are excluded, so the pool size varies from metric to metric.