

Total health inspections
1
Arizona average 6.3
Last Health inspection on Aug 2022

We arrange tours, appointments, and even moving support so you don’t have to
Thank you for your interest!
Our team will be in touch shortly to help with next steps.
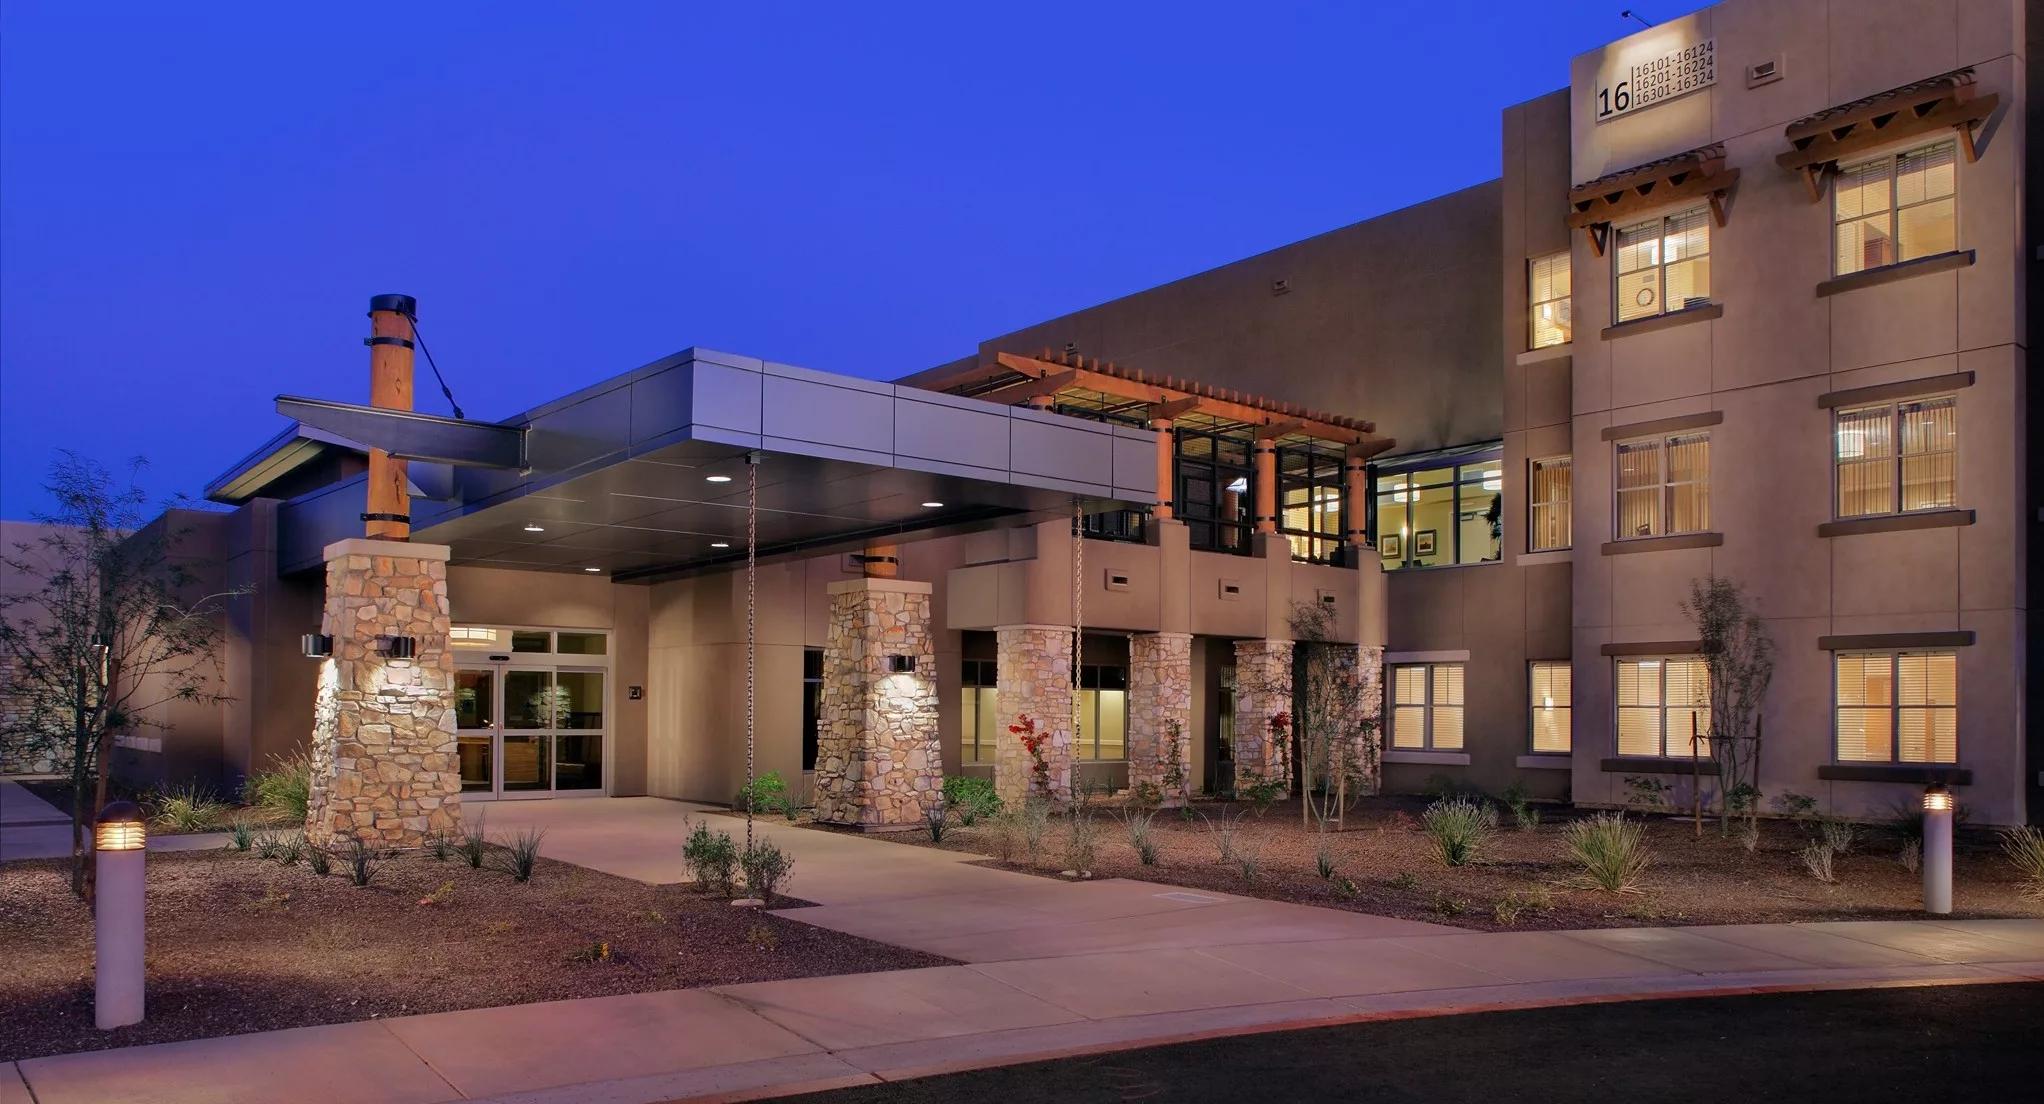
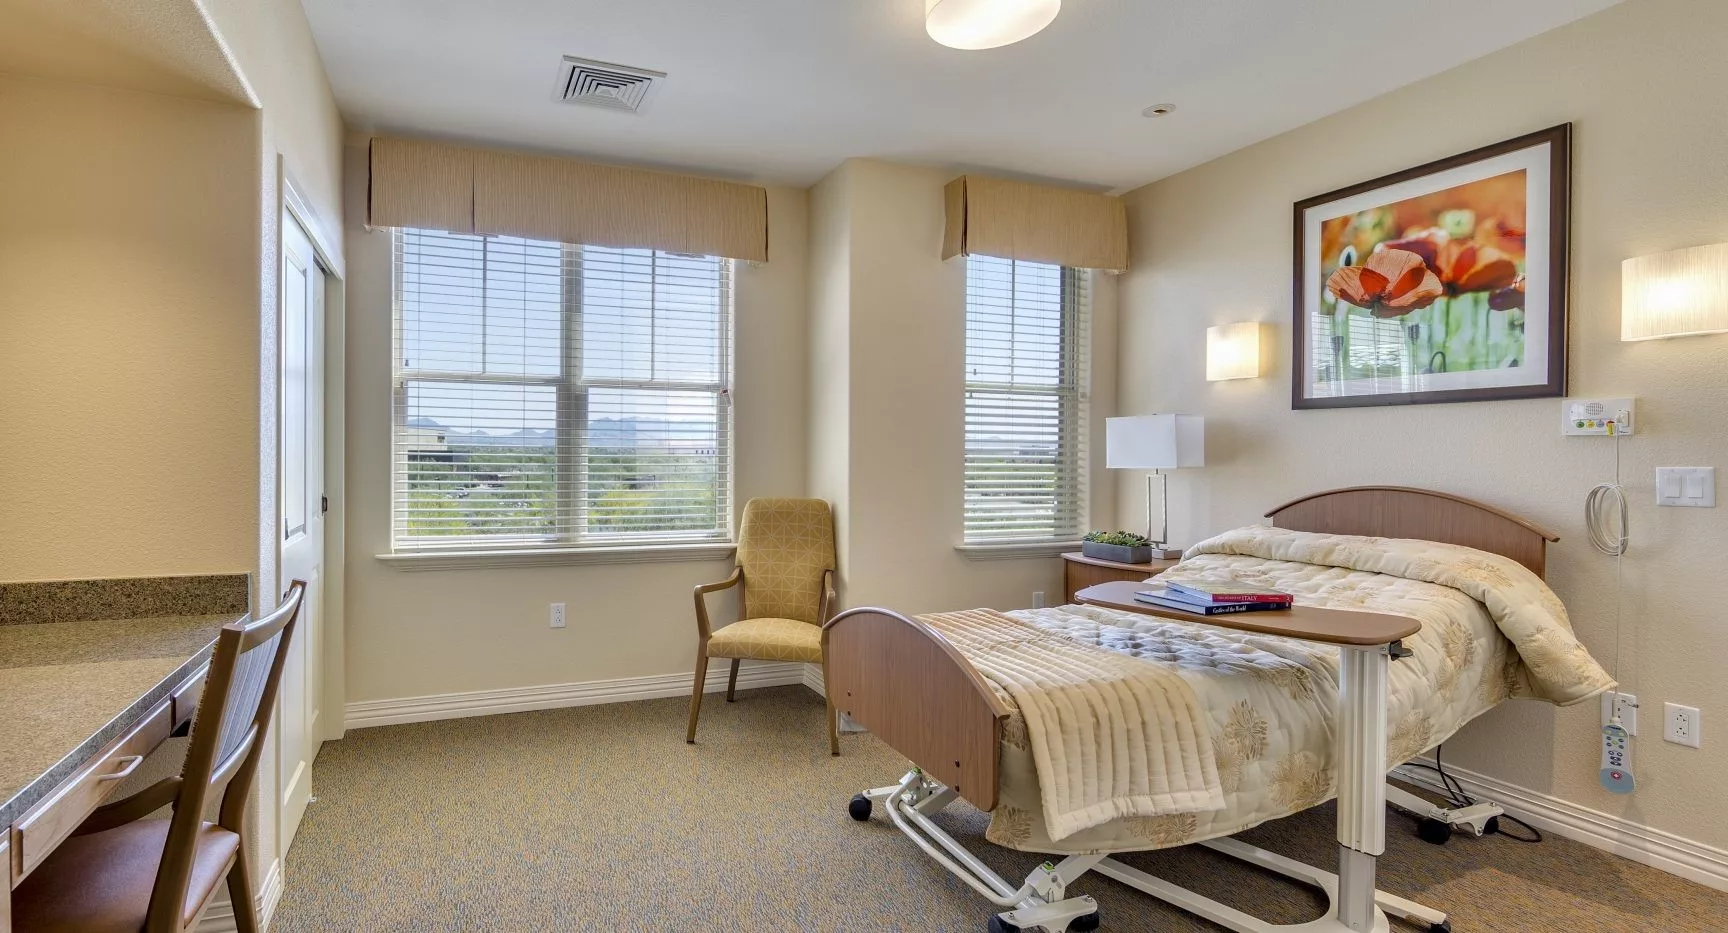
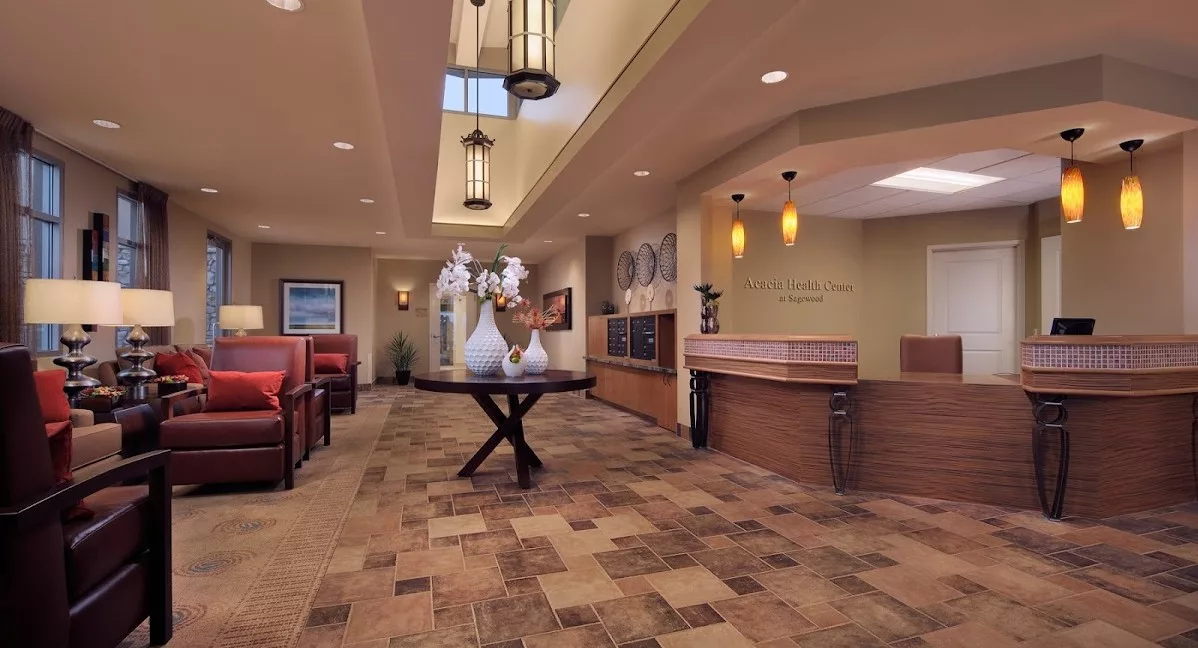


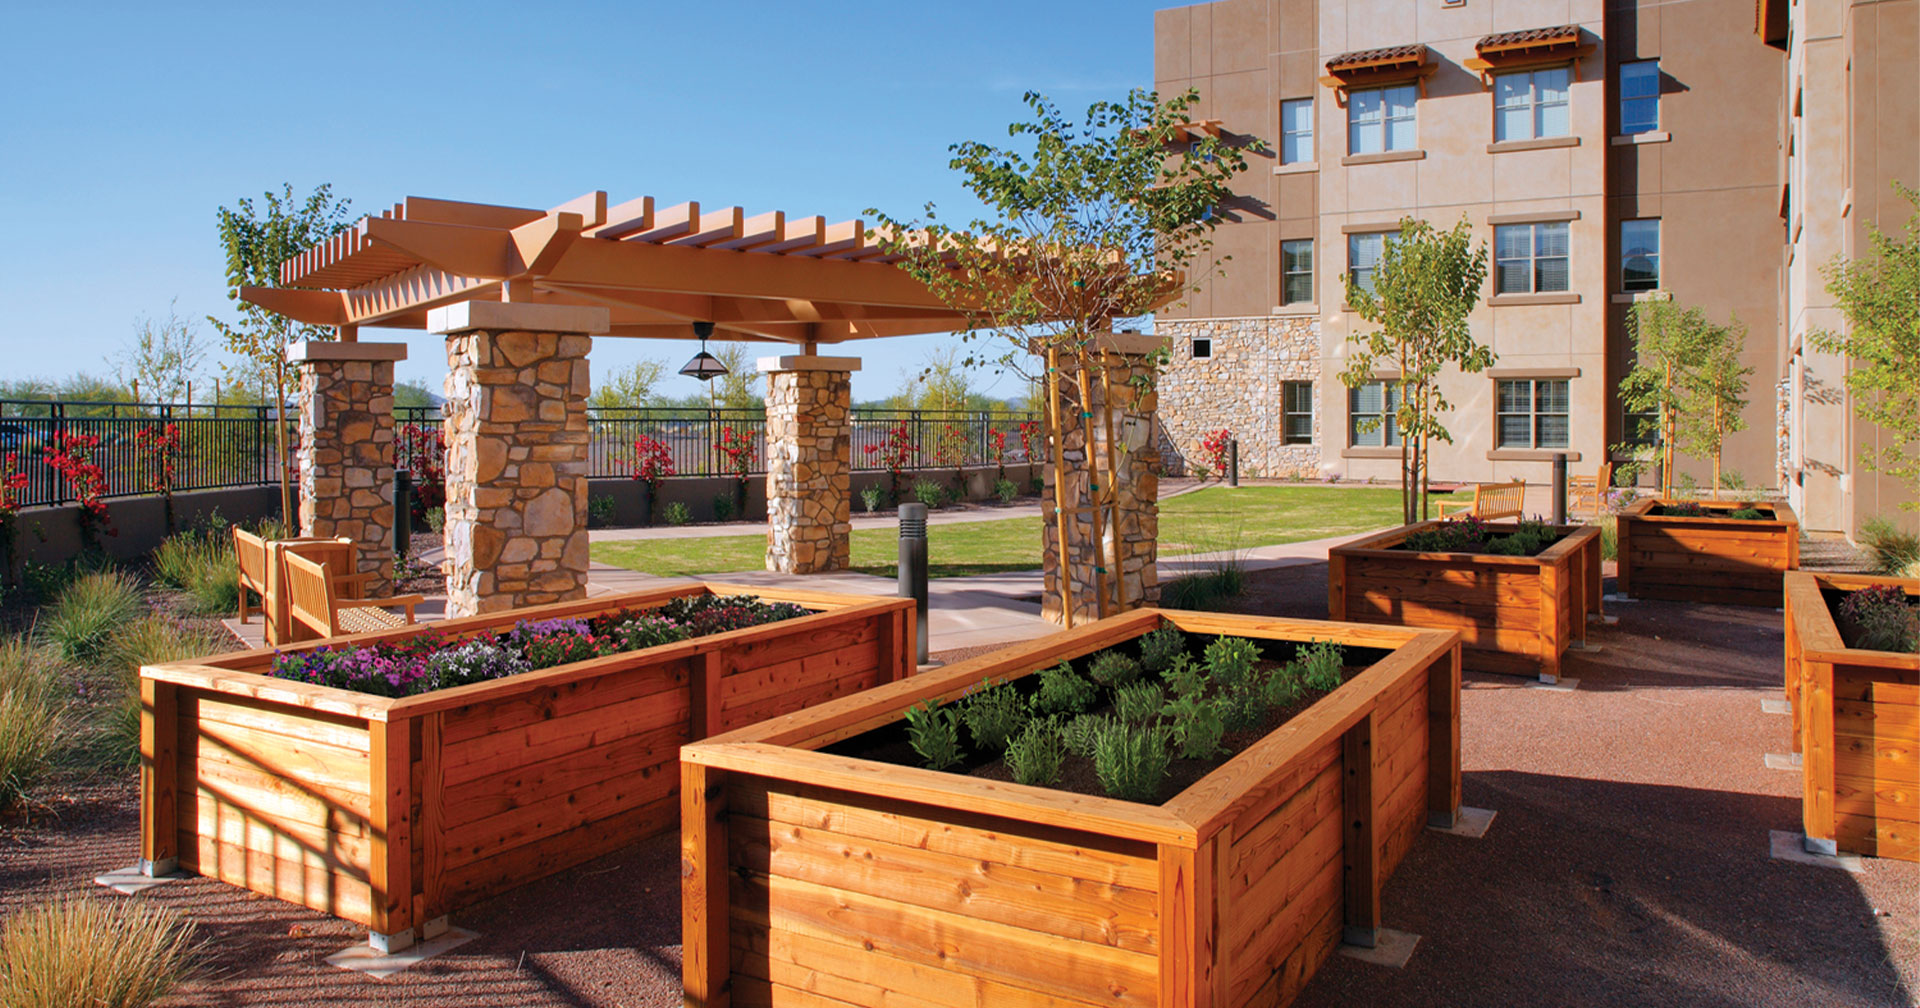
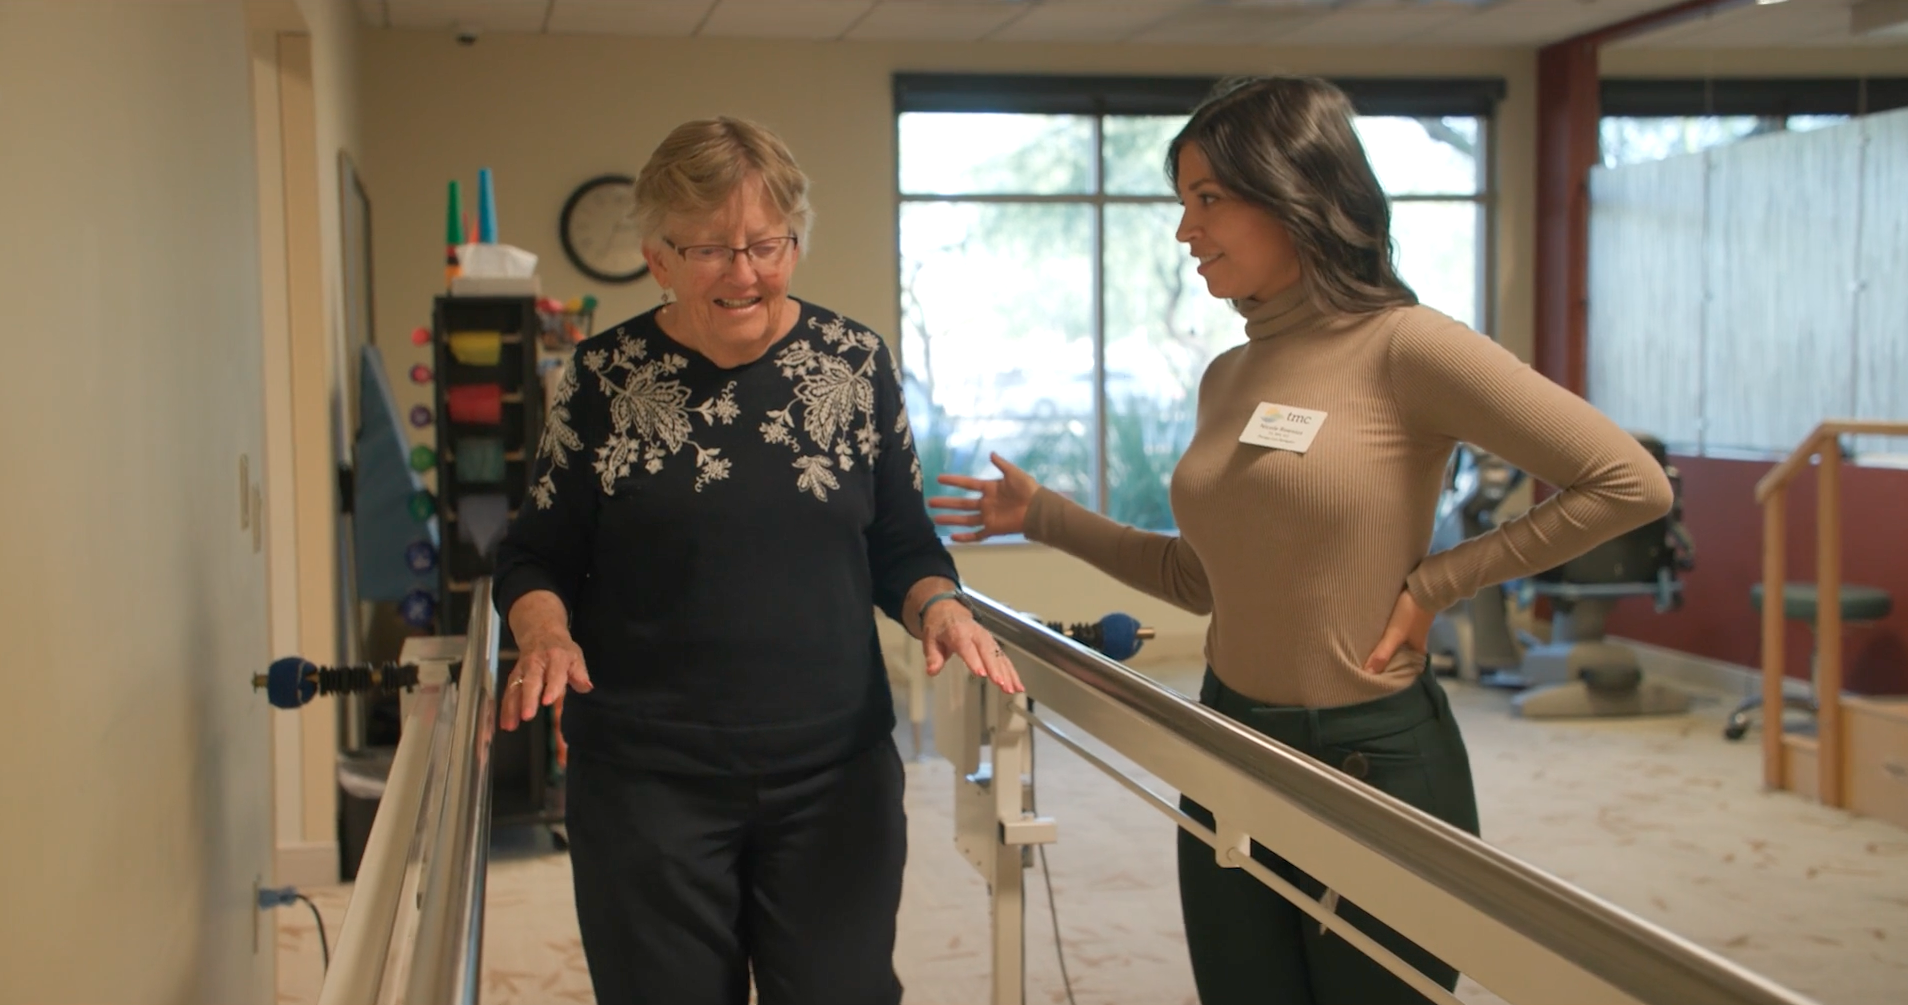


A proud member of the renowned Sagewood senior living community in Phoenix, Acacia Health Center is the outstanding skilled nursing community in the city. The beautiful nursing home community boasts a dedicated team of professionals who can go above and beyond for its residents. Compassion is at the heart of their service– ensuring that seniors can feel comfortable and secure in a friendly environment with a home-like setting. Acacia Health Center ensures that they provide attentive care that offers a sense of comfort and belonging to the residents.
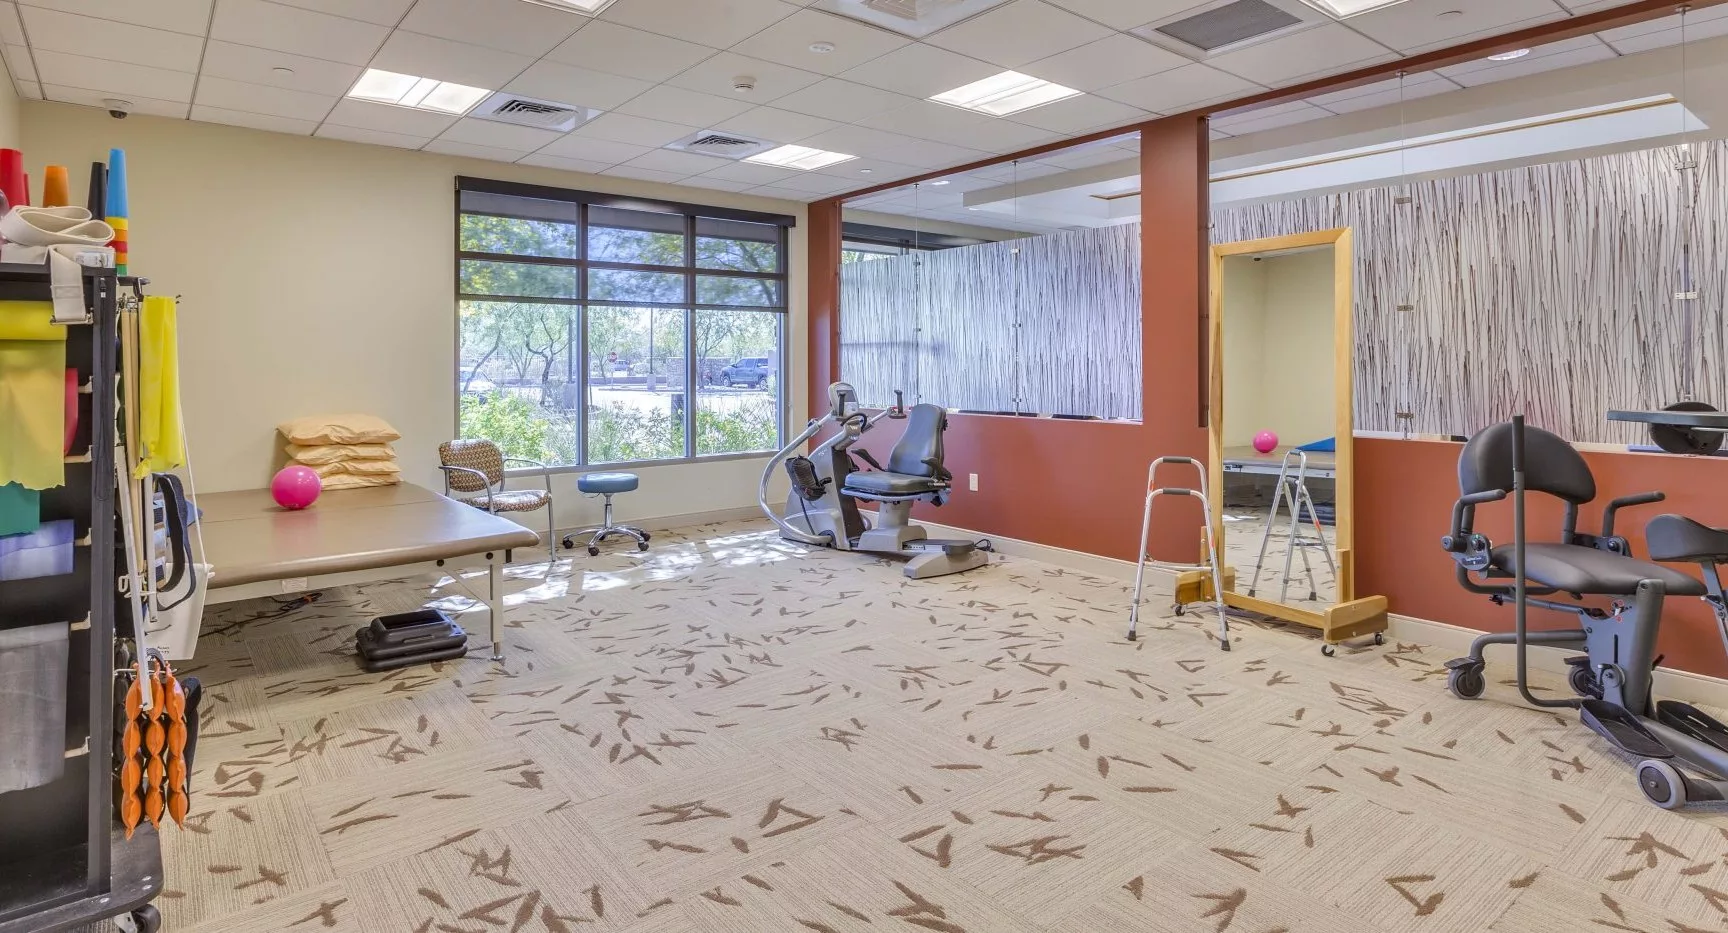
Offering short-term and long-term stays, the healthcare center has exceptional health services that promote health and wellness for each resident; provided by their LifeCare® plan. It’s able to promote flexibility and healthy living through its HealthyLife® program which gives an array of activities that will maximize optimum fitness, nutrition, and well-being. Acacia Health Center is an exquisite community to choose from, especially for families looking for an innovative community.
Offers a balance of services and community atmosphere.
Occupancy is moderate, suggesting balanced demand.
Most residents typically stay for a few weeks or months before returning home or moving on.
79% of new residents, usually for short-term rehab.
21% of new residents, often for short stays.
Key information about the people who lead and staff this community.
In Arizona, the Department of Health Services, Bureau of Long Term Care Licensing performs regular onsite inspections and investigates complaints for all licensed residential and nursing facilities.
Arizona average: 6 complaint visits
Arizona average: 5 inspections
Arizona average 6.3
Last Health inspection on Aug 2022
Arizona average 23.2
Arizona average 3.82
Health citations are formal notices following inspections when they fail to comply with safety and care standards.
All 3 citations resulted from standard inspections.
Arizona average: 0.1
Arizona average: 0.6
Data sourced from CMS Health Deficiencies reports. Citation severity codes range from A (least serious) to L (most serious). Immediate Jeopardy (J-L) citations indicate situations where the facility's noncompliance has placed residents at risk of death or serious harm.
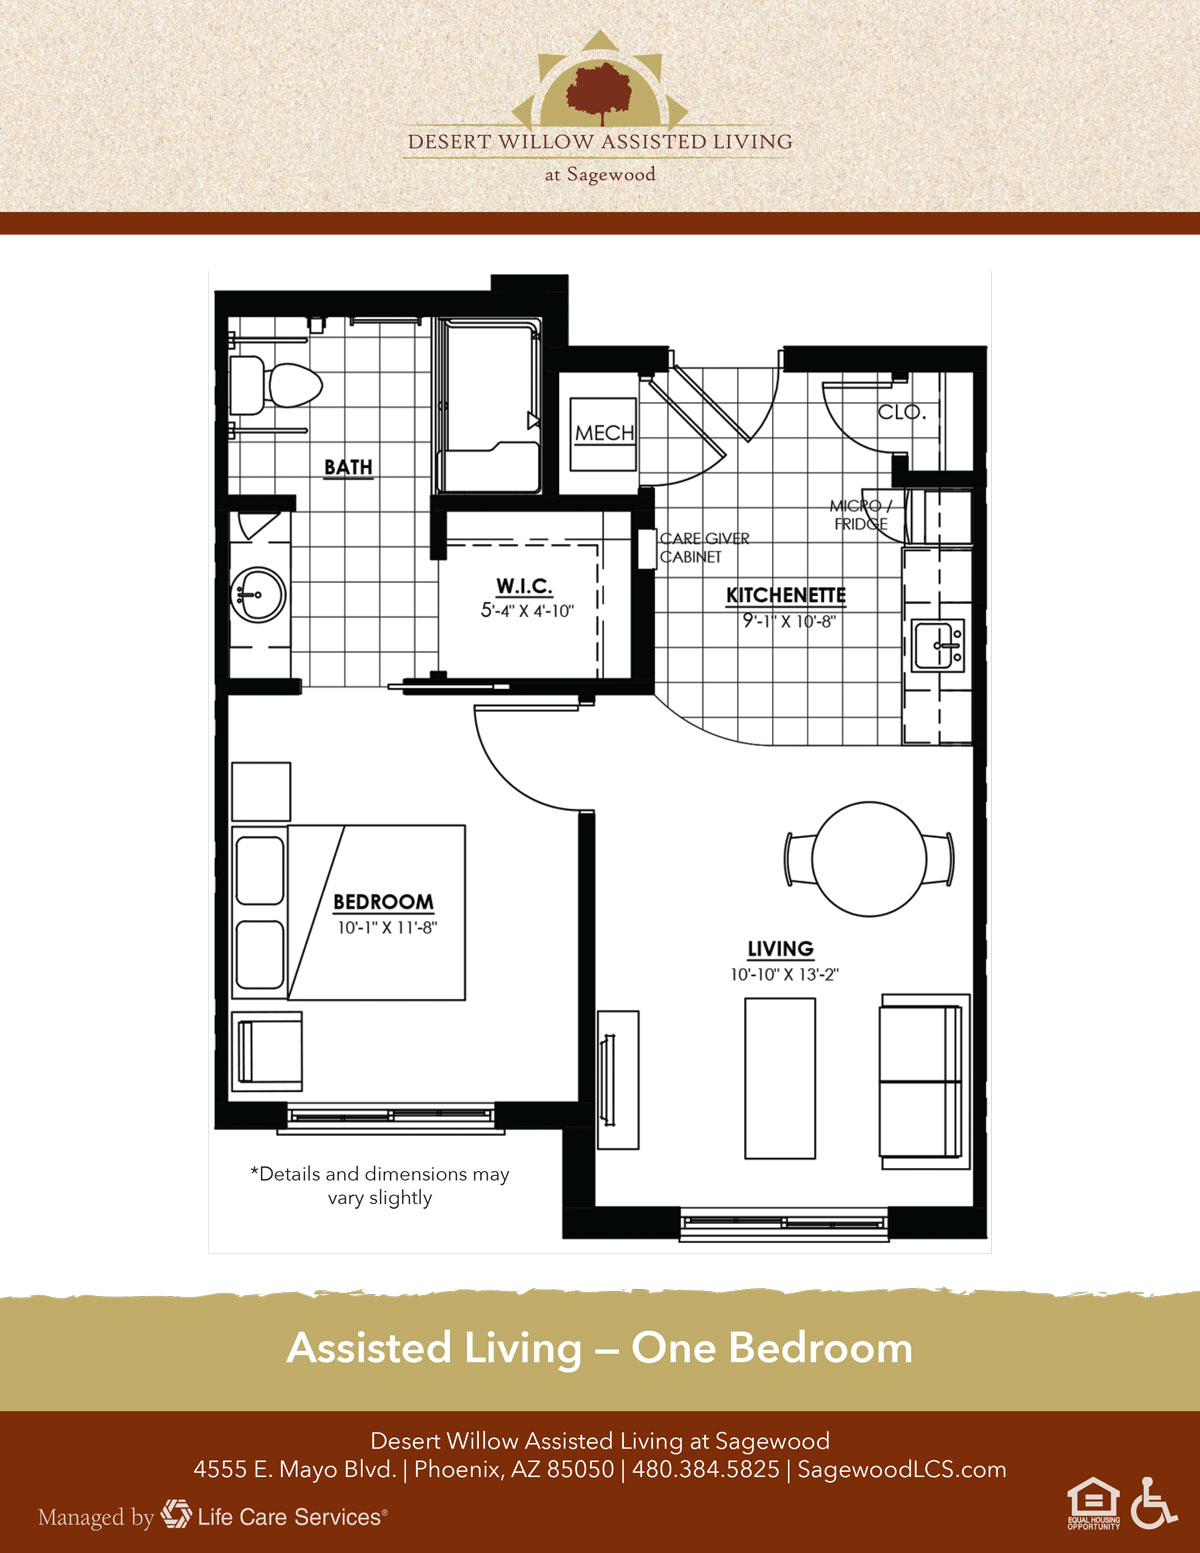
Assisted Living A licensed, long-term care setting for seniors or individuals with disabilities who need help with daily activities — like bathing, dressing, and medication management — but not 24-hour skilled nursing. Offers housing, meals, and around-the-clock support while aiming to maximize resident independence.
Independent Living Lifestyle-focused communities for older adults offering dining, activities, and transportation with minimal personal care. Best for active, independent seniors who want community without medical support.
Memory Care Secured, specialized care for people living with Alzheimer's or dementia. Staff trained in cognitive impairment, with higher staff-to-resident ratios and an environment designed to reduce confusion and wandering risk.
Nursing Home Licensed facility providing 24/7 skilled nursing care for residents with complex, ongoing medical needs. Staffed by RNs, LPNs, and CNAs. Inspected and star-rated annually by CMS. Accepts Medicare (short-term rehab) and Medicaid (long-term care).
Assisted Living A licensed, long-term care setting for seniors or individuals with disabilities who need help with daily activities — like bathing, dressing, and medication management — but not 24-hour skilled nursing. Offers housing, meals, and around-the-clock support while aiming to maximize resident independence.
Memory Care Secured, specialized care for people living with Alzheimer's or dementia. Staff trained in cognitive impairment, with higher staff-to-resident ratios and an environment designed to reduce confusion and wandering risk.
Nursing Home Licensed facility providing 24/7 skilled nursing care for residents with complex, ongoing medical needs. Staffed by RNs, LPNs, and CNAs. Inspected and star-rated annually by CMS. Accepts Medicare (short-term rehab) and Medicaid (long-term care).
Nursing Home Licensed facility providing 24/7 skilled nursing care for residents with complex, ongoing medical needs. Staffed by RNs, LPNs, and CNAs. Inspected and star-rated annually by CMS. Accepts Medicare (short-term rehab) and Medicaid (long-term care).
Nursing Home Licensed facility providing 24/7 skilled nursing care for residents with complex, ongoing medical needs. Staffed by RNs, LPNs, and CNAs. Inspected and star-rated annually by CMS. Accepts Medicare (short-term rehab) and Medicaid (long-term care).
Assisted Living A licensed, long-term care setting for seniors or individuals with disabilities who need help with daily activities — like bathing, dressing, and medication management — but not 24-hour skilled nursing. Offers housing, meals, and around-the-clock support while aiming to maximize resident independence.
Independent Living Lifestyle-focused communities for older adults offering dining, activities, and transportation with minimal personal care. Best for active, independent seniors who want community without medical support.
Memory Care Secured, specialized care for people living with Alzheimer's or dementia. Staff trained in cognitive impairment, with higher staff-to-resident ratios and an environment designed to reduce confusion and wandering risk.
Nursing Home Licensed facility providing 24/7 skilled nursing care for residents with complex, ongoing medical needs. Staffed by RNs, LPNs, and CNAs. Inspected and star-rated annually by CMS. Accepts Medicare (short-term rehab) and Medicaid (long-term care).
![]() 21.4 miles from city center — 3.4 miles to nearest hospital (HonorHealth Scottsdale Thompson Peak Medical Center)
21.4 miles from city center — 3.4 miles to nearest hospital (HonorHealth Scottsdale Thompson Peak Medical Center)
![]() 4555 E Mayo Blvd, Phoenix, AZ 85050
4555 E Mayo Blvd, Phoenix, AZ 85050
Add your location
This data corresponds to Q2 2025 and is based on CMS Payroll-Based Journal.
Arizona average ratio: 1.83:1
Arizona average: 8.5 hours
Manages medical care and health needs.
No contractors work on this role.
Assists with medical care and medications.
No contractors work on this role.
Helps with daily care and mobility.
No contractors work on this role.
Total hours from contractors
4,271 contractor hours this quarter
| Certified Nursing Assistant | 70 | 0 | 70 | 20,490 | 91 | 100% | 8.9 |
| Registered Nurse | 30 | 0 | 30 | 8,229 | 91 | 100% | 9.4 |
| Licensed Practical Nurse | 20 | 0 | 20 | 6,234 | 91 | 100% | 10 |
| Speech Language Pathologist | 0 | 8 | 8 | 1,135 | 86 | 95% | 5.8 |
| Dietitian | 2 | 0 | 2 | 1,009 | 91 | 100% | 7.9 |
| Clinical Nurse Specialist | 2 | 0 | 2 | 1,000 | 65 | 71% | 8 |
| Respiratory Therapy Technician | 0 | 7 | 7 | 985 | 86 | 95% | 4.7 |
| Physical Therapy Assistant | 0 | 2 | 2 | 728 | 87 | 96% | 6.7 |
| RN Director of Nursing | 2 | 0 | 2 | 718 | 91 | 100% | 7.2 |
| Physical Therapy Aide | 0 | 2 | 2 | 688 | 63 | 69% | 7 |
| Nurse Practitioner | 1 | 0 | 1 | 512 | 64 | 70% | 8 |
| Mental Health Service Worker | 1 | 0 | 1 | 504 | 63 | 69% | 8 |
| Administrator | 1 | 0 | 1 | 496 | 62 | 68% | 8 |
| Other Dietary Services Staff | 2 | 0 | 2 | 488 | 61 | 67% | 7.8 |
| Occupational Therapy Aide | 1 | 1 | 2 | 460 | 60 | 66% | 7.5 |
| Dental Services Staff | 1 | 0 | 1 | 441 | 50 | 55% | 8.8 |
| Qualified Social Worker | 0 | 3 | 3 | 385 | 56 | 62% | 6.9 |
| Therapeutic Recreation Specialist | 0 | 1 | 1 | 227 | 34 | 37% | 6.7 |
| Occupational Therapy Assistant | 0 | 1 | 1 | 88 | 13 | 14% | 6.8 |
| Medical Director | 0 | 1 | 1 | 30 | 19 | 21% | 1.6 |
| Other Physician | 0 | 1 | 1 | 2 | 2 | 2% | 1 |
Source: CMS Long-Term Care Facility Characteristics (Data as of Jan 2026)
Residents meet regularly to discuss policies, care quality, and activities
Part of a Continuing Care Retirement Community offering multiple care levels
Organized group of residents that meets regularly to discuss facility policies, quality of life, and activities.
Data sourced from CMS Long-Term Care Facility Characteristics quarterly report. Payer mix reflects the current resident census by primary payment source.
These measures show how residents usually do over time at this home, based on health outcomes and preventive care.
Arizona average: 7.6
Arizona average: 16.1
Arizona average: 11.2%
Arizona average: 15.8%
Arizona average: 20.8%
Arizona average: 2.1%
Arizona average: 5.1%
Arizona average: 1.3%
Arizona average: 5.4%
Arizona average: 4.5%
Arizona average: 10.3%
Arizona average: 97.2%
Arizona average: 94.6%
Arizona average: 1.68
Arizona average: 1.48
Arizona average: 91.5%
Arizona average: 1.0%
Arizona average: 87.3%
Arizona average: 24.6%
Arizona average: 10.7%
Arizona average: 0.8%
Arizona average: 53.7%
Arizona average: 50.6%
Quality measures are calculated from Minimum Data Set (MDS) assessments. For most measures, lower percentages indicate better care quality.
Historical financial and operational data for Acacia Health Center at Sagewood based on CMS SNF Cost Reports.
Loading trend charts...
Care Cost Calculator: See Prices in Your Area
Nursing Home Data Explorer
Don’t Wait Too Long: 7 Red Flag Signs Your Parent Needs Assisted Living Now
The True Cost of Assisted Living in 2025 – And How Families Are Paying For It
Understanding Senior Living Costs: Pricing Models, Discounts & Financial Assistance

Touring a community? Use this expert-backed checklist to stay organized, ask the right questions, and find the perfect fit.
We'll send you a PDF version of the touring checklist.


