A&E HOMECARE II
Nursing Home, Assisted Living & Memory Care · Maryland, MD
CMS overall rating Info CMS (the Centers for Medicare & Medicaid Services) is the federal agency that rates nursing home quality. Its Overall Rating runs from 1 to 5 stars, combining health inspections, staffing, and quality measures, with inspections weighted most heavily.

A&E HOMECARE II

Nursing Home, Assisted Living & Memory Care · Maryland, MD
CMS overall rating Info CMS (the Centers for Medicare & Medicaid Services) is the federal agency that rates nursing home quality. Its Overall Rating runs from 1 to 5 stars, combining health inspections, staffing, and quality measures, with inspections weighted most heavily.
Calculator: See prices in your area
A&E HOMECARE II accepts Medicare and private pay.

Overview of A&e Homecare II

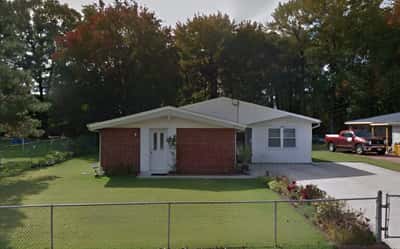
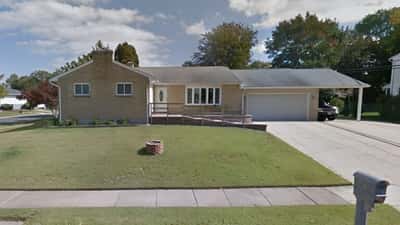
Nestled in the serene area of Glen Burnie, MD, A&E HOMECARE II is a blissful community designed to provide a tight-knit setting for assisted living. Residents here enjoy personalized care and authentic one-on-one attention from a 24/7 team of well-trained caregivers. The community strives to help them maintain their independence with the comfort of having assistance with their everyday activities like personal care and housekeeping.

Encouraging an active living experience, the community provides an array of activities based on residents’ unique preferences and skills. Meals are both delectable and nourishing, giving residents the energy they need to stay active. Enjoy the retirement life you’ve always envisioned amidst a safe and supportive environment with A&E HOMECARE II.

(410) 761-3798

Quality ratings

Measured by Centers for Medicare & Medicaid Services (CMS)

Overall rating Info The Overall CMS Rating combines results from health inspections, staffing levels and quality measures. Health inspections carry the most weight. Staffing and quality scores can increase or decrease the final rating based on performance compared to state and national standards.
▲ 31.5% Above MD avg. ▲ 31.5% Above MD avg.Click the badge to see the full State ranking.Click here to see the full State ranking.
Health Inspection Info Based on the results of the facility's three most recent standard inspections and any complaint investigations. CMS reviews the number, scope, and severity of deficiencies, with more recent findings weighted more heavily.
▲ 6.5% Above MD avg. ▲ 6.5% Above MD avg.Click the badge to see the full State ranking.Click here to see the full State ranking.
Staffing Info Measures average nursing staff hours per resident per day, including Registered Nurses (RNs) and total nursing staff. Ratings are adjusted based on the level of care residents require and are compared to state and national benchmarks.
At MD avg. At MD avg.Click the badge to see the full State ranking.Click here to see the full State ranking.
Quality Measures Info Based on clinical and physical health indicators reported to CMS, such as hospital readmissions, falls, pressure ulcers, and improvements in mobility. These measures reflect how well residents' health needs are being managed.
▲ 35.3% Above MD avg. ▲ 35.3% Above MD avg.Click the badge to see the full State ranking.Click here to see the full State ranking.

Staffing hours breakdown

Info Daily nursing hours per resident by staff type, reported to CMS. Higher is generally better — compare this facility to state and national averages to see where staffing stands.

Hours per resident per day — compared to Maryland state averages

Total nursing care / resident Info This home is ranked 128th out of 144 homes in Maryland for nurse hours. Total adjusted nursing hours per resident per day, combining RN, LPN, and aide time. CMS adjusts this for case-mix so facilities can be fairly compared.
3h 2m per day
Rank #128 / 144Nurse hours — State benchmarkedThis home is ranked 128th out of 144 homes in Maryland. Shows adjusted nurse hours per resident per day benchmarked to the Maryland average, with a ranking across 144 Maryland facilities. More hours mean more direct care. The national average is about 3.5 hrs; below 3.0 is a red flag.Click the rank badge to see the full State ranking.Click here to see the full State ranking.
This facility Maryland avg (3h 46m per day)
vs Maryland avg
-20%

1 of 6 metrics below state avg

Standout metric Weekend RN is +85% above state avg
Staff typeHours / Day / Residentvs state avg
Registered Nurse (RN) Info RNs hold the highest nursing license and can assess residents, interpret test results, and direct care plans. More RN hours per day often signals stronger clinical oversight and faster response to health changes. 1h 18m per day ▲ 58% State avg: 49m per day · National avg: 41m per day
LPN / LVN Info Licensed Practical Nurses (LPNs) or Licensed Vocational Nurses (LVNs) deliver routine hands-on care — medication administration, wound dressing, and monitoring vital signs. They work under RN supervision and make up a large share of daily bedside care. 1h 0m per day ▲ 11% State avg: 55m per day · National avg: 52m per day
Nurse Aide Info Certified Nurse Aides (CNAs) provide the most direct day-to-day assistance: bathing, dressing, feeding, and mobility. Nurse aide hours are typically the largest staffing category and directly affect residents' quality of life. 2h 20m per day ▲ 9% State avg: 2h 8m per day · National avg: 2h 20m per day
Weekend Total Nursing Info Combined nursing hours (RN + LPN + Nurse Aide) per resident per day on weekends. Staffing often drops on weekends — this figure reveals whether the facility maintains adequate coverage outside of weekday hours. 4h 12m per day ▲ 20% State avg: 3h 31m per day · National avg: 3h 27m per day
Physical Therapist Info Hours per resident per day provided by licensed Physical Therapists (PTs) or PT Assistants. PT services help residents recover mobility after injury or illness and are especially important for post-acute (short-stay) rehabilitation. 3m per day ▼ 56% State avg: 6m per day · National avg: 4m per day
Weekend RN Info Registered nurse hours specifically on weekends. Facilities sometimes reduce RN presence on Saturdays and Sundays — a low weekend RN figure compared to weekday hours can indicate reduced clinical oversight when most administrative staff are absent. 1h 8m per day ▲ 85% State avg: 37m per day · National avg: 29m per day

Capacity and availability

This home usually has limited availability

Higher occupancy than the Maryland average: 82.4%
Occupancy rate
87.2% Rank #59 / 146Occupancy rate — State benchmarkedThis home is ranked 59th out of 146 homes in Maryland. Shows this facility's occupancy rate versus the Maryland average, with its Statewide rank out of 146. Higher occupancy signals strong local demand and financial stability.Click the rank badge to see the full State ranking.Click here to see the full State ranking.
Avg. Length of Stay
425 days
Bed community size
5-bed community Rank #436 / 697Bed count — State benchmarkedThis home is ranked 436th out of 697 homes in Maryland. Shows this facility's certified or reported bed count compared to other Maryland facilities. Larger communities may offer more amenities, programs, and on-site services for residents and families.Click the rank badge to see the full State ranking.Click here to see the full State ranking.
A smaller, more intimate setting that may offer a quieter environment and closer staff-resident interactions.
Walk Score
Walk Score: 38 / 100 Rank #542 / 985Walk Score — State benchmarkedThis home is ranked 542nd out of 985 homes in Maryland. Shows how walkable this facility's neighborhood is compared to the average Walk Score across Maryland facilities. Higher scores benefit residents, families, and staff.Click the rank badge to see the full State ranking.Click here to see the full State ranking.
Somewhat walkable. A few nearby services may be reachable on foot, but most trips require transportation.

About this community

License Details

CountyAnne Arundel

Contact A&E HOMECARE II

Inspection History

In Maryland, the Department of Health, Office of Health Care Quality is the state agency that conducts unannounced inspections and issues reports for all assisted living and nursing facilities.

Inspection Scorecard Info This scorecard compares key inspection, citation, and complaint metrics at this facility against the Maryland state average. Metrics rated ≥15% worse than average are highlighted in red; those ≥15% better are highlighted in green.

Overall vs. MD average 0 Worse No metrics in this bucket. 0 Better No metrics in this bucket.

Citations Info Citations are formal regulatory issues recorded during state inspections.

This FacilityMD Averagevs. MD Avg
Total citations Info Formal regulatory issues recorded by inspectors across all inspection types. 7

Health Inspection History

Inspections since 2017
Total health inspections 5

Maryland average 3.9


Last Health inspection on Jul 2025

Total health citations
48 Rank #90 / 146Health citations — State benchmarkedThis home is ranked 90th out of 146 homes in Maryland. Shows this facility's total health deficiency citations benchmarked to the Maryland State average, with a ranking across all 146 MD facilities. Lower citation counts earn a better rank.Click the rank badge to see the full State ranking.Click here to see the full State ranking.

Maryland average 49.9

Citations per inspection
9.6 Rank #53 / 146Citations per inspection — State benchmarkedThis home is ranked 53rd out of 146 homes in Maryland. Shows average deficiency citations per CMS inspection for this facility versus the Maryland mean across 146 facilities with citation data. Lower is better.Click the rank badge to see the full State ranking.Click here to see the full State ranking.

Maryland average 12.81


Health citations are formal notices following inspections when they fail to comply with safety and care standards.

35 of 48 citations resulted from standard inspections; 9 of 48 resulted from complaint investigations; and 4 of 48 came from combined inspections (standard and complaint).

Breakdown of citation severity (last 9 years)
Critical health citations
0
100% better than Maryland average

Maryland average: 0.5


Serious health citations
2
233% worse than Maryland average

Maryland average: 0.6

0 critical citations Maryland average: 0.5

2 serious citations Maryland average: 0.6

45 moderate citations Maryland average: 47.2

1 minor citation Maryland average: 1.7
Citations history (last 9 years)
Quality of Care serious citation Jul 22, 2025
Corrected

Abuse/Neglect moderate citation Jun 16, 2023
Corrected

Abuse/Neglect moderate citation Jun 16, 2023
Corrected

Infection Control moderate citation Jun 16, 2023
Corrected

Demographics

Resident demographic information for this facility.

Gender

  • Female 0%
  • Male 0%

Staffing Data

Reporting period: October 1 – December 31, 2025 (Q4 2025). Source: CMS Payroll-Based Journal report.

Total staff 503
Employees 272
Contractors 231
Staff to resident ratio 2.98 : 1
64% more staff per resident than Maryland average
Maryland average ratio: 1.81 : 1 Maryland average ratio: 1.81 : 1See full Maryland ranking
Avg staff/day 128
Average shift 7.8 hours
0% compared with Maryland average
Maryland average: 8 hours Maryland average shift: 8 hoursSee full Maryland ranking
Total staff hours (quarter) 91,388

Nursing staff breakdown

Q4 2025 · Oct 1 – Dec 31 More info This data comes from the CMS Payroll-Based Journal report covering October 1 – December 31, 2025.
Registered Nurse

Manages medical care and health needs.

RN Staff Info 133 total: 38 full-time employees and 95 contractors. 133
Average shift length Info Average shift length. Calculated as total hours divided by days worked and average staff per day. 7.6 hours
Licensed Practical Nurse

Assists with medical care and medications.

LPN Staff Info 50 total: 39 full-time employees and 11 contractors. 50
Average shift length Info Average shift length. Calculated as total hours divided by days worked and average staff per day. 9.2 hours
Certified Nursing Assistant

Helps with daily care and mobility.

CNA Staff Info 213 total: 105 full-time employees and 108 contractors. 213
Average shift length Info Average shift length. Calculated as total hours divided by days worked and average staff per day. 7.2 hours

Contractor staffing

Q4 2025 · Oct 1 – Dec 31 More info This data comes from the CMS Payroll-Based Journal report covering October 1 – December 31, 2025.

Total hours from contractors

11%

10,055 contractor hours this quarter

Certified Nursing Assistant: 108 Registered Nurse: 95 Qualified Activities Professional: 15 Licensed Practical Nurse: 11 Medical Director: 1 Occupational Therapy Assistant: 1

Staff by category

Q4 2025 · Oct 1 – Dec 31 More info This data comes from the CMS Payroll-Based Journal report covering October 1 – December 31, 2025.
Certified Nursing Assistant10510821335,80292100%7.2
Registered Nurse389513317,89692100%7.6
Licensed Practical Nurse39115015,95092100%9.2
Qualified Activities Professional2715428,48692100%8.9
Other Dietary Services Staff5051,98892100%7.4
Clinical Nurse Specialist120121,7287278%7.1
Medication Aide/Technician4041,1878795%8.7
Speech Language Pathologist6061,1037885%7.4
Dental Services Staff4041,0136874%7.2
Nurse Practitioner2029846470%8
Physical Therapy Aide3039577177%7.7
Physical Therapy Assistant7079477582%6.4
Occupational Therapy Aide2029046267%8
Respiratory Therapy Technician9096807076%7.4
Qualified Social Worker7076476368%5.7
Administrator1015046368%8
Dietitian1014405560%8
Occupational Therapy Assistant011951213%7.9
Medical Director011781314%6
213 Certified Nursing Assistant
% of Days 100%
133 Registered Nurse
% of Days 100%
50 Licensed Practical Nurse
% of Days 100%
42 Qualified Activities Professional
% of Days 100%
5 Other Dietary Services Staff
% of Days 100%
12 Clinical Nurse Specialist
% of Days 78%
4 Medication Aide/Technician
% of Days 95%
6 Speech Language Pathologist
% of Days 85%
4 Dental Services Staff
% of Days 74%
2 Nurse Practitioner
% of Days 70%
3 Physical Therapy Aide
% of Days 77%
7 Physical Therapy Assistant
% of Days 82%
2 Occupational Therapy Aide
% of Days 67%
9 Respiratory Therapy Technician
% of Days 76%
7 Qualified Social Worker
% of Days 68%
1 Administrator
% of Days 68%
1 Dietitian
% of Days 60%
1 Occupational Therapy Assistant
% of Days 13%
1 Medical Director
% of Days 14%

Penalties and fines

Includes penalties issued in 2025

Federal penalties imposed by CMS for regulatory violations, including civil money penalties (fines) and denials of payment for new Medicare/Medicaid admissions.

Source: CMS Penalties Database (Data as of Jan 2026)

Total fines amount $8K Rank #119 / 146Federal fines — State benchmarkedThis home is ranked 119th out of 146 homes in Maryland. Shows this facility's cumulative CMS federal fine dollars versus the Maryland average among facilities with fines, and where it ranks among 146 facilities in the pool. Lower total dollars mean a better rank.Click the rank badge to see the full State ranking.Click here to see the full State ranking.
87% lower than Maryland average

Maryland average: $61K

Number of fines 1
33% fewer fines than Maryland average

Maryland average: 1.5

Payment Denials Info Serious action where Medicare and/or Medicaid temporarily stops payments for new residents until issues are fixed. 0
100% fewer payment denials than Maryland average

Maryland average: 0.1

Fines amount comparison
This facility $8K
Maryland average $61K
Penalty History

Penalties are imposed by CMS for violations of federal nursing home regulations.

1 penalty in the past 3 years

Jul 22, 2025 · $8K

Civil Money Penalty Info Fines imposed for noncompliance, which can be assessed per day or per instance of violation. Jul 22, 2025
$8K

Last updated: Jan 2026

Quality of care over time

These measures show how residents usually do over time at this home, based on health outcomes and preventive care.

High-risk clinical events score Info A composite score based on pressure ulcers, falls with injury, weight loss, walking ability decline, and activities of daily living decline. 13.2
In line with Maryland average

Maryland average: 12.9

Functional decline score Info A composite score based on activities of daily living decline, walking ability decline, and incontinence. 24.9
In line with Maryland average

Maryland average: 25.7

Long-stay resident measures
Need for Help with Daily Activities Increased Info Percent of long-stay residents whose need for help with daily activities has increased 20.6%
13% better than Maryland average

Maryland average: 23.7%

Walking Ability Worsened Info Percent of long-stay residents whose ability to move independently worsened 29.5%
6% worse than Maryland average

Maryland average: 27.7%

Low Risk Residents with Bowel/Bladder Incontinence Info Percent of low risk long-stay residents who lose control of their bowels or bladder 24.5%
6% better than Maryland average

Maryland average: 25.9%

Falls with Major Injury Info Percent of long-stay residents experiencing one or more falls with major injury 1.5%
35% better than Maryland average

Maryland average: 2.3%

High Risk Residents with Pressure Ulcers Info Percent of long-stay high risk residents with pressure ulcers 11.1%
71% worse than Maryland average

Maryland average: 6.5%

Urinary Tract Infection Info Percent of long-stay residents with a urinary tract infection 2.3%
44% worse than Maryland average

Maryland average: 1.6%

Lost Too Much Weight Info Percent of long-stay residents who lose too much weight 3.4%
41% better than Maryland average

Maryland average: 5.8%

Depressive Symptoms Info Percent of long-stay residents who have depressive symptoms 22.8%
13% worse than Maryland average

Maryland average: 20.2%

Antipsychotic Use Info Percent of long-stay residents who received an antipsychotic medication 9.3%
28% better than Maryland average

Maryland average: 12.9%

Pneumococcal Vaccine Info Percent of long-stay residents assessed and appropriately given the pneumococcal vaccine 97.5%
6% better than Maryland average

Maryland average: 92.0%

Influenza Vaccine Info Percent of long-stay residents assessed and appropriately given the seasonal influenza vaccine 98.2%
In line with Maryland average

Maryland average: 96.6%

Short-stay resident measures
Pneumococcal Vaccine Info Percent of short-stay residents assessed and appropriately given the pneumococcal vaccine 83.4%
6% better than Maryland average

Maryland average: 78.4%

Antipsychotic medication increase Info Percent of short-stay residents who newly received an antipsychotic medication 1.2%
14% better than Maryland average

Maryland average: 1.4%

Influenza Vaccine Info Percent of short-stay residents assessed and appropriately given the seasonal influenza vaccine 86.5%
7% better than Maryland average

Maryland average: 80.6%

Breakdown by payment type

Medicare

80% of new residents, usually for short-term rehab.

Typical stay 1 - 2 months

Private pay

20% of new residents, often for short stays.

Typical stay 5 - 6 years

Facility Characteristics

Source: CMS Long-Term Care Facility Characteristics (Data as of Jan 2026)

Total residents 169
Medicare
10
5.9% of residents
Medicaid
136
80.5% of residents
Private pay or other
23
13.6% of residents
Programs & Services
Residents Group

Residents meet regularly to discuss policies, care quality, and activities

Family Member Group

Family members meet regularly to discuss policies, care quality, and activities

Active Family Council

Organized group of family members that meets regularly to discuss facility policies, resident care, and activities.

Active Resident Council

Organized group of residents that meets regularly to discuss facility policies, quality of life, and activities.

Finances and operations

Privately-owned community
Operated by a single business entity.
Home revenue
$31.6M
Operating loss
-$40.7K
Privately-owned community Operated by a single business entity.
Home revenue
$31.6M Rank #22 / 145Revenue — State benchmarkedThis home is ranked 22nd out of 145 homes in Maryland. Shows this facility's annual revenue compared to the Maryland average. Higher revenue generally means more resources for staffing and capital — read alongside Payroll %.Click the rank badge to see the full State ranking.Click here to see the full State ranking.
Operating loss
-$40.7K
Payroll costs Info The portion of the home's budget spent on staff, including nurses, caregivers, and other employees who support care and operations. Rank #11 / 145Payroll — State benchmarkedThis home is ranked 11th out of 145 homes in Maryland. Shows total annual staff payroll benchmarked to the Maryland average. Higher payroll investment relative to peers often signals better staffing and less reliance on cheaper contract labor.Click the rank badge to see the full State ranking.Click here to see the full State ranking.
$17.7M
55.9% of revenue Rank #20 / 145Payroll % — State benchmarkedThis home is ranked 20th out of 145 homes in Maryland. Shows payroll as a percentage of revenue versus the Maryland average. Well-run Maryland facilities typically land around 49–57% — the top third Statewide. Below 25% may signal understaffing or heavy agency use — read with Staffing ratings.Click the rank badge to see the full State ranking.Click here to see the full State ranking.
Other operating costs Info All remaining costs needed to run the home, such as food, utilities, building maintenance, supplies and administrative expenses.
$14.0M
Total costs $31.6M

What does this home offer?

Housing options icon

Housing Options: Private / Shared Rooms

Building type icon
Building type icon

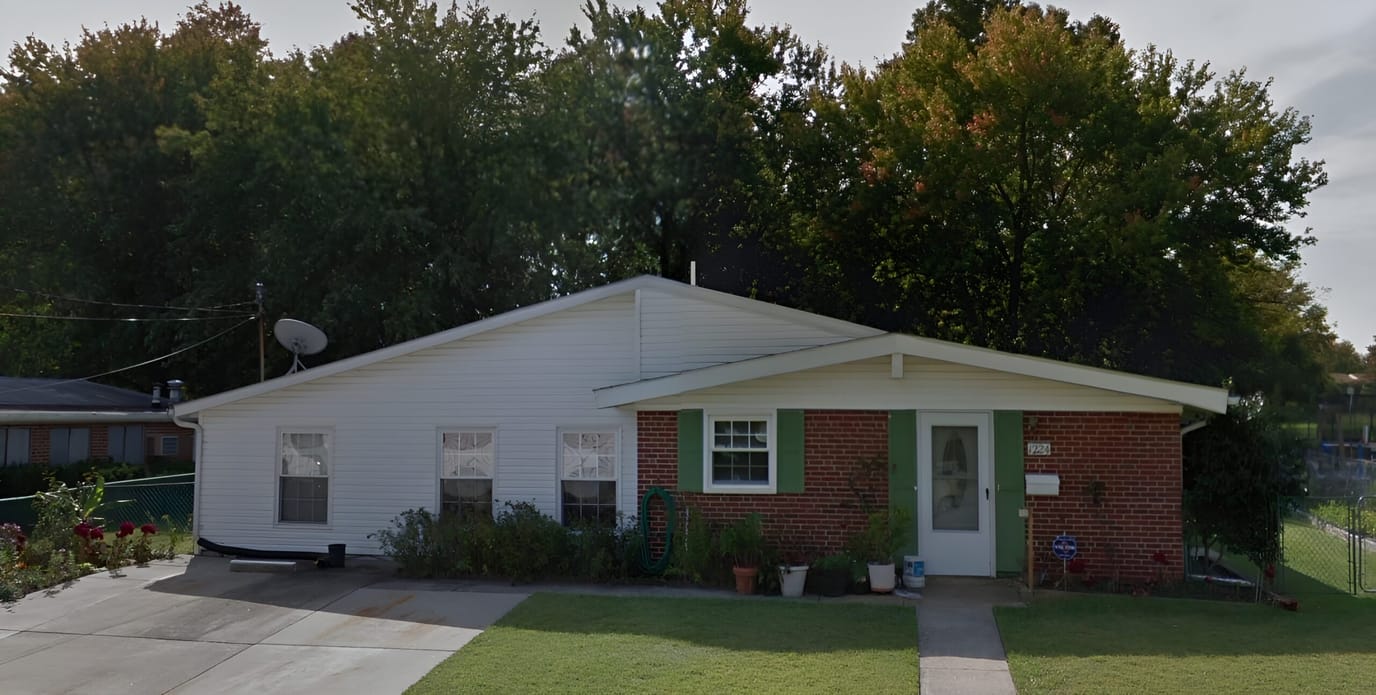
Building Type: Single-story

Transportation services icon

Transportation Services

Beauty services icon

Beauty Services

Housekeeping icon
Housekeeping icon

Housekeeping Services

Exercise program icon

Exercise Programs

Recreational activities icon

Recreational Activities

Who this home usually serves

TYPE OF STAY

Mostly short-term rehab stays

Most residents typically stay for a few weeks or months before returning home or moving on.

Places of interest near A&E HOMECARE II

Address 1.7 miles from city center Info Estimated distance in miles from Glen Burnie's city center to A&E HOMECARE II's address, calculated via Google Maps.

Calculate Travel Distance to A&E HOMECARE II

Add your location

Address

Financial Assistance for
Nursing Home in Maryland

A&E HOMECARE II is located in Glen Burnie, Maryland.
Here are the financial assistance programs available to residents in Maryland.

Get Financial aid guidance

Community Options Waiver

Maryland Medicaid Community Options Waiver

Age 65+ or disabled
General Maryland resident, Medicaid- eligible, nursing home-level care need.
Income Limits (2025) ~$2,829/month 300% FBR, individual
Asset Limits $2,000 (individual), $3,000 (couple) (excludes home, car).
MD

High urban demand; rural outreach efforts.

Benefits
Personal care (5-7 hours/day, e.g., bathing, dressing) Respite care (up to 240 hours/year) Adult day care ($70/day) Home modifications ($1,500 avg.)

Senior Care Program

Maryland Senior Care

Age 65+
General Maryland resident, at risk of nursing home placement.
Income Limits ~$2,000/month individual, varies by county
Asset Limits $11,000 individual
MD

Limited funding; waitlists common in high-demand areas.

Benefits
In-home care (3-5 hours/week) Respite care (up to 10 days/year) Meals (~$6/meal) Transportation (~5 trips/month) Case management

Maryland Nursing Home Medicaid

Maryland Medical Assistance (Medicaid) Nursing Home Program

Age 65+
General Maryland resident, Medicaid-eligible, requires nursing home-level care.
Income Limits (2025) $943/month (individual); most income applied to care costs.
Asset Limits $2,500 (individual), $3,000 (couple); spousal protections up to $155,356.
MD

Home equity limit $636,000; estate recovery applies post-55.

Benefits
24/7 nursing care Meals Therapy Medications (unlimited per medical need)

Senior Assisted Living Subsidy Program

Maryland Senior Assisted Living Group Home Subsidy

Age 62+
General Maryland resident, in or moving to approved assisted living, low/moderate income.
Income Limits (2025) ~$34,000/year individual, varies by county
Asset Limits Not strict; prioritizes low-income.
MD

Not available statewide; facility must be licensed by MDH.

Benefits
Personal care Meals 24-hour supervision (up to $1,500/month subsidy typical)

Veterans Aid and Attendance (A&A) Benefit

Maryland VA Aid and Attendance

Age
General Wartime veteran/spouse, age 65+ or disabled, needs ADL help, Maryland resident.
Income Limits (2025) Net income minus medical expenses < $1,984/month individual with A&A
Asset Limits $155,356 net worth limit
MD

High veteran population in suburban/rural areas.

Benefits
Cash benefit ($1,478-$2,471/month, varies by status) for care costs

Senior Prescription Drug Assistance Program (SPDAP)

Maryland Senior Prescription Drug Assistance Program

Age 65+
General Maryland resident (6+ months), Medicare Part D enrolled.
Income Limits (2025) $48,560/year individual, 300% FPL
Asset Limits None specified.
MD

Supplements Medicare Part D; annual enrollment required.

Benefits
Up to $40/month premium subsidy Reducing drug costs

Medicare Savings Programs (MSP)

Maryland Medicare Savings Programs

Age 65+
General Maryland resident, Medicare Part A/B enrollee.
Income Limits (2025) $2,014/month (QMB), $2,706/month (SLMB/QI, individual).
Asset Limits $9,090 (individual), $13,630 (couple).
MD

Includes QMB, SLMB, QI categories.

Benefits
Covers premiums (up to $174.70/month Part B) Co-pays Deductibles

Community Personal Assistance Services (CPAS)

Maryland Medicaid Community Personal Assistance Services

Age 65+
General Maryland resident, Medicaid-eligible, needs ADL assistance.
Income Limits (2025) $943/month (individual); spend-down available.
Asset Limits $2,500 (individual), $3,000 (couple).
MD

Consumer-directed option allows hiring family caregivers.

Benefits
Personal care (hours vary, typically 20-30/week) Chores Nurse supervision

Frequently Asked Questions about A&E HOMECARE II

Is A&E HOMECARE II in a walkable area?

A&E HOMECARE II has a walk score of 38. Somewhat walkable. A few nearby services may be reachable on foot, but most trips require transportation.

How many beds does A&E HOMECARE II have?

A&E HOMECARE II has 5 beds.

Has A&E HOMECARE II had any recent deficiencies or citations?

A&E HOMECARE II has had 7 recently reported deficiencies.

Are there photos of A&E HOMECARE II?

Yes — there is 1 photo of A&E HOMECARE II in the photo gallery on this page.

What is the address of A&E HOMECARE II?

A&E HOMECARE II is located at 1224 Cathedral Drive, Glen Burnie, MD 21061.

What is the phone number of A&E HOMECARE II?

(410) 761-3798 will put you in contact with the team at A&E HOMECARE II.

What county is A&E HOMECARE II located in?

A&E HOMECARE II is in Anne Arundel County.

Guides for Better Senior Living

Care Cost Calculator: See Prices in Your Area

Nursing Home Data Explorer

Don’t Wait Too Long: 7 Red Flag Signs Your Parent Needs Assisted Living Now

The True Cost of Assisted Living in 2025 – And How Families Are Paying For It

Understanding Senior Living Costs: Pricing Models, Discounts & Financial Assistance

Explore Open Rooms
1 Contact details
2 What type of senior care service are you looking for?
3 What budget do you have in mind for senior care?
4 How soon do you need to find care?
5 Additional details

Thank you for your interest!

Our team will be in touch shortly to help with next steps.