


Total staff
135
Employees
117
Contractors
18


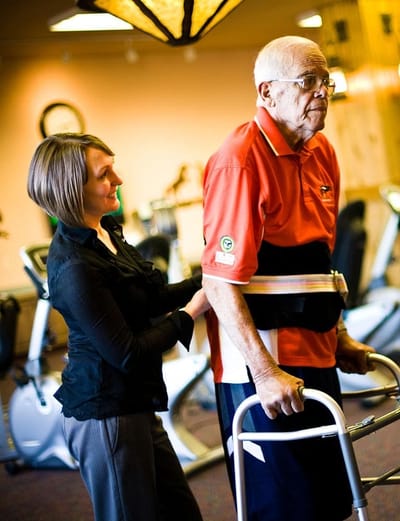


Ahc of Nashville is a skilled nursing home at 627 19th Avenue North in a highly walkable Nashville neighborhood where almost all daily errands are doable on foot. Owned and operated by AHC Nashville, it accepts Medicare and private pay to provide families with flexible coverage options for short-term rehabilitation and ongoing nursing care. With 49 beds and consistently full occupancy, it serves a focused population averaging a stay of 34 days, reflecting its emphasis on intensive rehabilitation services. The facility opened three years ago and specializes in inpatient rehabilitation, making it a grounded choice for patients healing from surgery, injury, or hospital stays needing skilled nursing support alongside structured therapy. It delivers 24-hour nursing care and staffing, and families can expect their loved ones to receive consistent daily attention and monitoring as they recover.
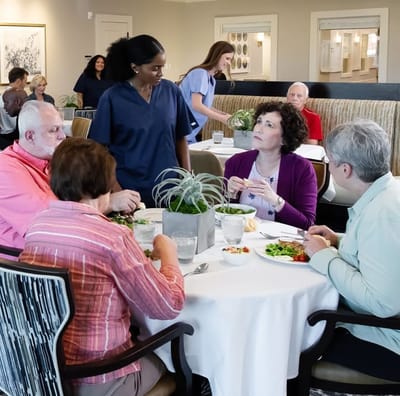
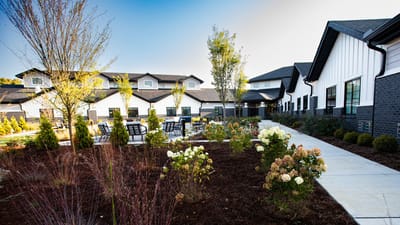
Patients benefit from private suites, not shared rooms, easing the stress of a hospital-like stay and providing space for family visits and personal belongings. A library and beauty salon let residents access familiar comforts during their stay. Transportation services for appointments and outings can help families coordinate care visits or manage ongoing medical needs. Dining mirrors an emphasis on wellness and comfort. Restaurant-style meals are prepared fresh and seasonally, with nutritional content and individual preferences built into each day’s menu. The private dining room and fine dining setting make meals a more social experience instead of a clinical one, which can matter for morale and appetite during recovery. The neighborhood location on a walkable street means visiting families can reach the home easily, and the immediate area provides access to shops, services, and parks.
For those choosing a short-term rehabilitation facility in Nashville, touring the facility’s private suites, therapy spaces, and dining areas paints a clear picture of the daily environment. It’s a pragmatic choice for patients recuperating from surgery, injury, or hospital stays who need skilled nursing support and structured therapy.
AHC of Nashville is administered by Connor Mcchurch.
In Tennessee, the Department of Health, Division of Health Care Facilities performs unannounced inspections and investigations to ensure facilities provide high-quality resident care.
Citations
| This Facility | TN Average | vs. TN Avg |
|---|---|---|---|
|
Total citations
| 0 | 4 | This facility has 100% fewer total citations than a typical Tennessee nursing home (0 vs. TN avg 4).↓ 100% better |
Reporting period: April 1 – June 30, 2025 (Q2 2025). Source: CMS Payroll-Based Journal report.
Manages medical care and health needs.
Assists with medical care and medications.
Helps with daily care and mobility.
Total hours from contractors
183 contractor hours this quarter
| Certified Nursing Assistant | 55 | 7 | 62 | 11,911 | 91 | 100% | 7.4 |
| Licensed Practical Nurse | 15 | 9 | 24 | 5,570 | 91 | 100% | 10.5 |
| Physical Therapy Aide | 7 | 0 | 7 | 1,590 | 88 | 97% | 8 |
| Respiratory Therapy Technician | 8 | 0 | 8 | 1,478 | 72 | 79% | 7.1 |
| Clinical Nurse Specialist | 8 | 0 | 8 | 1,452 | 80 | 88% | 9.8 |
| Physical Therapy Assistant | 3 | 0 | 3 | 1,343 | 75 | 82% | 7.8 |
| Speech Language Pathologist | 3 | 0 | 3 | 1,100 | 70 | 77% | 7.2 |
| Nurse Aide in Training | 4 | 0 | 4 | 771 | 67 | 74% | 10.3 |
| Nurse Practitioner | 2 | 0 | 2 | 640 | 66 | 73% | 8 |
| RN Director of Nursing | 3 | 0 | 3 | 526 | 72 | 79% | 6.9 |
| Administrator | 1 | 0 | 1 | 520 | 65 | 71% | 8 |
| Registered Nurse | 4 | 2 | 6 | 405 | 39 | 43% | 7.6 |
| Qualified Social Worker | 3 | 0 | 3 | 321 | 63 | 69% | 5 |
| Mental Health Service Worker | 1 | 0 | 1 | 9 | 2 | 2% | 4.5 |
Federal penalties imposed by CMS for regulatory violations, including civil money penalties (fines) and denials of payment for new Medicare/Medicaid admissions.
Source: CMS Penalties Database
No penalties in the past 3 years
No civil money penalties or payment denials were reported in the last 3 years.
90% of new residents, usually for short-term rehab.
10% of new residents, often for short stays.
Source: CMS Long-Term Care Facility Characteristics (Data as of Jan 2026)
Data sourced from CMS Long-Term Care Facility Characteristics quarterly report. Payer mix reflects the current resident census by primary payment source.
Historical financial and operational data for AHC of Nashville from 2023, based on CMS SNF Cost Reports.
Key figures below are for fiscal year ending in 12/2023.
Based on CMS SNF Cost Report for fiscal year ending in 12/2023.
Most residents typically stay for a few weeks or months before returning home or moving on.
Most new residents arrive under Medicare (90% of admissions), and a typical Medicare stay runs around 27 days.
Coverage residents most often arrive under.
Coverage residents most often leave under.
![]() 0.8 miles from city center
0.8 miles from city center
![]() Estimated distance in miles from Nashville's city center to AHC of Nashville's address, calculated via Google Maps.
Estimated distance in miles from Nashville's city center to AHC of Nashville's address, calculated via Google Maps.
Add your location
The information below is reported by the Tennessee Department of Health, Division of Health Care Facilities.
| West Meade Place LLP | NH SNF | Nashville (West Meade) | 120
Facility
120
TN AVG
88
Rank
#81 / 425 |
83.4%
Facility
83.4%
TN AVG
71.5
Rank
#82 / 272 | +17% | 2.93
Facility
2.93
TN AVG
3.63
Rank
#169 / 190 | +57% | -19% | $0
Facility
$0
TN AVG
$90.9k
Rank
#1 / 196 | 16
Facility
16
TN AVG
15.4
Rank
#103 / 194 | 5.3
Facility
5.3
TN AVG
4.4
Rank
#138 / 194 | - | 100 | A+ |
54
Facility
54
TN AVG
34
Rank
#99 / 551 | Barbara Friedbauer | $16.1MFiscal year ending 12/2023
Facility
$16.1MFiscal year ending 12/2023
TN AVG
$11.5M
Rank
#28 / 194 | $10.3MFiscal year ending 12/2023
Facility
$10.3MFiscal year ending 12/2023
TN AVG
$4.6M
Rank
#21 / 194 | 64.2%Fiscal year ending 12/2023
Facility
64.2%Fiscal year ending 12/2023
TN AVG
41%
Rank
#44 / 194 | 445203 | ||||
| NHC Place at the Trace | NH AL MC SNF | Nashville | 99
Facility
99
TN AVG
88
Rank
#150 / 425 |
82.8%
Facility
82.8%
TN AVG
71.5
Rank
#87 / 272 | +16% | 3.97
Facility
3.97
TN AVG
3.63
Rank
#35 / 190 | +90% | +9% | $0
Facility
$0
TN AVG
$90.9k
Rank
#1 / 196 | 14
Facility
14
TN AVG
15.4
Rank
#90 / 194 | 4.7
Facility
4.7
TN AVG
4.4
Rank
#112 / 194 | - | 82 | - |
16
Facility
16
TN AVG
34
Rank
#408 / 551 | - | $12.3MFiscal year ending 12/2023
Facility
$12.3MFiscal year ending 12/2023
TN AVG
$11.5M
Rank
#78 / 194 | $7.6MFiscal year ending 12/2023
Facility
$7.6MFiscal year ending 12/2023
TN AVG
$4.6M
Rank
#54 / 194 | 62%Fiscal year ending 12/2023
Facility
62%Fiscal year ending 12/2023
TN AVG
41%
Rank
#33 / 194 | 445525 | ||||
| The Health Center at Richland Place | NH AL IL SNF | Nashville (West Meade) | 107
Facility
107
TN AVG
88
Rank
#129 / 425 |
87.6%
Facility
87.6%
TN AVG
71.5
Rank
#55 / 272 | +23% | 4.18
Facility
4.18
TN AVG
3.63
Rank
#25 / 190 | +44% | +15% | $56.4k
Facility
$56.4k
TN AVG
$90.9k
Rank
#166 / 196 | 23
Facility
23
TN AVG
15.4
Rank
#153 / 194 | 4.6
Facility
4.6
TN AVG
4.4
Rank
#108 / 194 | 5 | 94 | - |
54
Facility
54
TN AVG
34
Rank
#99 / 551 | John Bailey | $18.7MFiscal year ending 12/2023
Facility
$18.7MFiscal year ending 12/2023
TN AVG
$11.5M
Rank
#15 / 194 | $10.3MFiscal year ending 12/2023
Facility
$10.3MFiscal year ending 12/2023
TN AVG
$4.6M
Rank
#24 / 194 | 55.1%Fiscal year ending 12/2023
Facility
55.1%Fiscal year ending 12/2023
TN AVG
41%
Rank
#102 / 194 | 445166 | ||||
| Trevecca Center for Rehabilitation and Healing | NH RC SNF | Nashville (South Nashville) | 240
Facility
240
TN AVG
88
Rank
#2 / 425 | - | - | 2.96
Facility
2.96
TN AVG
3.63
Rank
#160 / 190 | +43% | -18% | $9.3k
Facility
$9.3k
TN AVG
$90.9k
Rank
#140 / 196 | 15
Facility
15
TN AVG
15.4
Rank
#96 / 194 | 5.0
Facility
5.0
TN AVG
4.4
Rank
#120 / 194 | - | 45 | B- |
34
Facility
34
TN AVG
34
Rank
#279 / 551 | Trevecca Ventures Tn LLC | $25.8MFiscal year ending 12/2023
Facility
$25.8MFiscal year ending 12/2023
TN AVG
$11.5M
Rank
#18 / 194 | $12.8MFiscal year ending 12/2023
Facility
$12.8MFiscal year ending 12/2023
TN AVG
$4.6M
Rank
#5 / 194 | 49.6%Fiscal year ending 12/2023
Facility
49.6%Fiscal year ending 12/2023
TN AVG
41%
Rank
#6 / 194 | 445112 | ||||
| AHC of Nashville | - | NH SNF | North Nashville (Midtown) | 49
Facility
49
TN AVG
88
Rank
#351 / 425 | - | - | - | - | - | - | -50% | - | $125.5k
Facility
$125.5k
TN AVG
$90.9k
Rank
#181 / 196 | - | - | - | - | - |
78
Facility
78
TN AVG
34
Rank
#15 / 551 | - | $6.8MFiscal year ending 12/2023
Facility
$6.8MFiscal year ending 12/2023
TN AVG
$11.5M
Rank
#139 / 194 | $4.3MFiscal year ending 12/2023
Facility
$4.3MFiscal year ending 12/2023
TN AVG
$4.6M
Rank
#124 / 194 | 63.5%Fiscal year ending 12/2023
Facility
63.5%Fiscal year ending 12/2023
TN AVG
41%
Rank
#109 / 194 | 445538 |
AHC of Nashville is located in North Nashville, Tennessee.
Here are the financial assistance programs available to residents in Tennessee.
AHC of Nashville is in the Midtown neighborhood of Nashville.
AHC of Nashville is legally operated by AHC Nashville, LLC, and administered by Connor McChurch.
AHC of Nashville has a walk score of 78. Very walkable. Most errands can be accomplished on foot, and many essentials are within a short walk.
According to TN state health department records, AHC of Nashville's license number is 00000419.
According to TN state health department records, AHC of Nashville's license expires on July 11, 2026.
AHC of Nashville's occupancy is 318.5%.
No, AHC of Nashville has a no-pet policy.
Care Cost Calculator: See Prices in Your Area
Nursing Home Data Explorer
Don’t Wait Too Long: 7 Red Flag Signs Your Parent Needs Assisted Living Now
The True Cost of Assisted Living in 2025 – And How Families Are Paying For It
Understanding Senior Living Costs: Pricing Models, Discounts & Financial Assistance


