


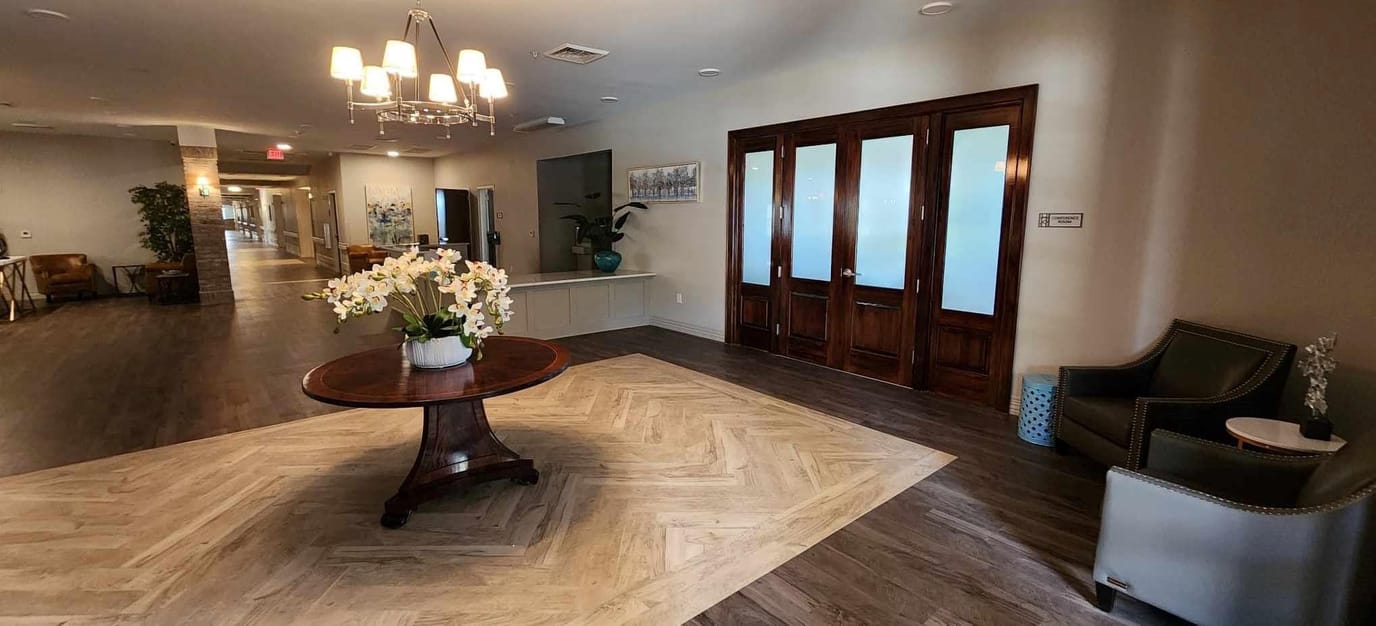


Allen Oaks Nursing and Rehab Center
Nursing Home, Memory Care & Skilled Nursing · Oakdale, LA
CMS overall rating Info CMS (the Centers for Medicare & Medicaid Services) is the federal agency that rates nursing home quality. Its Overall Rating runs from 1 to 5 stars, combining health inspections, staffing, and quality measures, with inspections weighted most heavily.

Allen Oaks Nursing and Rehab Center

Nursing Home, Memory Care & Skilled Nursing · Oakdale, LA
CMS overall rating Info CMS (the Centers for Medicare & Medicaid Services) is the federal agency that rates nursing home quality. Its Overall Rating runs from 1 to 5 stars, combining health inspections, staffing, and quality measures, with inspections weighted most heavily.
Calculator: See prices in your area
Allen Oaks Nursing and Rehab Center accepts Medicare, Medicaid, and private pay.

Overview of Allen Oaks Nursing and Rehab Center

Allen Oaks Nursing and Rehab Center is a 91-bed skilled nursing and rehabilitation facility located at 909 East 6th Avenue in Oakdale, Louisiana. Serving residents in Allen Parish, the facility is owned by Allen Health Care Partners LLC and accepts both Medicare and Medicaid.

The facility currently holds 2-star CMS sub-ratings for staffing and quality measures. Clinical performance for short-stay residents is mixed. The re-hospitalization rate of 17.0% is 39% better than the Louisiana average, and the facility reports zero falls with major injury among this group. However, short-stay emergency department visits are 25% higher than the state average, and the successful return-to-home rate of 45.6% is 10% below the state average. For long-stay residents, hospitalizations perform 26% better than the Louisiana average.

The Louisiana Department of Health, Health Standards Section, oversees the inspection of this facility. Allen Oaks holds a 2-star overall CMS rating and a 2-star health inspection sub-rating. No civil money penalties or payment denials appear in the available reports, and the facility maintains a citations-per-inspection rate of zero.

The campus provides rehabilitation services supported by a therapy gym. Confirmed amenities include semi-private rooms with ensuite bathrooms, a beauty parlor, a resident laundry room, and a dining room. The dining program offers buffet-style meals. Specific staffing ratios and monthly pricing are not reported in the available source data, so families should request these details during a tour.

This community suits families seeking rehabilitation-focused care with a lower-than-average re-hospitalization rate. Families evaluating Allen Oaks Nursing and Rehab Center should ask directly about protocols addressing short-stay emergency department utilization and discharge planning practices before making a placement decision.

Quality ratings

Measured by Centers for Medicare & Medicaid Services (CMS)

Overall rating Info The Overall CMS Rating combines results from health inspections, staffing levels and quality measures. Health inspections carry the most weight. Staffing and quality scores can increase or decrease the final rating based on performance compared to state and national standards.
Health Inspection Info Based on the results of the facility's three most recent standard inspections and any complaint investigations. CMS reviews the number, scope, and severity of deficiencies, with more recent findings weighted more heavily.
Staffing Info Measures average nursing staff hours per resident per day, including Registered Nurses (RNs) and total nursing staff. Ratings are adjusted based on the level of care residents require and are compared to state and national benchmarks.
Quality Measures Info Based on clinical and physical health indicators reported to CMS, such as hospital readmissions, falls, pressure ulcers, and improvements in mobility. These measures reflect how well residents' health needs are being managed.

Staffing hours breakdown

Info Daily nursing hours per resident by staff type, reported to CMS. Higher is generally better — compare this facility to state and national averages to see where staffing stands.

Hours per resident per day — compared to state averages

Total nursing care / resident Info Total adjusted nursing hours per resident per day, combining RN, LPN, and aide time. CMS adjusts this for case-mix so facilities can be fairly compared.
5h 31m per day
Rank #4 / 199Nurse hours — State benchmarkedThis home is ranked 4th out of 199 homes in Louisiana for Nurse Hours. Shows adjusted nurse hours per resident per day benchmarked to the Louisiana average, with a ranking across 199 Louisiana facilities. More hours mean more direct care. The national average is about 3.5 hrs; below 3.0 is a red flag.Facilities with the same value for a metric share the same rank. Rankings are based only on facilities in Louisiana that report data for that category. Facilities without available data are excluded from the ranking.Click the rank badge to see the full State ranking.Click here to see the full State ranking.
vs avg

0 of 1 metrics below state avg

Standout metric Weekend Total Nursing is +20% above state avg
Staff typeHours / Day / Residentvs state avg
Weekend Total Nursing Info Combined nursing hours (RN + LPN + Nurse Aide) per resident per day on weekends. Staffing often drops on weekends — this figure reveals whether the facility maintains adequate coverage outside of weekday hours. 3h 55m per day ▲ 20% State avg: 3h 16m per day · National avg: 3h 26m per day

Capacity and availability

Avg. Length of Stay Info Average number of days residents stay at this facility, based on CMS cost report data. Shorter stays often reflect post-acute or rehab care; longer stays reflect long-term care.
622 days
Bed community size
91-bed community Rank #188 / 261Bed count — State benchmarkedThis home is ranked 188th out of 261 homes in Louisiana for Bed Count. Shows this facility's certified or reported bed count compared to other Louisiana facilities. Larger communities may offer more amenities, programs, and on-site services for residents and families.Facilities with the same value for a metric share the same rank. Rankings are based only on facilities in Louisiana that report data for that category. Facilities without available data are excluded from the ranking.Click the rank badge to see the full State ranking.Click here to see the full State ranking.
A larger shared setting that may offer more common spaces and organized community services.
Walk Score
Walk Score: 35 / 100 Rank #195 / 368Walk Score — State benchmarkedThis home is ranked 195th out of 368 homes in Louisiana for Walk Score. Shows how walkable this facility's neighborhood is compared to the average Walk Score across Louisiana facilities. Higher scores benefit residents, families, and staff.Facilities with the same value for a metric share the same rank. Rankings are based only on facilities in Louisiana that report data for that category. Facilities without available data are excluded from the ranking.Click the rank badge to see the full State ranking.Click here to see the full State ranking.
Somewhat walkable. A few nearby services may be reachable on foot, but most trips require transportation.

About this community

Occupancy

Occupancy rate
84%
Rank #45 / 177Occupancy rate — State benchmarkedThis home is ranked 45th out of 177 homes in Louisiana for Occupancy. Shows this facility's occupancy rate versus the Louisiana average, with its Statewide rank out of 177. Higher occupancy signals strong local demand and financial stability.Facilities with the same value for a metric share the same rank. Rankings are based only on facilities in Louisiana that report data for that category. Facilities without available data are excluded from the ranking.Click the rank badge to see the full State ranking.Click here to see the full State ranking.
Higher than the Louisiana average: 71.8%
Occupied beds
76 / 91
Average occupied beds in Louisiana homes 89 beds

License Details

Facility TypeMedicare And Medicaid
CountyAllen

Ownership & Operating Entity

Owner NameAllen Health Care Partners LLC
Profit StatusFor-profit

Therapy & Rehabilitation

1 service
Rehabilitation Services

Additional Policies & Features

Pets not allowed

Amenities & Lifestyle

Semi-Private Rooms
Ensuite Bathrooms
State-Of-The-Art Therapy Gym
Dining Room
Beauty Parlor
Resident Laundry Room
ActivitiesDaily activities offered
Specific ProgramsFinancial / Rate Information, Choosing a Facility
Touring HoursMon-Sun: 8 am–5 pm

Performance summary

Key indicators of commitment to quality care and safety.

Ratings

Overall Rating
2 / 5

health inspections, staffing, and quality measures

Health Inspection Rating
2 / 5

health inspection findings. Fewer deficiencies result in higher ratings

Quality Measures Rating
2 / 5

resident health outcomes and care practices

Staffing Rating
2 / 5

staffing levels, including hours of care provided per resident per day

Contact Allen Oaks Nursing and Rehab Center

Inspection History

In Louisiana, the Department of Health, Health Standards Section performs unannounced onsite surveys to verify that healthcare providers meet both state licensing and federal safety rules.

Since 2023 · 3 years of data 35 deficiencies 7 inspections

Inspection Scorecard Info This scorecard compares key inspection, deficiency, and complaint metrics at this facility against the Louisiana state average. Metrics rated ≥15% worse than average are highlighted in red; those ≥15% better are highlighted in green.

Since 2023 vs. Louisiana state average
Overall vs. LA average 3 Worse Metrics worse than Louisiana average:
• Total deficiencies (9% above)
• Deficiencies per year (9% above)
• Deficiencies per inspection (9% above)
0 Better No metrics in this bucket.
Latest Inspection July 2, 2025 Routine

Deficiencies Info Deficiencies are formal regulatory issues recorded during state inspections.

This FacilityLA Averagevs. LA Avg
Total deficiencies Info Formal regulatory issues recorded by inspectors across all inspection types. 3532 This facility has 9% more total deficiencies than a typical Louisiana assisted living residence (35 vs. LA avg 32).↑ 9% worse
Deficiencies per year Info Average deficiencies per year since 2023. 11.710.7 This facility has 9% more deficiencies per year than a typical Louisiana assisted living residence (11.7 vs. LA avg 10.7).↑ 9% worse
Deficiencies per inspection Info Average deficiencies per inspection. 54.6 This facility has 9% more deficiencies per inspection than a typical Louisiana assisted living residence (5 vs. LA avg 4.6).↑ 9% worse

Inspections Info State inspections evaluate whether the facility meets health and safety standards.

This FacilityLA Averagevs. LA Avg
Total inspections Info Combined count of all routine and focused inspections. Excludes complaint investigations. 77 This facility has total inspections in line with the Louisiana average (7 vs. LA avg 7).— At avg

Penalties and fines

Federal penalties imposed by CMS for regulatory violations, including civil money penalties (fines) and denials of payment for new Medicare/Medicaid admissions.

Source: CMS Penalties Database

No penalties in the past 3 years

No civil money penalties or payment denials were reported in the last 3 years.

Quality of care over time

These measures show how residents usually do over time at this home, based on health outcomes and preventive care.

Long-stay resident measures
Below average Info CMS star rating based on long-stay quality measure performance. 5 stars = significantly above average, 1 star = significantly below average.
Hospitalizations per 1,000 days Info Number of hospitalizations per 1,000 long-stay resident days. 1.93
26% better than State average

State average: 2.61

ED visits per 1,000 days Info Number of outpatient emergency department visits per 1,000 long-stay resident days. 2.67
In line with State average

State average: 2.77

Short-stay resident measures
Below average Info CMS star rating based on short-stay quality measure performance. 5 stars = much above average, 1 star = much below average.
Re-hospitalized after SNF stay Info Percentage of short-stay residents who were re-hospitalized after their nursing home admission. 17.0%
39% better than State average

State average: 27.8%

Emergency department visits Info Percentage of short-stay residents who had an outpatient emergency department visit. 18.4%
25% worse than State average

State average: 14.7%

Falls with major injury Info Percentage of SNF residents who experience falls with major injury during their stay. 0.0%
100% better than State average

State average: 0.8%

Ability to care for self at discharge Info Percentage of residents at or above expected ability to care for themselves at discharge. 53.7%
In line with State average

State average: 53.7%

Successful return to home or community Info Rate of successful return to home or community from a skilled nursing facility. 45.6%
10% worse than State average

State average: 50.6%

Breakdown by payment type

Medicare

54% of new residents, usually for short-term rehab.

Typical stay 3 - 4 months

Private pay

17% of new residents, often for short stays.

Typical stay 1 - 2 years

Medicaid

29% of new residents, often for long-term daily care.

Typical stay 4 - 5 years

Finances and operations

Based on CMS SNF Cost Report for fiscal year ending in 12/2023.

For-profit
Operated by a single business entity.
Net patient revenue Info Net patient revenue — what the home actually collects for resident care, after contractual allowances, bad debt and discounts are subtracted from its gross charges (CMS cost report, Worksheet G-3). It covers resident care only; money the home earns from other sources is shown separately as "Other income."
$6.9M
Net patient income Info Net patient income: net patient revenue minus the home's total operating expenses. A positive figure means it earns more from resident care than it spends to deliver it; a negative figure means the opposite. It excludes non-operating "other income."
$510.6K
For-profit Operated by a single business entity.
Net patient revenue Info Net patient revenue — what the home actually collects for resident care, after contractual allowances, bad debt and discounts are subtracted from its gross charges (CMS cost report, Worksheet G-3). It covers resident care only; money the home earns from other sources is shown separately as "Other income."
$6.9M Rank #148 / 203Revenue — State benchmarkedThis home is ranked 148th out of 203 homes in Louisiana for Revenue. Shows this facility's annual revenue compared to the Louisiana average. Higher revenue generally means more resources for staffing and capital — read alongside Payroll %.Facilities with the same value for a metric share the same rank. Rankings are based only on facilities in Louisiana that report data for that category. Facilities without available data are excluded from the ranking.Click the rank badge to see the full State ranking.Click here to see the full State ranking.
Net patient income Info Net patient income: net patient revenue minus the home's total operating expenses. A positive figure means it earns more from resident care than it spends to deliver it; a negative figure means the opposite. It excludes non-operating "other income."
$510.6K
Other income Info Money the home earns outside of resident care — such as investments, grants, rentals and other non-operating sources (CMS cost report, Worksheet G-3). It is tracked separately from net patient revenue: it is not part of that figure, and it is not included in net patient income.
$387.4K
Payroll costs Info Staff salaries plus wage-related costs — benefits such as payroll taxes, health insurance and retirement — from the home's own accounting records (CMS cost report, Worksheet A). Contract or agency labor is counted separately, under other operating costs. Rank #180 / 203Payroll — State benchmarkedThis home is ranked 180th out of 203 homes in Louisiana for Payroll. Shows total annual staff payroll benchmarked to the Louisiana average. Higher payroll investment relative to peers often signals better staffing and less reliance on cheaper contract labor.Facilities with the same value for a metric share the same rank. Rankings are based only on facilities in Louisiana that report data for that category. Facilities without available data are excluded from the ranking.Click the rank badge to see the full State ranking.Click here to see the full State ranking.
$2.9M 41.6% of net patient revenue Info Payroll as a share of revenue: staff salaries and wage-related benefits divided by net patient revenue. A higher figure means more of each revenue dollar goes to staff pay. Rank #177 / 203Payroll % — State benchmarkedThis home is ranked 177th out of 203 homes in Louisiana for Payroll %. Shows payroll as a percentage of revenue versus the Louisiana average. Well-run Louisiana facilities typically land around 54–68% — the top third Statewide. Below 25% may signal understaffing or heavy agency use — read with Staffing ratings.Facilities with the same value for a metric share the same rank. Rankings are based only on facilities in Louisiana that report data for that category. Facilities without available data are excluded from the ranking.Click the rank badge to see the full State ranking.Click here to see the full State ranking.
Other operating costs Info Everything it costs to run the home apart from payroll — food, utilities, supplies, maintenance, contract labor and administration. Calculated as total operating expense minus payroll (staff salaries and wage-related benefits).
$3.5M
Total costs Info The home's total operating expense for the year — all the costs of running it, salaries included (CMS cost report, Worksheet G-3).
$6.4M

Who this home usually serves

TYPE OF STAY

Mostly short-term rehab stays

Most residents typically stay for a few weeks or months before returning home or moving on.

Most new residents arrive under Medicare (54% of admissions), and a typical Medicare stay runs around 3 - 4 months.

Admissions
41 total

Coverage residents most often arrive under.

Medicare 54%
Private pay 17%
Medicaid 29%
Discharges
41 total

Coverage residents most often leave under.

Medicare 46%
Private pay 17%
Medicaid 37%

Places of interest near Allen Oaks Nursing and Rehab Center

Address 0.4 miles from city center Info Estimated distance in miles from Oakdale's city center to Allen Oaks Nursing and Rehab Center's address, calculated via Google Maps.

Calculate Travel Distance to Allen Oaks Nursing and Rehab Center

Add your location

Address

Compare Nursing Homes around the area

The information below is reported by the Louisiana Department of Health, Health Standards Section.

The Lodge at Lane
NH
AL
MC
SNF
Zachary -39 A+ 33 -
Pelican Pointe Healthcare and Rehabilitation
NH
SNF
Maurice (Vermilion Parish) -120 A+ 30 -
Prairie Manor Nursing Home
NH
HOS
SNF
Pine Prairie (Evangeline Parish) -100 - 27 -
Chateau Terrebonne Health Care Center
NH
HOS
MC
PC
RC
SNF
Houma (Terrebonne Parish) -197 - 51 -

Frequently Asked Questions about Allen Oaks Nursing and Rehab Center

What neighborhood is Allen Oaks Nursing and Rehab Center in?

Allen Oaks Nursing and Rehab Center is in the Allen Parish neighborhood of OAKDALE.

Who is the owner of Allen Oaks Nursing and Rehab Center?

Allen Oaks Nursing and Rehab Center is legally operated by Allen Health Care Partners LLC.

Is Allen Oaks Nursing and Rehab Center in a walkable area?

Allen Oaks Nursing and Rehab Center has a walk score of 35. Somewhat walkable. A few nearby services may be reachable on foot, but most trips require transportation.

What is the occupancy rate at Allen Oaks Nursing and Rehab Center?

Allen Oaks Nursing and Rehab Center's occupancy is 84%.

Are pets allowed at Allen Oaks Nursing and Rehab Center?

No, Allen Oaks Nursing and Rehab Center has a no-pet policy.

Does Allen Oaks Nursing and Rehab Center operate as a for-profit or non-profit?

Allen Oaks Nursing and Rehab Center is registered as a for-profit in LA.

What is the overall rating for Allen Oaks Nursing and Rehab Center?

Allen Oaks Nursing and Rehab Center received a 2-star overall rating from the CMS (Centers for Medicare and Medicaid Services). This score combines results from staffing levels, quality measures, and health inspections.

Guides for Better Senior Living

Care Cost Calculator: See Prices in Your Area

Nursing Home Data Explorer

Don’t Wait Too Long: 7 Red Flag Signs Your Parent Needs Assisted Living Now

The True Cost of Assisted Living in 2025 – And How Families Are Paying For It

Understanding Senior Living Costs: Pricing Models, Discounts & Financial Assistance


