Anaheim Crest Nursing Center
CMS overall rating Info CMS (the Centers for Medicare & Medicaid Services) is the federal agency that rates nursing home quality. Its Overall Rating runs from 1 to 5 stars, combining health inspections, staffing, and quality measures, with inspections weighted most heavily.

Anaheim Crest Nursing Center

CMS overall rating Info CMS (the Centers for Medicare & Medicaid Services) is the federal agency that rates nursing home quality. Its Overall Rating runs from 1 to 5 stars, combining health inspections, staffing, and quality measures, with inspections weighted most heavily.
Calculator: See prices in your area
Anaheim Crest Nursing Center accepts Medicare and private pay.

Overview of Anaheim Crest Nursing Center

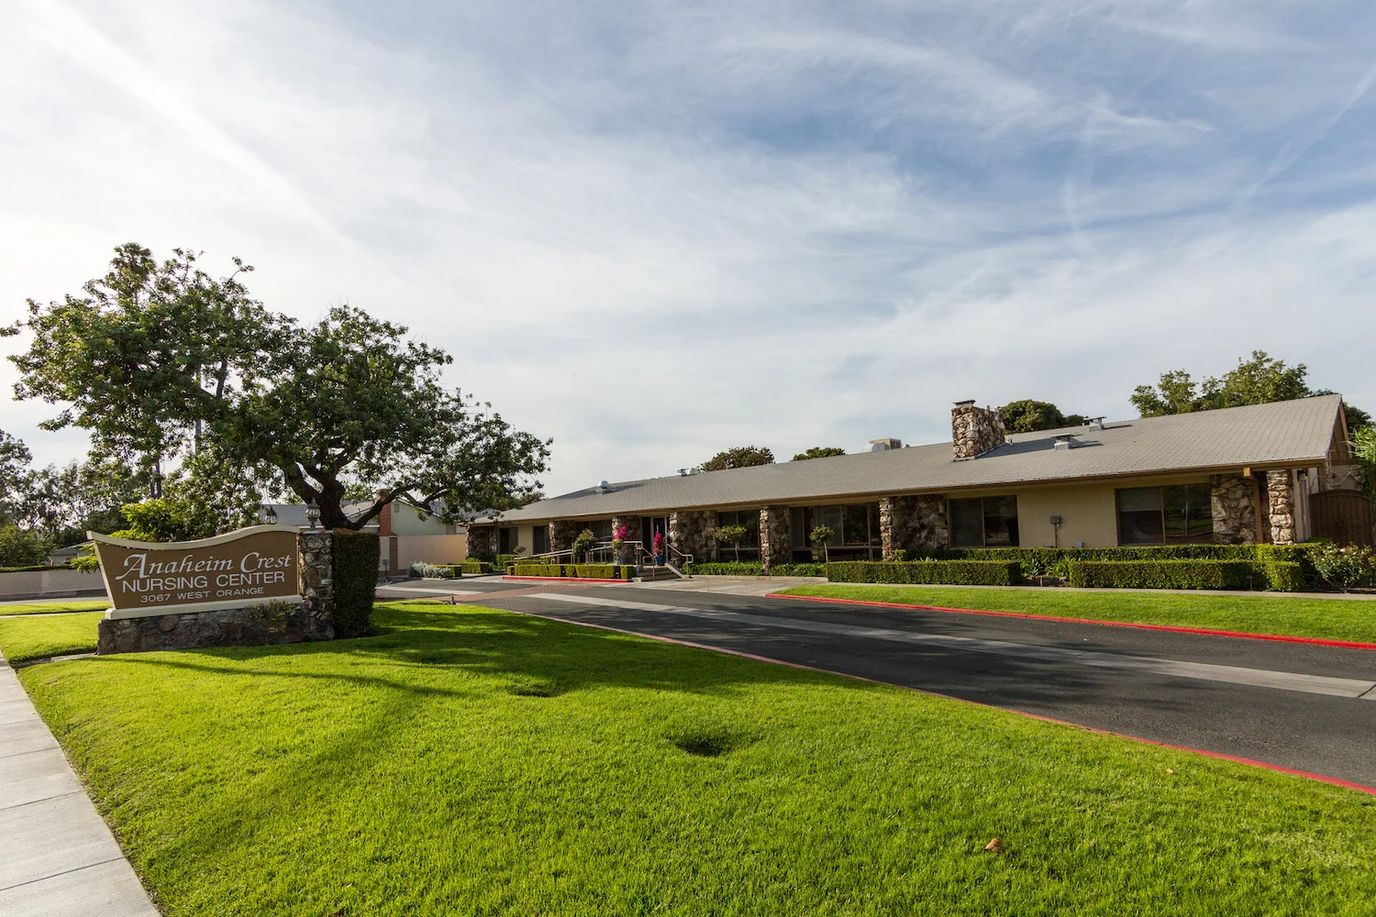
Anaheim Crest Nursing Center is a nursing home in Anaheim, CA, offering comprehensive skilled nursing and rehabilitation. With its supportive setting, the community ensures older adults are treated well during their stay. A specialized Korean care unit, therapies, and well-balanced meals are also provided to meet residents’ unique needs and preferences. Individualized care plans are also created for each resident to ensure their recovery and wellness.

Fun gatherings and recreational activities allow residents to make friends and gain meaningful experiences. Families are also encouraged to visit their loved ones to prevent loneliness. West Anaheim Medical Center, Anaheim Medical Plaza, and bus stops are also available in the area, providing residents with quick access to their necessities. Dedicated to older adults’ well-being, this nursing home is one of the best choices for senior living in California.

Quality ratings

Measured by Centers for Medicare & Medicaid Services (CMS)

Overall rating Info The Overall CMS Rating combines results from health inspections, staffing levels and quality measures. Health inspections carry the most weight. Staffing and quality scores can increase or decrease the final rating based on performance compared to state and national standards.
▲ 58.8% Above CA avg. ▲ 58.8% Above CA avg.CA average: 3.1Click the badge to see the full State ranking.Click here to see the full State ranking.
Health Inspection Info Based on the results of the facility's three most recent standard inspections and any complaint investigations. CMS reviews the number, scope, and severity of deficiencies, with more recent findings weighted more heavily.
▲ 43.0% Above CA avg. ▲ 43.0% Above CA avg.CA average: 2.8Click the badge to see the full State ranking.Click here to see the full State ranking.
Staffing Info Measures average nursing staff hours per resident per day, including Registered Nurses (RNs) and total nursing staff. Ratings are adjusted based on the level of care residents require and are compared to state and national benchmarks.
▼ 4.4% Below CA avg. ▼ 4.4% Below CA avg.CA average: 3.1Click the badge to see the full State ranking.Click here to see the full State ranking.
Quality Measures Info Based on clinical and physical health indicators reported to CMS, such as hospital readmissions, falls, pressure ulcers, and improvements in mobility. These measures reflect how well residents' health needs are being managed.
▲ 22.4% Above CA avg. ▲ 22.4% Above CA avg.CA average: 4.1Click the badge to see the full State ranking.Click here to see the full State ranking.

Staffing hours breakdown

Info Daily nursing hours per resident by staff type, reported to CMS. Higher is generally better — compare this facility to state and national averages to see where staffing stands.

Hours per resident per day — compared to California state averages

Total nursing care / resident Info This home is ranked 269th out of 354 homes in California for nurse hours. Total adjusted nursing hours per resident per day, combining RN, LPN, and aide time. CMS adjusts this for case-mix so facilities can be fairly compared.
3h 35m per day
Rank #269 / 354Nurse hours — State benchmarkedThis home is ranked 269th out of 354 homes in California. Shows adjusted nurse hours per resident per day benchmarked to the California average, with a ranking across 354 California facilities. More hours mean more direct care. The national average is about 3.5 hrs; below 3.0 is a red flag.Rankings are based only on facilities in California that report data for that category. Facilities without available data are excluded from the ranking.Click the rank badge to see the full State ranking.Click here to see the full State ranking.
This facility California avg (4h 13m per day)
vs California avg
-15%

4 of 6 metrics below state avg

Standout metric Physical Therapist is +50% above state avg
Staff typeHours / Day / Residentvs state avg
Registered Nurse (RN) Info RNs hold the highest nursing license and can assess residents, interpret test results, and direct care plans. More RN hours per day often signals stronger clinical oversight and faster response to health changes. 26m per day ▼ 32% State avg: 39m per day · National avg: 41m per day
LPN / LVN Info Licensed Practical Nurses (LPNs) or Licensed Vocational Nurses (LVNs) deliver routine hands-on care — medication administration, wound dressing, and monitoring vital signs. They work under RN supervision and make up a large share of daily bedside care. 1h 17m per day ▲ 5% State avg: 1h 13m per day · National avg: 52m per day
Nurse Aide Info Certified Nurse Aides (CNAs) provide the most direct day-to-day assistance: bathing, dressing, feeding, and mobility. Nurse aide hours are typically the largest staffing category and directly affect residents' quality of life. 2h 27m per day ▼ 7% State avg: 2h 39m per day · National avg: 2h 21m per day
Weekend Total Nursing Info Combined nursing hours (RN + LPN + Nurse Aide) per resident per day on weekends. Staffing often drops on weekends — this figure reveals whether the facility maintains adequate coverage outside of weekday hours. 3h 49m per day ▼ 6% State avg: 4h 5m per day · National avg: 3h 26m per day
Physical Therapist Info Hours per resident per day provided by licensed Physical Therapists (PTs) or PT Assistants. PT services help residents recover mobility after injury or illness and are especially important for post-acute (short-stay) rehabilitation. 7m per day ▲ 50% State avg: 5m per day · National avg: 4m per day
Weekend RN Info Registered nurse hours specifically on weekends. Facilities sometimes reduce RN presence on Saturdays and Sundays — a low weekend RN figure compared to weekday hours can indicate reduced clinical oversight when most administrative staff are absent. 17m per day ▼ 44% State avg: 30m per day · National avg: 29m per day

Capacity and availability

This home usually has limited availability

Higher occupancy than the California average: 84.7%
Occupancy rate
91.5% Rank #281 / 1537Occupancy rate — State benchmarkedThis home is ranked 281st out of 1537 homes in California. Shows this facility's occupancy rate versus the California average, with its Statewide rank out of 1537. Higher occupancy signals strong local demand and financial stability.Rankings are based only on facilities in California that report data for that category. Facilities without available data are excluded from the ranking.Click the rank badge to see the full State ranking.Click here to see the full State ranking.
Avg. Length of Stay
83 days
Bed community size
83-bed community Rank #897 / 1657Bed count — State benchmarkedThis home is ranked 897th out of 1657 homes in California. Shows this facility's certified or reported bed count compared to other California facilities. Larger communities may offer more amenities, programs, and on-site services for residents and families.Rankings are based only on facilities in California that report data for that category. Facilities without available data are excluded from the ranking.Click the rank badge to see the full State ranking.Click here to see the full State ranking.
A larger shared setting that may offer more common spaces and organized community services.
Walk Score
Walk Score: 63 / 100 Rank #951 / 2092Walk Score — State benchmarkedThis home is ranked 951st out of 2092 homes in California. Shows how walkable this facility's neighborhood is compared to the average Walk Score across California facilities. Higher scores benefit residents, families, and staff.Rankings are based only on facilities in California that report data for that category. Facilities without available data are excluded from the ranking.Click the rank badge to see the full State ranking.Click here to see the full State ranking.
Moderately walkable. Some errands can be accomplished on foot, with a mix of nearby amenities.

Contact Anaheim Crest Nursing Center

Staffing Data

Reporting period: October 1 – December 31, 2025 (Q4 2025). Source: CMS Payroll-Based Journal report.

Total staff 135
Employees 121
Contractors 14
Staff to resident ratio 1.88 : 1
0% compared with California average
California average ratio: 1.81 : 1 California average ratio: 1.81 : 1See full California ranking
Avg staff/day 58
Average shift 7.1 hours
8% worse than California average
California average: 7.7 hours California average shift: 7.7 hoursSee full California ranking
Total staff hours (quarter) 37,817

Nursing staff breakdown

Q4 2025 · Oct 1 – Dec 31 More info This data comes from the CMS Payroll-Based Journal report covering October 1 – December 31, 2025.
Registered Nurse

Manages medical care and health needs.

RN Staff Info All 11 RN Staff are full-time employees. No contractors work on this role. 11
Average shift length Info Average shift length. Calculated as total hours divided by days worked and average staff per day. 7.4 hours
Licensed Practical Nurse

Assists with medical care and medications.

LPN Staff Info All 22 LPN Staff are full-time employees. No contractors work on this role. 22
Average shift length Info Average shift length. Calculated as total hours divided by days worked and average staff per day. 7.4 hours
Certified Nursing Assistant

Helps with daily care and mobility.

CNA Staff Info All 53 CNA Staff are full-time employees. No contractors work on this role. 53
Average shift length Info Average shift length. Calculated as total hours divided by days worked and average staff per day. 7.3 hours

Contractor staffing

Q4 2025 · Oct 1 – Dec 31 More info This data comes from the CMS Payroll-Based Journal report covering October 1 – December 31, 2025.

Total hours from contractors

1.1%

408 contractor hours this quarter

Respiratory Therapy Technician: 5 Other Physician: 4 Occupational Therapy Aide: 2 Occupational Therapy Assistant: 1 Medical Director: 1 Mental Health Service Worker: 1

Staff by category

Q4 2025 · Oct 1 – Dec 31 More info This data comes from the CMS Payroll-Based Journal report covering October 1 – December 31, 2025.
Certified Nursing Assistant5305317,59792100%7.3
Licensed Practical Nurse220228,16392100%7.4
Registered Nurse110112,65992100%7.4
Physical Therapy Aide7071,5597885%6
Speech Language Pathologist7071,2878795%5.7
RN Director of Nursing2021,0246470%8
Dental Services Staff2029986874%7.9
Physical Therapy Assistant4049038896%6.1
Respiratory Therapy Technician55108947885%6
Other Dietary Services Staff2026037480%7.9
Administrator1015126470%8
Dietitian1015096571%7.8
Nurse Practitioner1014886166%8
Qualified Social Worker3033147177%2.7
Occupational Therapy Aide0221514448%3.4
Other Physician0446033%5
Medical Director011451213%3.8
Occupational Therapy Assistant0114389%5.3
Mental Health Service Worker011811%8
53 Certified Nursing Assistant
% of Days 100%
22 Licensed Practical Nurse
% of Days 100%
11 Registered Nurse
% of Days 100%
7 Physical Therapy Aide
% of Days 85%
7 Speech Language Pathologist
% of Days 95%
2 RN Director of Nursing
% of Days 70%
2 Dental Services Staff
% of Days 74%
4 Physical Therapy Assistant
% of Days 96%
10 Respiratory Therapy Technician
% of Days 85%
2 Other Dietary Services Staff
% of Days 80%
1 Administrator
% of Days 70%
1 Dietitian
% of Days 71%
1 Nurse Practitioner
% of Days 66%
3 Qualified Social Worker
% of Days 77%
2 Occupational Therapy Aide
% of Days 48%
4 Other Physician
% of Days 3%
1 Medical Director
% of Days 13%
1 Occupational Therapy Assistant
% of Days 9%
1 Mental Health Service Worker
% of Days 1%

Penalties and fines

Federal penalties imposed by CMS for regulatory violations, including civil money penalties (fines) and denials of payment for new Medicare/Medicaid admissions.

Source: CMS Penalties Database

No penalties in the past 3 years

No civil money penalties or payment denials were reported in the last 3 years.

Quality of care over time

These measures show how residents usually do over time at this home, based on health outcomes and preventive care.

High-risk clinical events score Info A composite score based on pressure ulcers, falls with injury, weight loss, walking ability decline, and activities of daily living decline. 7.1
6% worse than California average

California average: 6.6

Functional decline score Info A composite score based on activities of daily living decline, walking ability decline, and incontinence. 12.8
13% worse than California average

California average: 11.3

Long-stay resident measures
Significantly above average Info CMS star rating based on long-stay quality measure performance. 5 stars = significantly above average, 1 star = significantly below average.
Need for Help with Daily Activities Increased Info Percent of long-stay residents whose need for help with daily activities has increased 13.8%
25% worse than California average

California average: 11.1%

Walking Ability Worsened Info Percent of long-stay residents whose ability to move independently worsened 12.5%
5% worse than California average

California average: 12.0%

Low Risk Residents with Bowel/Bladder Incontinence Info Percent of low risk long-stay residents who lose control of their bowels or bladder 12.0%
6% worse than California average

California average: 11.3%

Falls with Major Injury Info Percent of long-stay residents experiencing one or more falls with major injury 0.5%
71% better than California average

California average: 1.7%

High Risk Residents with Pressure Ulcers Info Percent of long-stay high risk residents with pressure ulcers 5.8%
17% worse than California average

California average: 5.0%

Urinary Tract Infection Info Percent of long-stay residents with a urinary tract infection 0.5%
58% better than California average

California average: 1.2%

Lost Too Much Weight Info Percent of long-stay residents who lose too much weight 2.7%
37% better than California average

California average: 4.2%

Depressive Symptoms Info Percent of long-stay residents who have depressive symptoms 84.6%
1164% worse than California average

California average: 6.7%

Antipsychotic Use Info Percent of long-stay residents who received an antipsychotic medication 6.1%
40% better than California average

California average: 10.1%

Pneumococcal Vaccine Info Percent of long-stay residents assessed and appropriately given the pneumococcal vaccine 100.0%
In line with California average

California average: 98.5%

Influenza Vaccine Info Percent of long-stay residents assessed and appropriately given the seasonal influenza vaccine 100.0%
In line with California average

California average: 98.2%

Hospitalizations per 1,000 days Info Number of hospitalizations per 1,000 long-stay resident days. 2.74
22% worse than California average

California average: 2.25

ED visits per 1,000 days Info Number of outpatient emergency department visits per 1,000 long-stay resident days. 0.81
49% better than California average

California average: 1.59

Short-stay resident measures
Above average Info CMS star rating based on short-stay quality measure performance. 5 stars = much above average, 1 star = much below average.
Pneumococcal Vaccine Info Percent of short-stay residents assessed and appropriately given the pneumococcal vaccine 99.7%
6% better than California average

California average: 94.0%

Antipsychotic medication increase Info Percent of short-stay residents who newly received an antipsychotic medication 0.0%
100% better than California average

California average: 1.5%

Influenza Vaccine Info Percent of short-stay residents assessed and appropriately given the seasonal influenza vaccine 100.0%
7% better than California average

California average: 93.2%

Re-hospitalized after SNF stay Info Percentage of short-stay residents who were re-hospitalized after their nursing home admission. 20.1%
13% better than California average

California average: 23.2%

Emergency department visits Info Percentage of short-stay residents who had an outpatient emergency department visit. 9.0%
20% better than California average

California average: 11.2%

Falls with major injury Info Percentage of SNF residents who experience falls with major injury during their stay. 0.6%
18% better than California average

California average: 0.8%

Ability to care for self at discharge Info Percentage of residents at or above expected ability to care for themselves at discharge. 46.7%
13% worse than California average

California average: 53.7%

Successful return to home or community Info Rate of successful return to home or community from a skilled nursing facility. 39.1%
23% worse than California average

California average: 50.6%

Breakdown by payment type

Medicare

26% of new residents, usually for short-term rehab.

Typical stay 1 - 2 months

Private pay

74% of new residents, often for short stays.

Typical stay 15 days

Facility Characteristics

Source: CMS Long-Term Care Facility Characteristics (Data as of Jan 2026)

Total residents 72
Medicare
12
16.7% of residents
Medicaid
45
62.5% of residents
Private pay or other
15
20.8% of residents
Programs & Services
Residents Group

Residents meet regularly to discuss policies, care quality, and activities

Nurse Aide Training

State-approved Nurse Aide Training and Competency Evaluation Program on-site

Active Resident Council

Organized group of residents that meets regularly to discuss facility policies, quality of life, and activities.

Finances and operations

Based on CMS SNF Cost Report for fiscal year ending in 12/2023.

For-profit
Operated by a single business entity.
Net patient revenue Info Net patient revenue — what the home actually collects for resident care, after contractual allowances, bad debt and discounts are subtracted from its gross charges (CMS cost report, Worksheet G-3). It covers resident care only; money the home earns from other sources is shown separately as "Other income."
$11.4M
Net patient income Info Net patient income: net patient revenue minus the home's total operating expenses. A positive figure means it earns more from resident care than it spends to deliver it; a negative figure means the opposite. It excludes non-operating "other income."
$481.4K
For-profit Operated by a single business entity.
Net patient revenue Info Net patient revenue — what the home actually collects for resident care, after contractual allowances, bad debt and discounts are subtracted from its gross charges (CMS cost report, Worksheet G-3). It covers resident care only; money the home earns from other sources is shown separately as "Other income."
$11.4M Rank #254 / 355Revenue — State benchmarkedThis home is ranked 254th out of 355 homes in California. Shows this facility's annual revenue compared to the California average. Higher revenue generally means more resources for staffing and capital — read alongside Payroll %.Rankings are based only on facilities in California that report data for that category. Facilities without available data are excluded from the ranking.Click the rank badge to see the full State ranking.Click here to see the full State ranking.
Net patient income Info Net patient income: net patient revenue minus the home's total operating expenses. A positive figure means it earns more from resident care than it spends to deliver it; a negative figure means the opposite. It excludes non-operating "other income."
$481.4K
Other income Info Money the home earns outside of resident care — such as investments, grants, rentals and other non-operating sources (CMS cost report, Worksheet G-3). It is tracked separately from net patient revenue: it is not part of that figure, and it is not included in net patient income.
$247.9K
Payroll costs Info Staff salaries plus wage-related costs — benefits such as payroll taxes, health insurance and retirement — from the home's own accounting records (CMS cost report, Worksheet A). Contract or agency labor is counted separately, under other operating costs. Rank #226 / 355Payroll — State benchmarkedThis home is ranked 226th out of 355 homes in California. Shows total annual staff payroll benchmarked to the California average. Higher payroll investment relative to peers often signals better staffing and less reliance on cheaper contract labor.Rankings are based only on facilities in California that report data for that category. Facilities without available data are excluded from the ranking.Click the rank badge to see the full State ranking.Click here to see the full State ranking.
$6.1M 53.7% of net patient revenue Info Payroll as a share of revenue: staff salaries and wage-related benefits divided by net patient revenue. A higher figure means more of each revenue dollar goes to staff pay. Rank #81 / 355Payroll % — State benchmarkedThis home is ranked 81st out of 355 homes in California. Shows payroll as a percentage of revenue versus the California average. Well-run California facilities typically land around 55–67% — the top third Statewide. Below 25% may signal understaffing or heavy agency use — read with Staffing ratings.Rankings are based only on facilities in California that report data for that category. Facilities without available data are excluded from the ranking.Click the rank badge to see the full State ranking.Click here to see the full State ranking.
Other operating costs Info Everything it costs to run the home apart from payroll — food, utilities, supplies, maintenance, contract labor and administration. Calculated as total operating expense minus payroll (staff salaries and wage-related benefits).
$4.8M
Total costs Info The home's total operating expense for the year — all the costs of running it, salaries included (CMS cost report, Worksheet G-3).
$10.9M

What does this home offer?

Building type icon
Building type icon

Building Type: Single-story

Rehabilitative support icon

Rehabilitative Support

Social and recreational activities icon

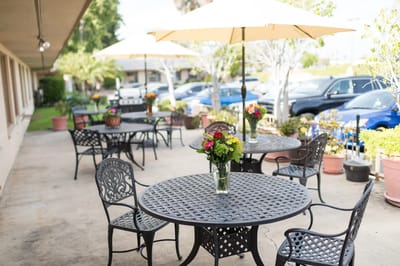
Social and Recreational Activities

On-site medical care and health services icon

On-site Medical Care and Health Services

Who this home usually serves

TYPE OF STAY

Primarily short stays

Residents typically stay for brief periods, with frequent admissions and discharges throughout the year.

Most new residents arrive under private pay (74% of admissions), and a typical private pay stay runs around 15 days.

Admissions
342 total

Coverage residents most often arrive under.

Medicare 26%
Private pay 74%
Discharges
333 total

Coverage residents most often leave under.

Medicare 21%
Private pay 78%
Medicaid 1%

Places of interest near Anaheim Crest Nursing Center

Address 5.4 miles from city center Info Estimated distance in miles from Anaheim's city center to Anaheim Crest Nursing Center's address, calculated via Google Maps.

Calculate Travel Distance to Anaheim Crest Nursing Center

Add your location

Address

Compare Nursing Homes around Orange County

The information below is reported by the California Department of Social Services and Department of Public Health.

5 facilities compared · CMS & CA Dept. of Health data

Anaheim Crest Nursing Center
NH
Anaheim (West Orange Avenue)
83
Facility 83
CA AVG 103
Rank #897 / 1657
91.5%
Facility 91.5%
CA AVG 84.7%
Rank #281 / 1537
+8%
3.58
Facility 3.58
CA AVG 4.22
Rank #269 / 354
-9%-15%
$0
Facility $0
CA AVG $56.5k
Rank #1 / 362
-
56
Facility 56
CA AVG 50.2
Rank #255 / 361
4.3
Facility 4.3
CA AVG 4.6
Rank #196 / 361
-78-
63
Facility 63
CA AVG 57
Rank #951 / 2092
Kristina Kuizon
$11.4M
Facility $11.4M
CA AVG $17.0M
Rank #254 / 355
$6.1M
Facility $6.1M
CA AVG $7.0M
Rank #226 / 355
53.7%
Facility 53.7%
CA AVG 45.2%
Rank #81 / 355
555445
Mission Palms Healthcare Center
NH
HC
RC
Westminster
99
Facility 99
CA AVG 103
Rank #725 / 1657
89.6%
Facility 89.6%
CA AVG 84.7%
Rank #335 / 1537
+6%
3.61
Facility 3.61
CA AVG 4.22
Rank #269 / 354
-48%-15%
$13.9k
Facility $13.9k
CA AVG $56.5k
Rank #258 / 362
-
39
Facility 39
CA AVG 50.2
Rank #164 / 361
6.5
Facility 6.5
CA AVG 4.6
Rank #315 / 361
193A+
63
Facility 63
CA AVG 57
Rank #951 / 2092
-
$15.7M
Facility $15.7M
CA AVG $17.0M
Rank #187 / 355
$8.9M
Facility $8.9M
CA AVG $7.0M
Rank #161 / 355
56.4%
Facility 56.4%
CA AVG 45.2%
Rank #116 / 355
56271
Villa Valencia Healthcare Center
NH
Laguna Hills
59
Facility 59
CA AVG 103
Rank #1092 / 1657
83.3%
Facility 83.3%
CA AVG 84.7%
Rank #504 / 1537
-2%
3.21
Facility 3.21
CA AVG 4.22
Rank #336 / 354
+19%-24%
$0
Facility $0
CA AVG $56.5k
Rank #1 / 362
-
41
Facility 41
CA AVG 50.2
Rank #176 / 361
3.2
Facility 3.2
CA AVG 4.6
Rank #82 / 361
-53-
62
Facility 62
CA AVG 57
Rank #982 / 2092
Alhv LLC
$14.0M
Facility $14.0M
CA AVG $17.0M
Rank #183 / 355
$6.9M
Facility $6.9M
CA AVG $7.0M
Rank #222 / 355
49.5%
Facility 49.5%
CA AVG 45.2%
Rank #241 / 355
555462
Orange Healthcare & Wellness Center, LLC
NH
Orange
112
Facility 112
CA AVG 103
Rank #631 / 1657
93.6%
Facility 93.6%
CA AVG 84.7%
Rank #225 / 1537
+11%
3.72
Facility 3.72
CA AVG 4.22
Rank #245 / 354
-56%-12%
$0
Facility $0
CA AVG $56.5k
Rank #1 / 362
-
83
Facility 83
CA AVG 50.2
Rank #313 / 361
4.9
Facility 4.9
CA AVG 4.6
Rank #240 / 361
193-
58
Facility 58
CA AVG 57
Rank #1128 / 2092
-
$15.5M
Facility $15.5M
CA AVG $17.0M
Rank #67 / 355
$9.7M
Facility $9.7M
CA AVG $7.0M
Rank #105 / 355
62.2%
Facility 62.2%
CA AVG 45.2%
Rank #315 / 355
55252
Anaheim Healthcare Center
NH
Anaheim (Southwest Anaheim)
250
Facility 250
CA AVG 103
Rank #86 / 1657
86.2%
Facility 86.2%
CA AVG 84.7%
Rank #429 / 1537
+2%
4.29
Facility 4.29
CA AVG 4.22
Rank #122 / 354
+18%+2%
$9.3k
Facility $9.3k
CA AVG $56.5k
Rank #238 / 362
-
110
Facility 110
CA AVG 50.2
Rank #348 / 361
5.2
Facility 5.2
CA AVG 4.6
Rank #260 / 361
1219-
69
Facility 69
CA AVG 57
Rank #768 / 2092
Anaheim Healthcare Center LLC
$35.3M
Facility $35.3M
CA AVG $17.0M
Rank #3 / 355
$21.2M
Facility $21.2M
CA AVG $7.0M
Rank #6 / 355
59.9%
Facility 59.9%
CA AVG 45.2%
Rank #343 / 355
55984

Financial Assistance for
Nursing Home in California

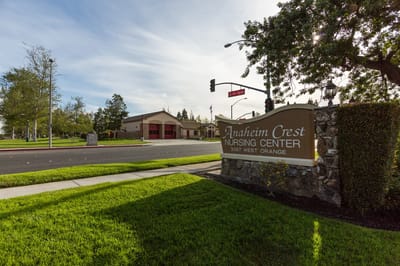
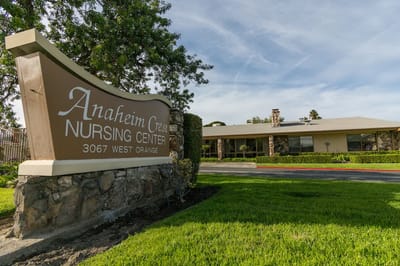
Anaheim Crest Nursing Center is located in Anaheim, California.
Here are the financial assistance programs available to residents in California.

Get Financial aid guidance

Multipurpose Senior Services Program

MSSP (Medi-Cal Waiver)

Age 65+
General California resident, Medi-Cal eligible, nursing home risk.
Income Limits (2025) ~$2,829/month 300% FBR, individual
Asset Limits $2,000 (individual), $3,000 (couple).
CA

County-managed; waitlists possible.

Benefits
In-home support (4-6 hours/day) Respite care (14 days/year) Meals (~$6/meal) Transportation (8 trips/month) Care management

In-Home Supportive Services (IHSS)

California IHSS

Age 65+
General California resident, Medicaid-eligible or low-income.
Income Limits ~$1,732/month individual, Medi-Cal threshold
Asset Limits $2,000 individual
CA

Can hire family as caregivers.

Benefits
Personal care (up to 283 hours/month) Homemaker services Respite (varies)

Multipurpose Senior Services Program (MSSP)

CA MSSP

Age 65+
General California resident, Medi-Cal-eligible, nursing home-eligible but community-capable.
Income Limits ~$2,829/month 300% FBR, individual
Asset Limits $2,000 individual
CA

Available in 38 counties; waitlists common.

Benefits
Case management Respite care (up to 10 days/year) Minor home mods (avg. $500) Adult day care (~$50/day)

Property Tax Postponement Program (PTP)

CA PTP

Age 62+
General California resident, own and live in home, 40% equity.
Income Limits (2025) ~$51,500/year household, adjusted annually
Asset Limits Equity-based; no strict asset cap.
CA

Deferred taxes accrue interest (5% as of 2024); repaid upon sale/death.

Benefits
Property tax deferral (avg. $1,000-$3,000/year, varies by county)

Assisted Living Waiver (ALW)

CA ALW

Age 65+ or disabled
General California resident, Medi-Cal-eligible, nursing home-eligible.
Income Limits ~$2,829/month 300% FBR, individual
Asset Limits $2,000 individual
CA

Available in 15 counties (e.g., LA, Sacramento); waitlists common.

Benefits
Personal care in ALFs (5-7 hours/day) Medication management Social services

California CARES Program

CA CARES

Age
General Caregivers of California residents 60+ needing help with 3+ daily activities; no caregiver age limit.
Income Limits No strict limit; cost-sharing above ~$2,500/month threshold.
Asset Limits Not applicable; need-based.
CA

High demand in urban areas; complements IHSS respite.

Benefits
Respite care (up to 10 days/year) Counseling (4-6 sessions/year) Training (2-3 workshops/year) Supplies (~$200/year)

Frequently Asked Questions about Anaheim Crest Nursing Center

What neighborhood is Anaheim Crest Nursing Center in?

Anaheim Crest Nursing Center is in the West Orange Avenue neighborhood.

Is Anaheim Crest Nursing Center in a walkable area?

Anaheim Crest Nursing Center has a walk score of 63. Moderately walkable. Some errands can be accomplished on foot, with a mix of nearby amenities.

What is the occupancy rate at Anaheim Crest Nursing Center?

Anaheim Crest Nursing Center's occupancy is 91.5%.

What is the best email address for Anaheim Crest Nursing Center?

The team at Anaheim Crest Nursing Center can be reached at business-office@anaheimcrest.com.

Does Anaheim Crest Nursing Center operate as a for-profit or non-profit?

Anaheim Crest Nursing Center is registered as a for-profit.

Are there photos of Anaheim Crest Nursing Center?

Yes — there are 7 photos of Anaheim Crest Nursing Center in the photo gallery on this page.

What is the address of Anaheim Crest Nursing Center?

Anaheim Crest Nursing Center is located at 3067 W Orange Ave, Anaheim, CA 92804.

Guides for Better Senior Living

Care Cost Calculator: See Prices in Your Area

Nursing Home Data Explorer

Don’t Wait Too Long: 7 Red Flag Signs Your Parent Needs Assisted Living Now

The True Cost of Assisted Living in 2025 – And How Families Are Paying For It

Understanding Senior Living Costs: Pricing Models, Discounts & Financial Assistance