


Total health inspections
46
California average 12.5
Last Health inspection on Sep 2025
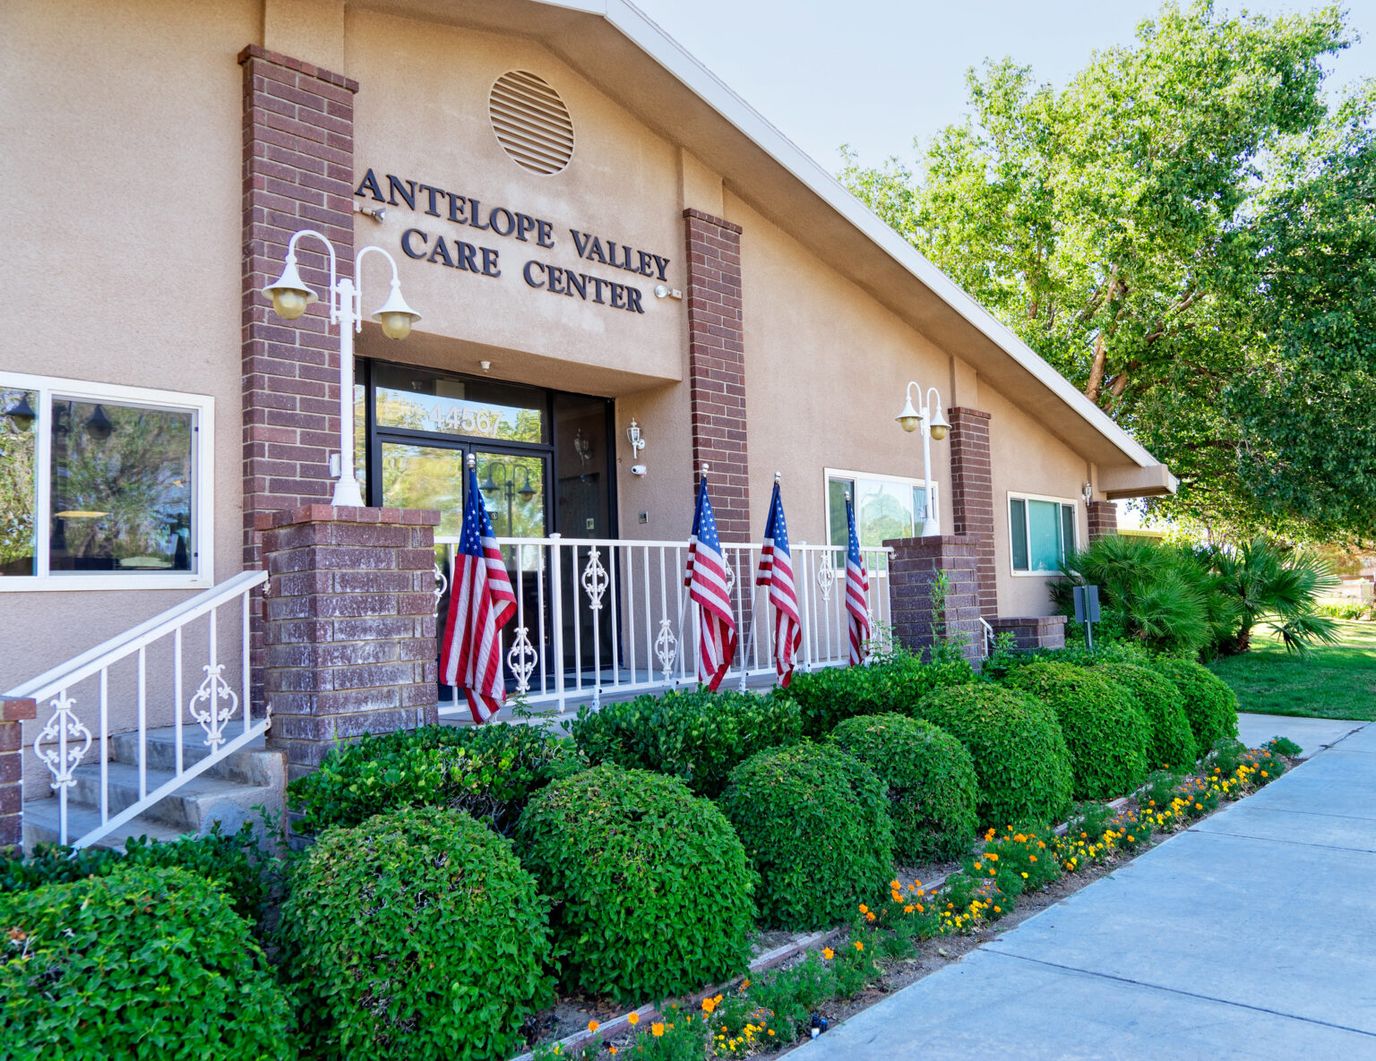
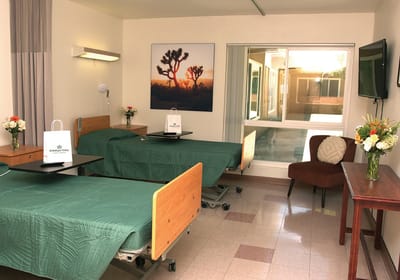
Live a worry-free retirement with the idyllic senior living community of Antelope Valley Care Center set in charming Lancaster, CA, focusing on skilled nursing and rehabilitation. With its dedication to improving seniors’ well-being, the community provides a team of kind and well-trained professionals to care for their needs. Cozy and elegant accommodations are also available to ensure seniors’ comfort and convenience.
The community also offers social services to guide residents with their other needs. Moreover, fun activities and enriching events accompany residents as they try out new things and lead meaningful lives. Antelope Valley Care Center is ideally situated near local amenities and healthcare providers, giving residents easy access to their necessities and desires.
| Staff type | Hours / Day / Resident | vs state avg |
|---|---|---|
|
Registered Nurse (RN)
| 13m per day | ▼ 67% State avg: 39m per day · National avg: 41m per day |
|
LPN / LVN
| 1h 21m per day | ▲ 10% State avg: 1h 13m per day · National avg: 52m per day |
|
Nurse Aide
| 2h 28m per day | ▼ 7% State avg: 2h 39m per day · National avg: 2h 21m per day |
|
Weekend Total Nursing
| 3h 41m per day | ▼ 10% State avg: 4h 5m per day · National avg: 3h 26m per day |
|
Physical Therapist
| 5m per day | ▼ 4% State avg: 5m per day · National avg: 4m per day |
|
Weekend RN
| 10m per day | ▼ 66% State avg: 30m per day · National avg: 29m per day |
In California, the Department of Social Services (for assisted living facilities) and the Department of Public Health (for nursing homes) conduct inspections to ensure resident safety and regulatory compliance.
California average 12.5
Last Health inspection on Sep 2025
California average 50.2
California average 4.65
Health citations are formal notices following inspections when they fail to comply with safety and care standards.
77 of 169 citations resulted from standard inspections; 89 of 169 resulted from complaint investigations; and 3 of 169 came from combined inspections (standard and complaint).
California average: 0.4
California average: 1
Reporting period: October 1 – December 31, 2025 (Q4 2025). Source: CMS Payroll-Based Journal report.
Manages medical care and health needs.
Assists with medical care and medications.
Helps with daily care and mobility.
| Certified Nursing Assistant | 131 | 4 | 135 | 40,409 | 92 | 100% | 7.4 |
| Licensed Practical Nurse | 60 | 0 | 60 | 20,775 | 92 | 100% | 7.6 |
| Other Dietary Services Staff | 14 | 0 | 14 | 5,762 | 92 | 100% | 7.3 |
| Registered Nurse | 14 | 0 | 14 | 3,360 | 92 | 100% | 7.4 |
| Speech Language Pathologist | 7 | 0 | 7 | 2,942 | 78 | 85% | 6.9 |
| Physical Therapy Aide | 8 | 0 | 8 | 1,907 | 92 | 100% | 7.7 |
| Dental Services Staff | 5 | 0 | 5 | 1,812 | 77 | 84% | 7.9 |
| Respiratory Therapy Technician | 4 | 0 | 4 | 1,316 | 92 | 100% | 7.5 |
| RN Director of Nursing | 4 | 0 | 4 | 1,249 | 67 | 73% | 8.2 |
| Physical Therapy Assistant | 3 | 0 | 3 | 1,070 | 79 | 86% | 7.4 |
| Therapeutic Recreation Specialist | 3 | 0 | 3 | 1,053 | 71 | 77% | 8 |
| Dietitian | 2 | 0 | 2 | 568 | 64 | 70% | 8 |
| Administrator | 2 | 0 | 2 | 492 | 60 | 65% | 7.8 |
| Occupational Therapy Aide | 1 | 0 | 1 | 472 | 59 | 64% | 8 |
| Qualified Social Worker | 4 | 0 | 4 | 417 | 56 | 61% | 6.2 |
| Nurse Practitioner | 1 | 0 | 1 | 200 | 25 | 27% | 8 |
Includes penalties issued in 2023-2025
Federal penalties imposed by CMS for regulatory violations, including civil money penalties (fines) and denials of payment for new Medicare/Medicaid admissions.
Source: CMS Penalties Database (Data as of Jan 2026)
California average: $55K
California average: 2.4
California average: 0.5
Penalties are imposed by CMS for violations of federal nursing home regulations.
4 penalties in the past 3 years
Multiple penalties were reported in the last 3 years.
Last updated: Jan 2026
These measures show how residents usually do over time at this home, based on health outcomes and preventive care.
California average: 6.6
California average: 11.3
California average: 11.1%
California average: 12.0%
California average: 11.3%
California average: 1.7%
California average: 5.0%
California average: 1.2%
California average: 4.2%
California average: 6.7%
California average: 10.1%
California average: 98.5%
California average: 98.2%
California average: 2.25
California average: 1.59
California average: 94.0%
California average: 1.5%
California average: 93.2%
California average: 23.2%
California average: 11.2%
California average: 0.8%
California average: 53.7%
California average: 50.6%
Quality measures are calculated from Minimum Data Set (MDS) assessments. For most measures, lower percentages indicate better care quality.
21% of new residents, usually for short-term rehab.
77% of new residents, often for short stays.
2% of new residents, often for long-term daily care.
Source: CMS Long-Term Care Facility Characteristics (Data as of Jan 2026)
Residents meet regularly to discuss policies, care quality, and activities
Organized group of residents that meets regularly to discuss facility policies, quality of life, and activities.
Data sourced from CMS Long-Term Care Facility Characteristics quarterly report. Payer mix reflects the current resident census by primary payment source.
Historical financial and operational data for Antelope Valley Care Center from 2011–2022, based on CMS SNF Cost Reports.
Key figures below are for fiscal year ending in 12/2022 — the home's most recent complete cost report, an older period than most facilities report.
Based on the home's most recent complete CMS SNF Cost Report — fiscal year ending in 12/2022. This is an older period than most facilities report, so compare with that in mind.
No pets allowed
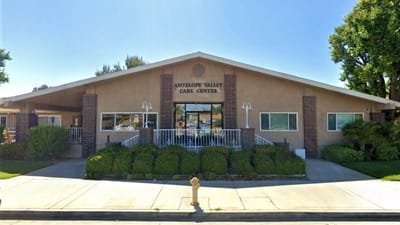
Building Type: Single-story
Residents typically stay for brief periods, with frequent admissions and discharges throughout the year.
Most new residents arrive under private pay (77% of admissions), and a typical private pay stay runs around 3 months.
Coverage residents most often arrive under.
Coverage residents most often leave under.
![]() 0.6 miles from city center
0.6 miles from city center
![]() Estimated distance in miles from Lancaster's city center to Antelope Valley Care Center's address, calculated via Google Maps.
Estimated distance in miles from Lancaster's city center to Antelope Valley Care Center's address, calculated via Google Maps.
Add your location
The information below is reported by the California Department of Social Services and Department of Public Health.
| Antelope Valley Care Center | NH HOS RC SNF | Lancaster | 199
Facility
199
CA AVG
104
Rank
#167 / 1644 |
99.5%
Facility
99.5%
CA AVG
73.9
Rank
#150 / 1492 | +35% | 3.74
Facility
3.74
CA AVG
4.22
Rank
#230 / 327 | -42% | -11% | $124.7k
Facility
$124.7k
CA AVG
$56.5k
Rank
#328 / 334 | - | 169
Facility
169
CA AVG
50.2
Rank
#326 / 327 | 3.7
Facility
3.7
CA AVG
4.6
Rank
#122 / 327 | 6 | 198 | A+ |
48
Facility
48
CA AVG
57
Rank
#1390 / 2087 | - | $18.2M*Fiscal year ending 12/2022These figures are from this home's most recent complete cost report — an older period than most facilities report. Compare with that in mind.
Facility
$18.2M*Fiscal year ending 12/2022These figures are from this home's most recent complete cost report — an older period than most facilities report. Compare with that in mind.
CA AVG
$17.0M
Rank
#129 / 327 | $11.1M*Fiscal year ending 12/2022These figures are from this home's most recent complete cost report — an older period than most facilities report. Compare with that in mind.
Facility
$11.1M*Fiscal year ending 12/2022These figures are from this home's most recent complete cost report — an older period than most facilities report. Compare with that in mind.
CA AVG
$7.0M
Rank
#64 / 327 | 60.9%*Fiscal year ending 12/2022These figures are from this home's most recent complete cost report — an older period than most facilities report. Compare with that in mind.
Facility
60.9%*Fiscal year ending 12/2022These figures are from this home's most recent complete cost report — an older period than most facilities report. Compare with that in mind.
CA AVG
45.2%
Rank
#42 / 327 | 555456 | ||||
| Desert Canyon Post Acute | NH SNF | J Lancaster (West Avenue J) | 99
Facility
99
CA AVG
104
Rank
#724 / 1644 |
87.2%
Facility
87.2%
CA AVG
73.9
Rank
#410 / 1492 | +18% | 3.93
Facility
3.93
CA AVG
4.22
Rank
#195 / 327 | -61% | -7% | $0
Facility
$0
CA AVG
$56.5k
Rank
#1 / 334 | - | 98
Facility
98
CA AVG
50.2
Rank
#309 / 327 | 3.8
Facility
3.8
CA AVG
4.6
Rank
#137 / 327 | 4 | 86 | - |
58
Facility
58
CA AVG
57
Rank
#1126 / 2087 | Abby Gl LLC | $12.6MFiscal year ending 12/2023
Facility
$12.6MFiscal year ending 12/2023
CA AVG
$17.0M
Rank
#198 / 327 | $7.1MFiscal year ending 12/2023
Facility
$7.1MFiscal year ending 12/2023
CA AVG
$7.0M
Rank
#185 / 327 | 56.6%Fiscal year ending 12/2023
Facility
56.6%Fiscal year ending 12/2023
CA AVG
45.2%
Rank
#138 / 327 | 55307 | ||||
| Mirage Post Acute | NH SNF | W Lancaster | 299
Facility
299
CA AVG
104
Rank
#58 / 1644 |
89.2%
Facility
89.2%
CA AVG
73.9
Rank
#370 / 1492 | +21% | 4.77
Facility
4.77
CA AVG
4.22
Rank
#56 / 327 | -20% | +13% | $154.0k
Facility
$154.0k
CA AVG
$56.5k
Rank
#332 / 334 | - | 251
Facility
251
CA AVG
50.2
Rank
#327 / 327 | 4.2
Facility
4.2
CA AVG
4.6
Rank
#170 / 327 | 5 | 267 | - |
53
Facility
53
CA AVG
57
Rank
#1277 / 2087 | Spencer Jack | $21.3M*Fiscal year ending 12/2022These figures are from this home's most recent complete cost report — an older period than most facilities report. Compare with that in mind.
Facility
$21.3M*Fiscal year ending 12/2022These figures are from this home's most recent complete cost report — an older period than most facilities report. Compare with that in mind.
CA AVG
$17.0M
Rank
#95 / 327 | $13.5M*Fiscal year ending 12/2022These figures are from this home's most recent complete cost report — an older period than most facilities report. Compare with that in mind.
Facility
$13.5M*Fiscal year ending 12/2022These figures are from this home's most recent complete cost report — an older period than most facilities report. Compare with that in mind.
CA AVG
$7.0M
Rank
#37 / 327 | 63.5%*Fiscal year ending 12/2022These figures are from this home's most recent complete cost report — an older period than most facilities report. Compare with that in mind.
Facility
63.5%*Fiscal year ending 12/2022These figures are from this home's most recent complete cost report — an older period than most facilities report. Compare with that in mind.
CA AVG
45.2%
Rank
#58 / 327 | 56039 |
Antelope Valley Care Center is located in Lancaster, California.
Here are the financial assistance programs available to residents in California.
Antelope Valley Care Center has a walk score of 48. Somewhat walkable. A few nearby services may be reachable on foot, but most trips require transportation.
Antelope Valley Care Center's occupancy is 81.3%.
Antelope Valley Care Center has been operating for approximately 35 years, based on available licensing and registration records.
No, Antelope Valley Care Center has a no-pet policy.
Antelope Valley Care Center is registered as a for-profit in CA.
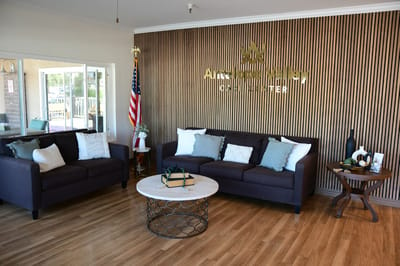
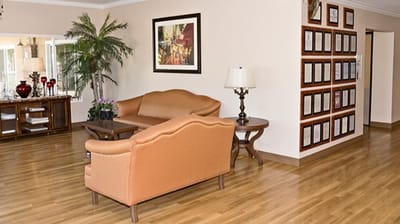
Yes — there are 6 photos of Antelope Valley Care Center in the photo gallery on this page.
Antelope Valley Care Center is located at 44567 15Th St W, Lancaster, CA 93534.
Care Cost Calculator: See Prices in Your Area
Nursing Home Data Explorer
Don’t Wait Too Long: 7 Red Flag Signs Your Parent Needs Assisted Living Now
The True Cost of Assisted Living in 2025 – And How Families Are Paying For It
Understanding Senior Living Costs: Pricing Models, Discounts & Financial Assistance


