


APEX Luxurious Living
Assisted Living · Silver Spring, MD


APEX Luxurious Living
Assisted Living · Silver Spring, MD
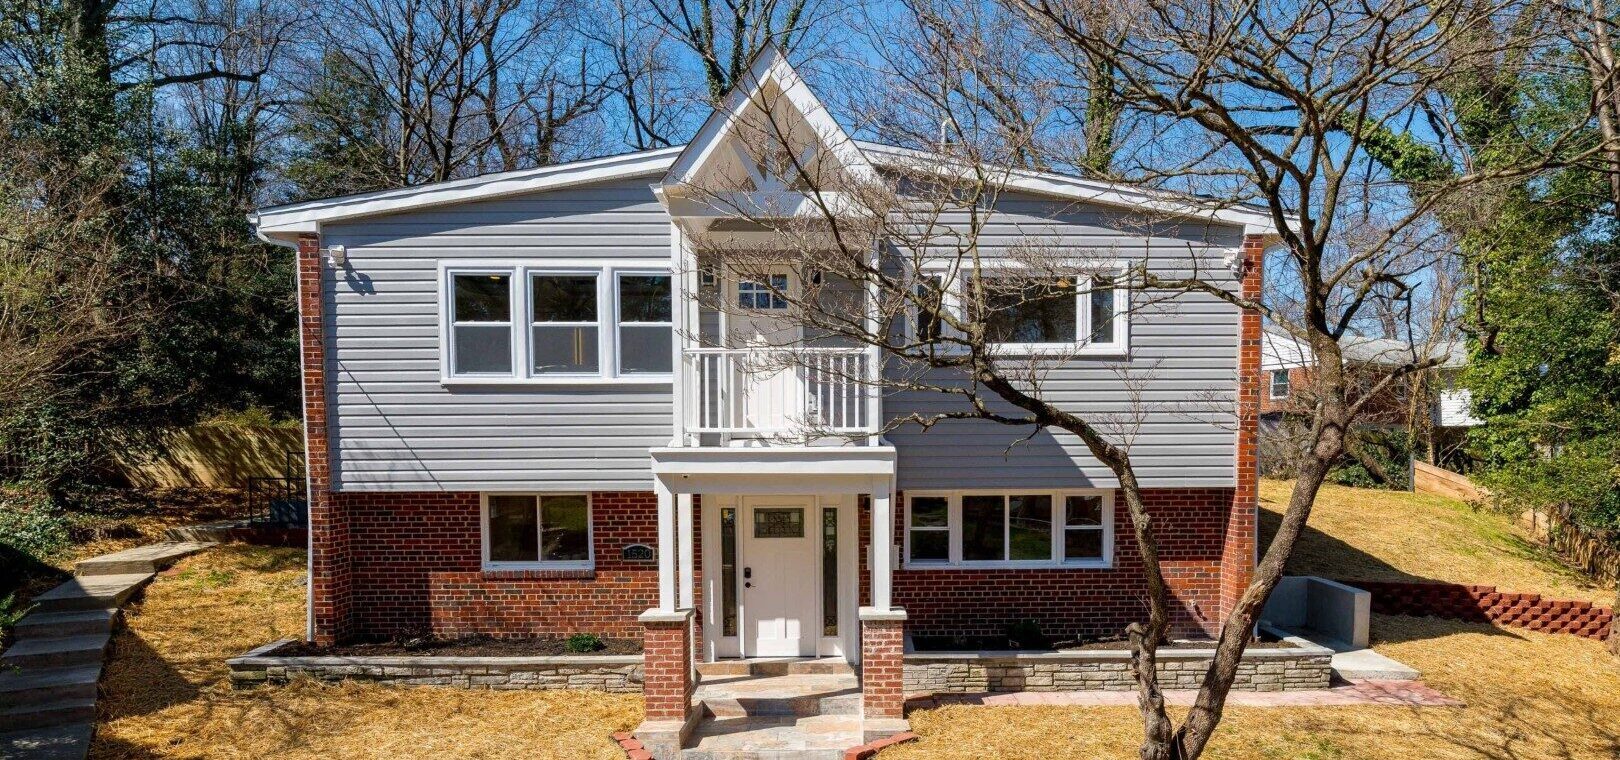
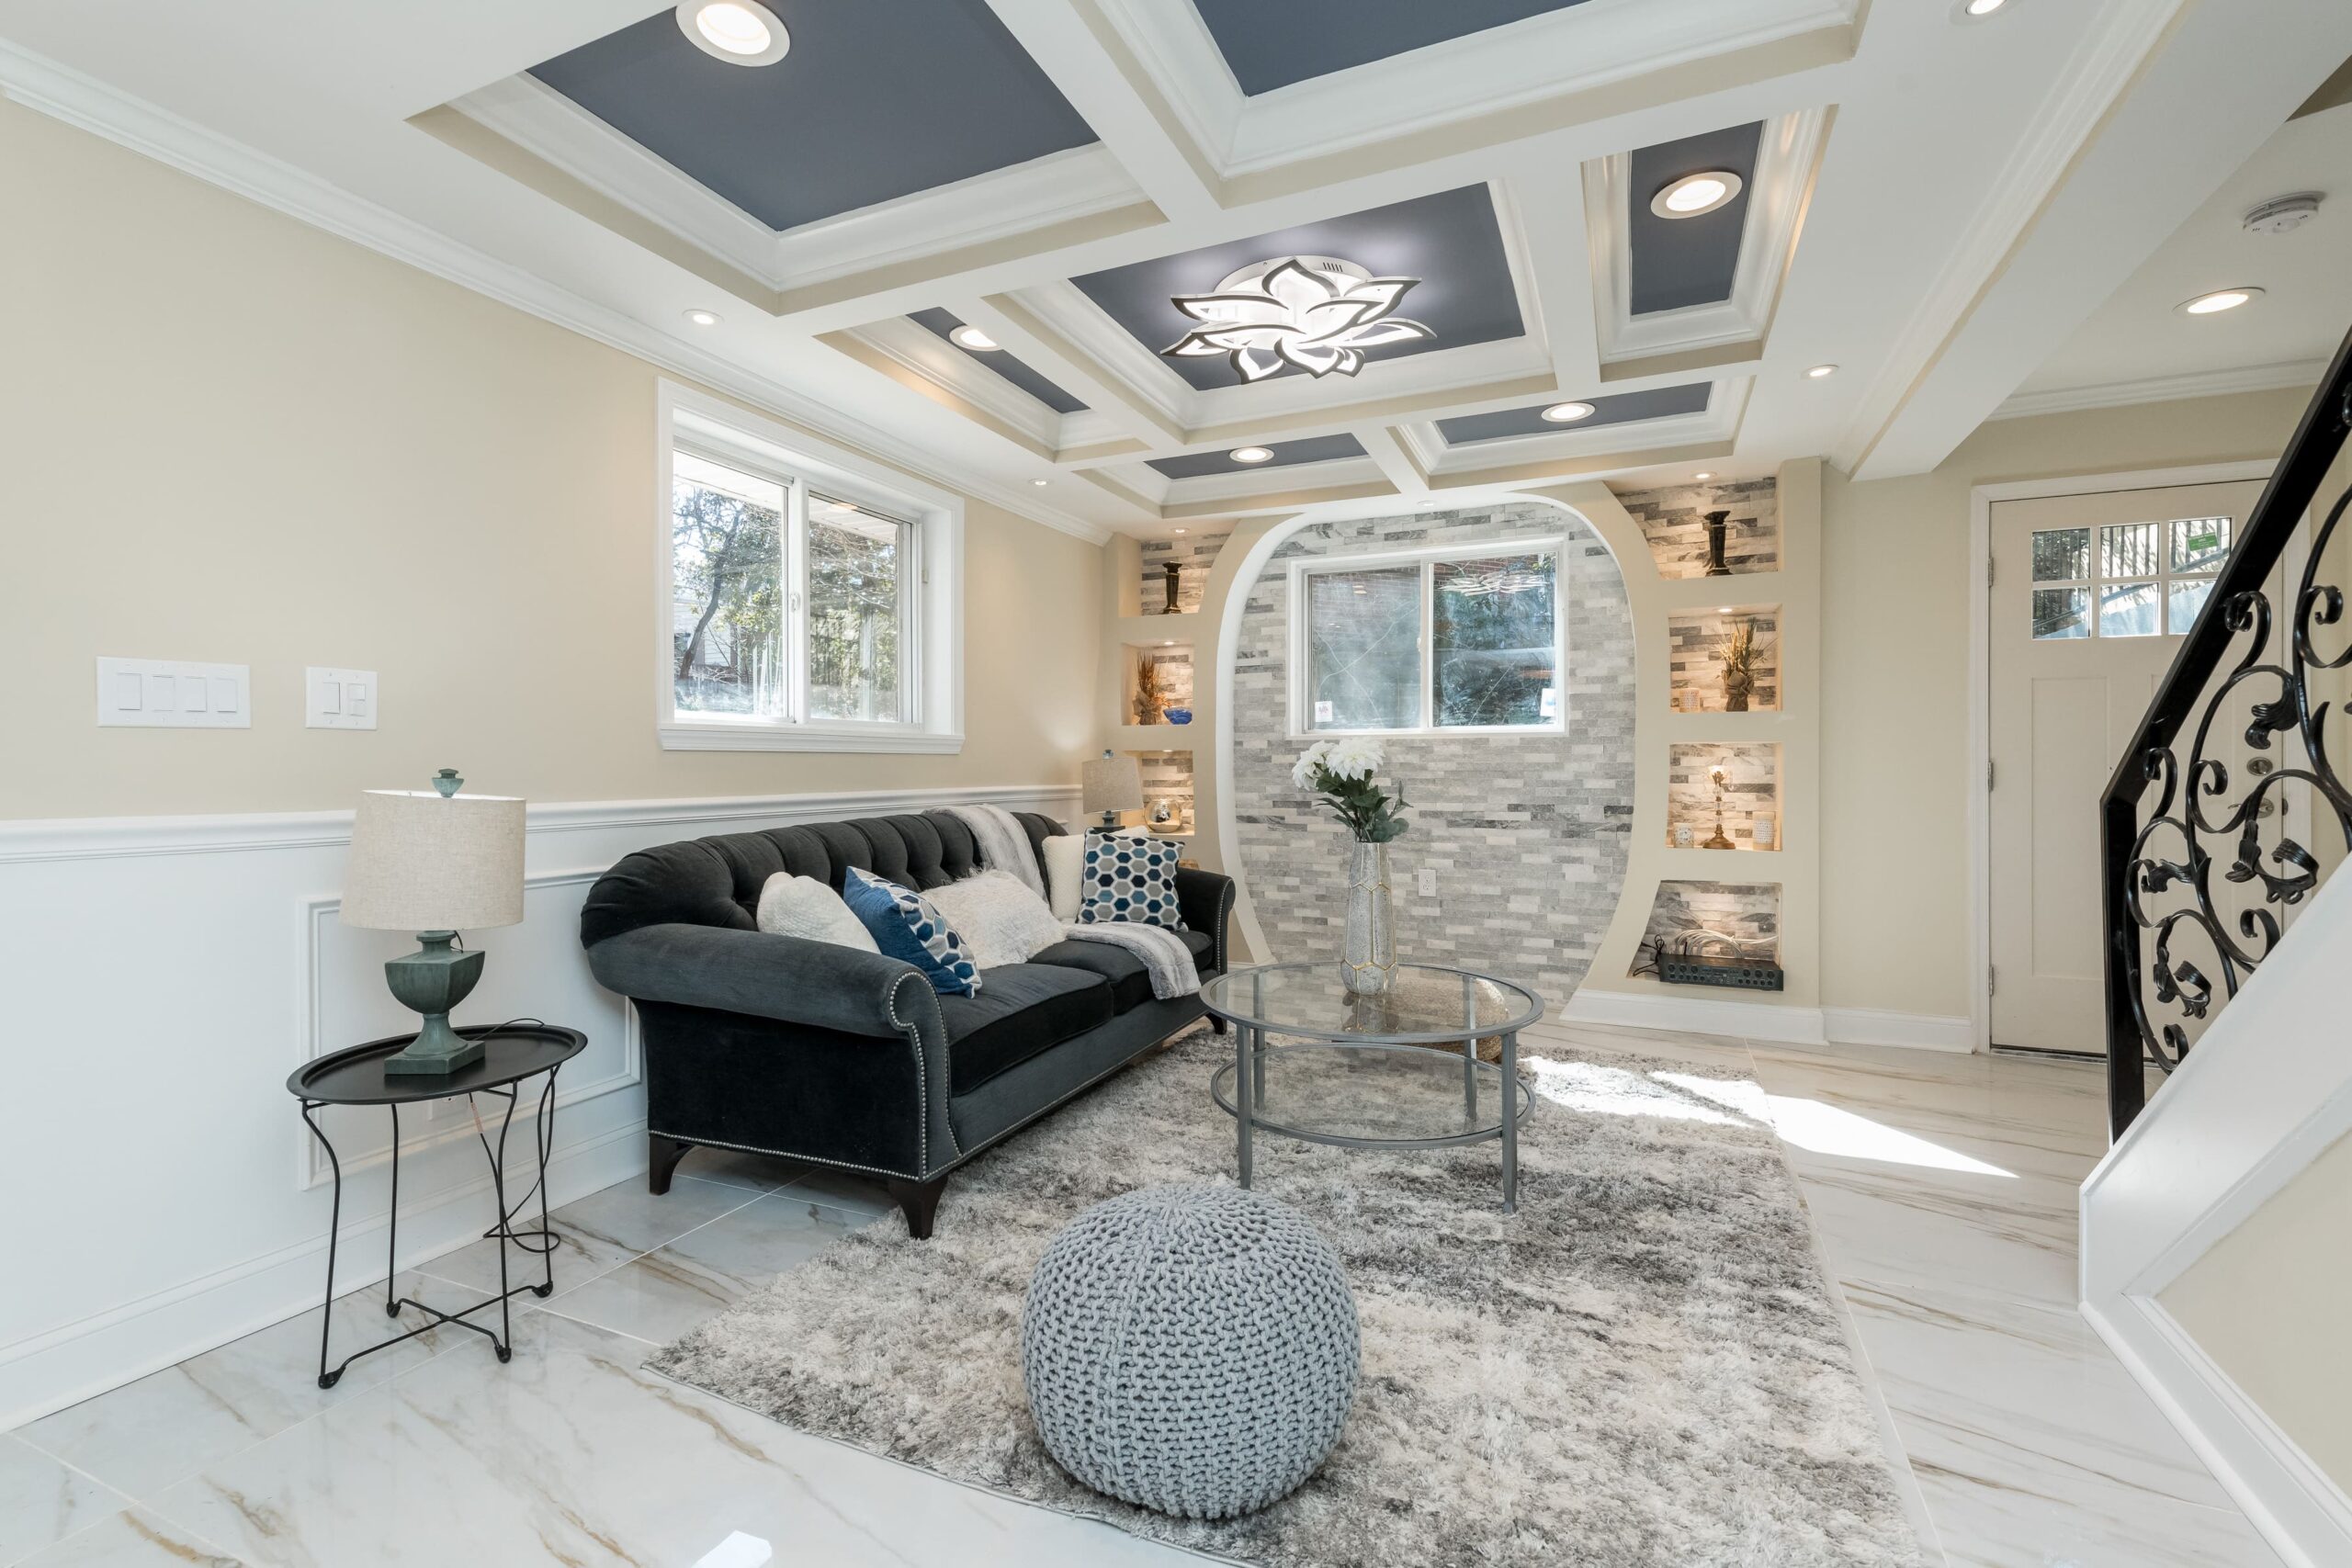
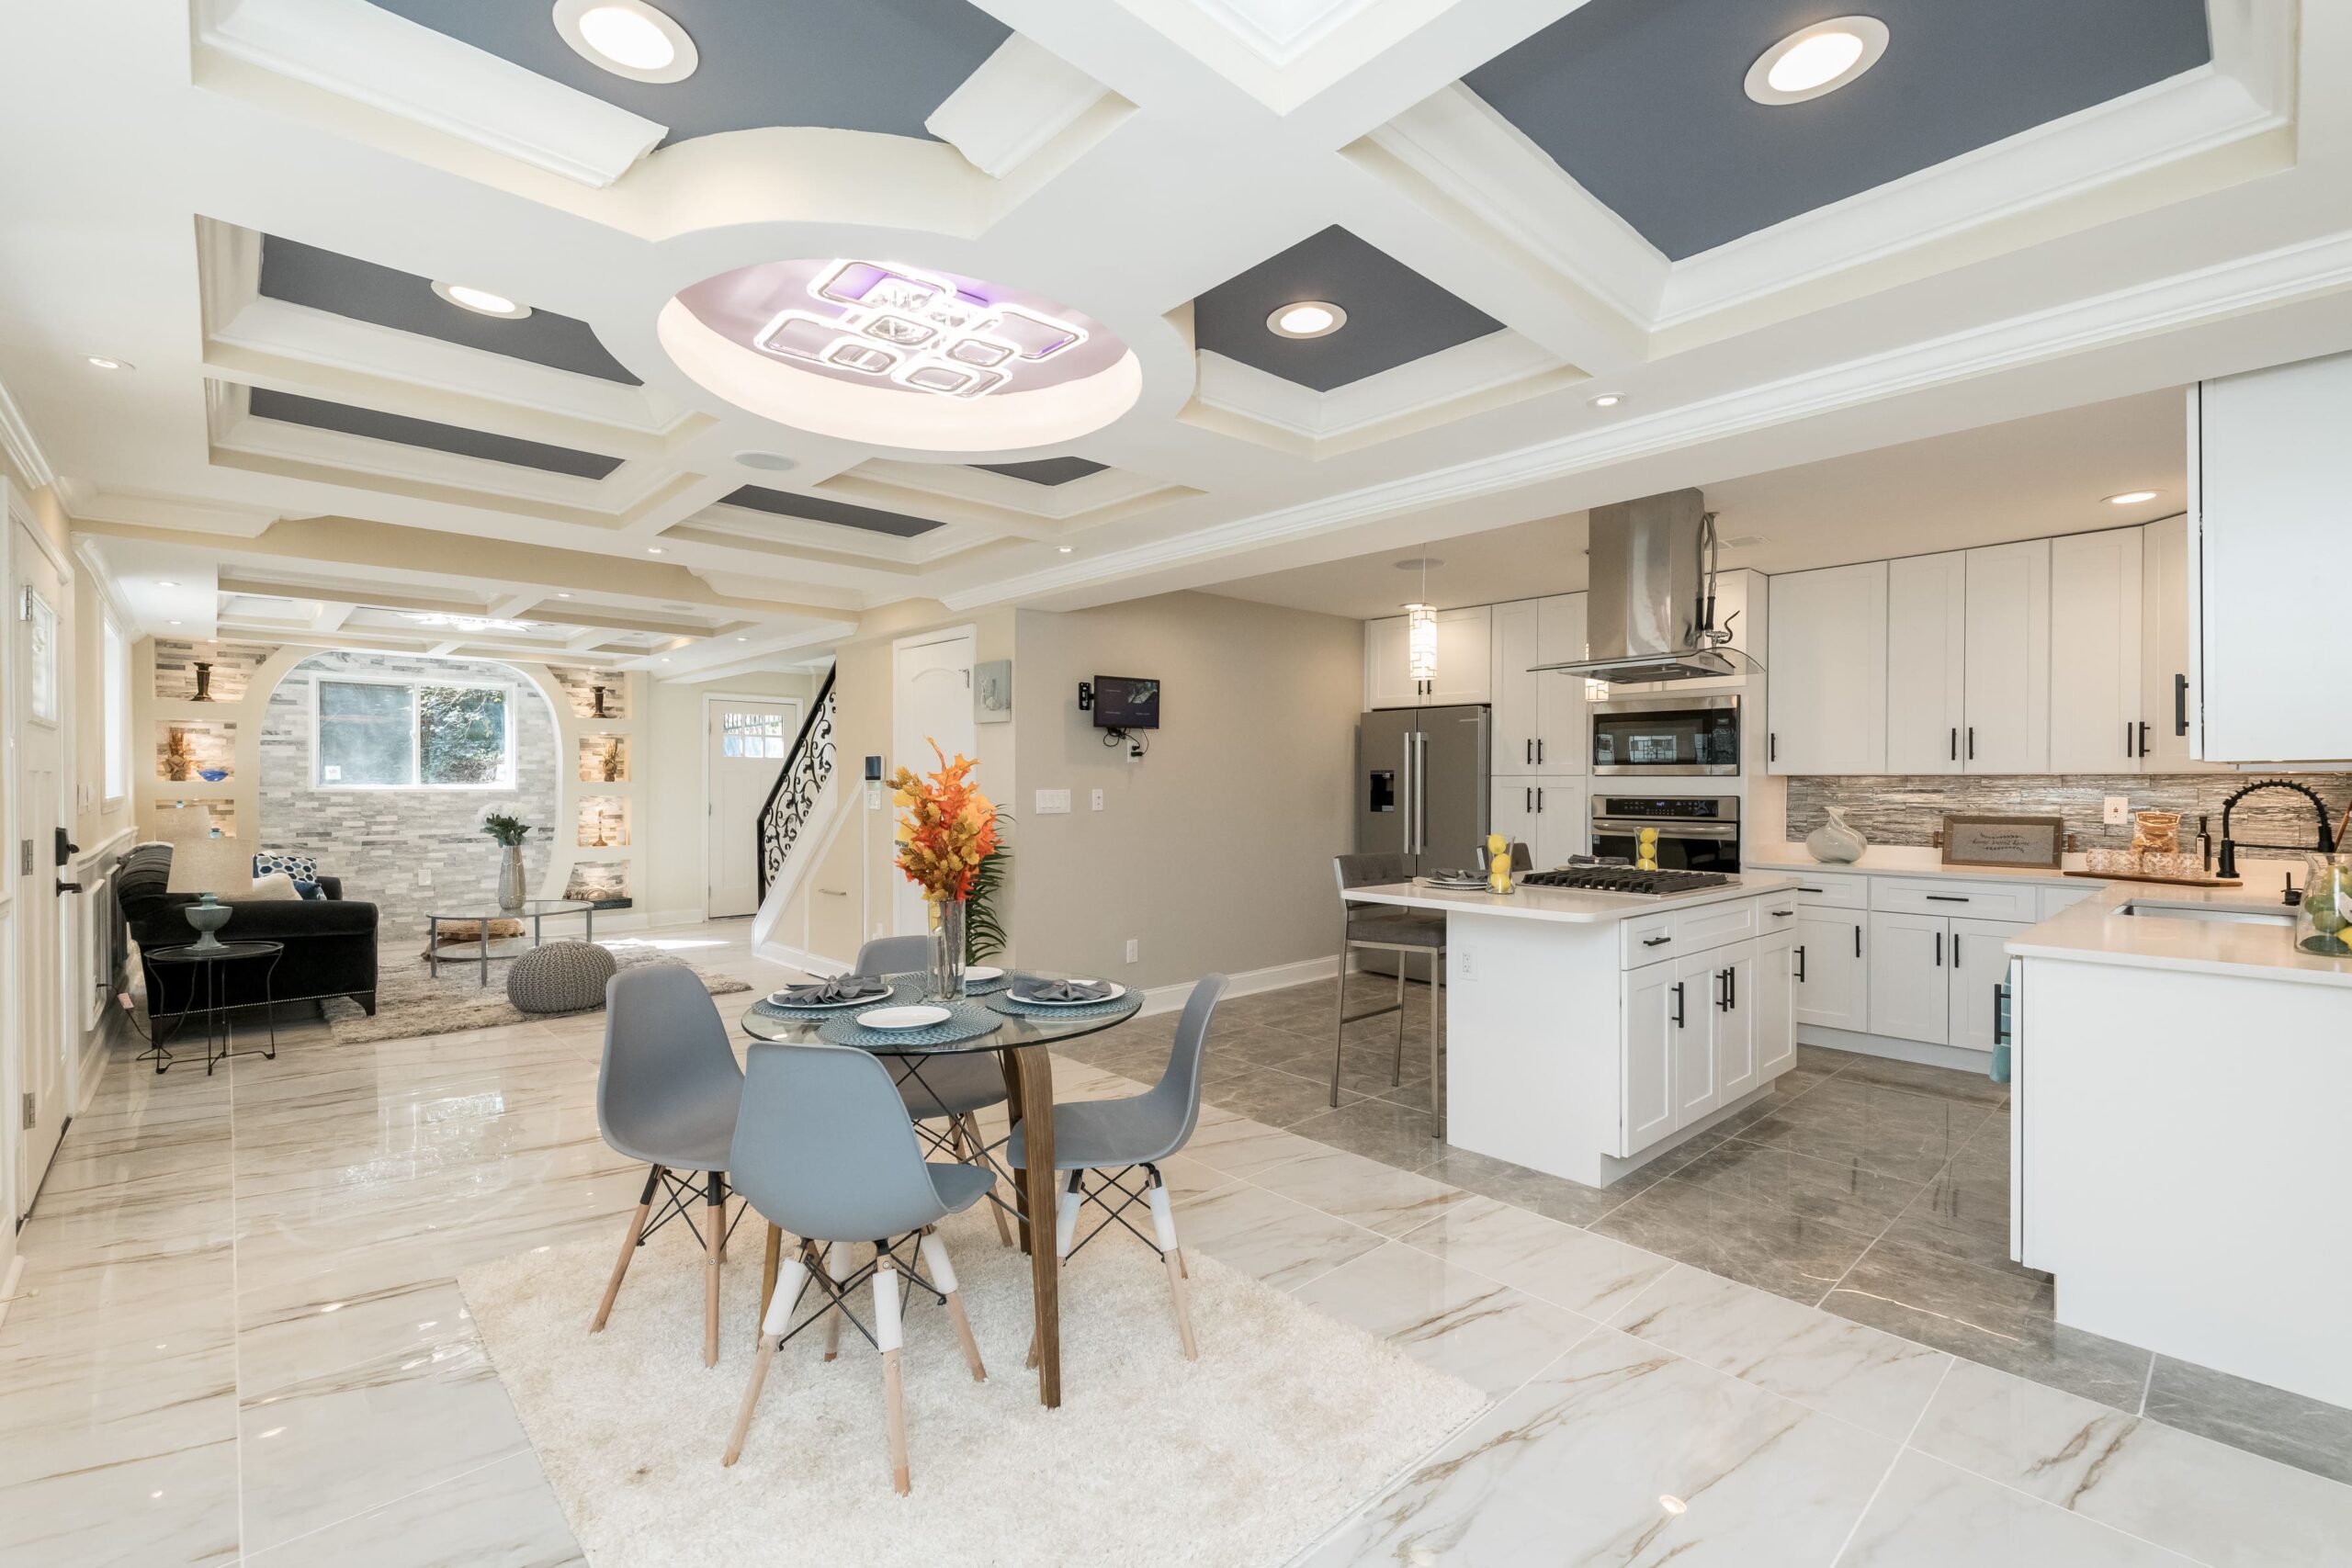
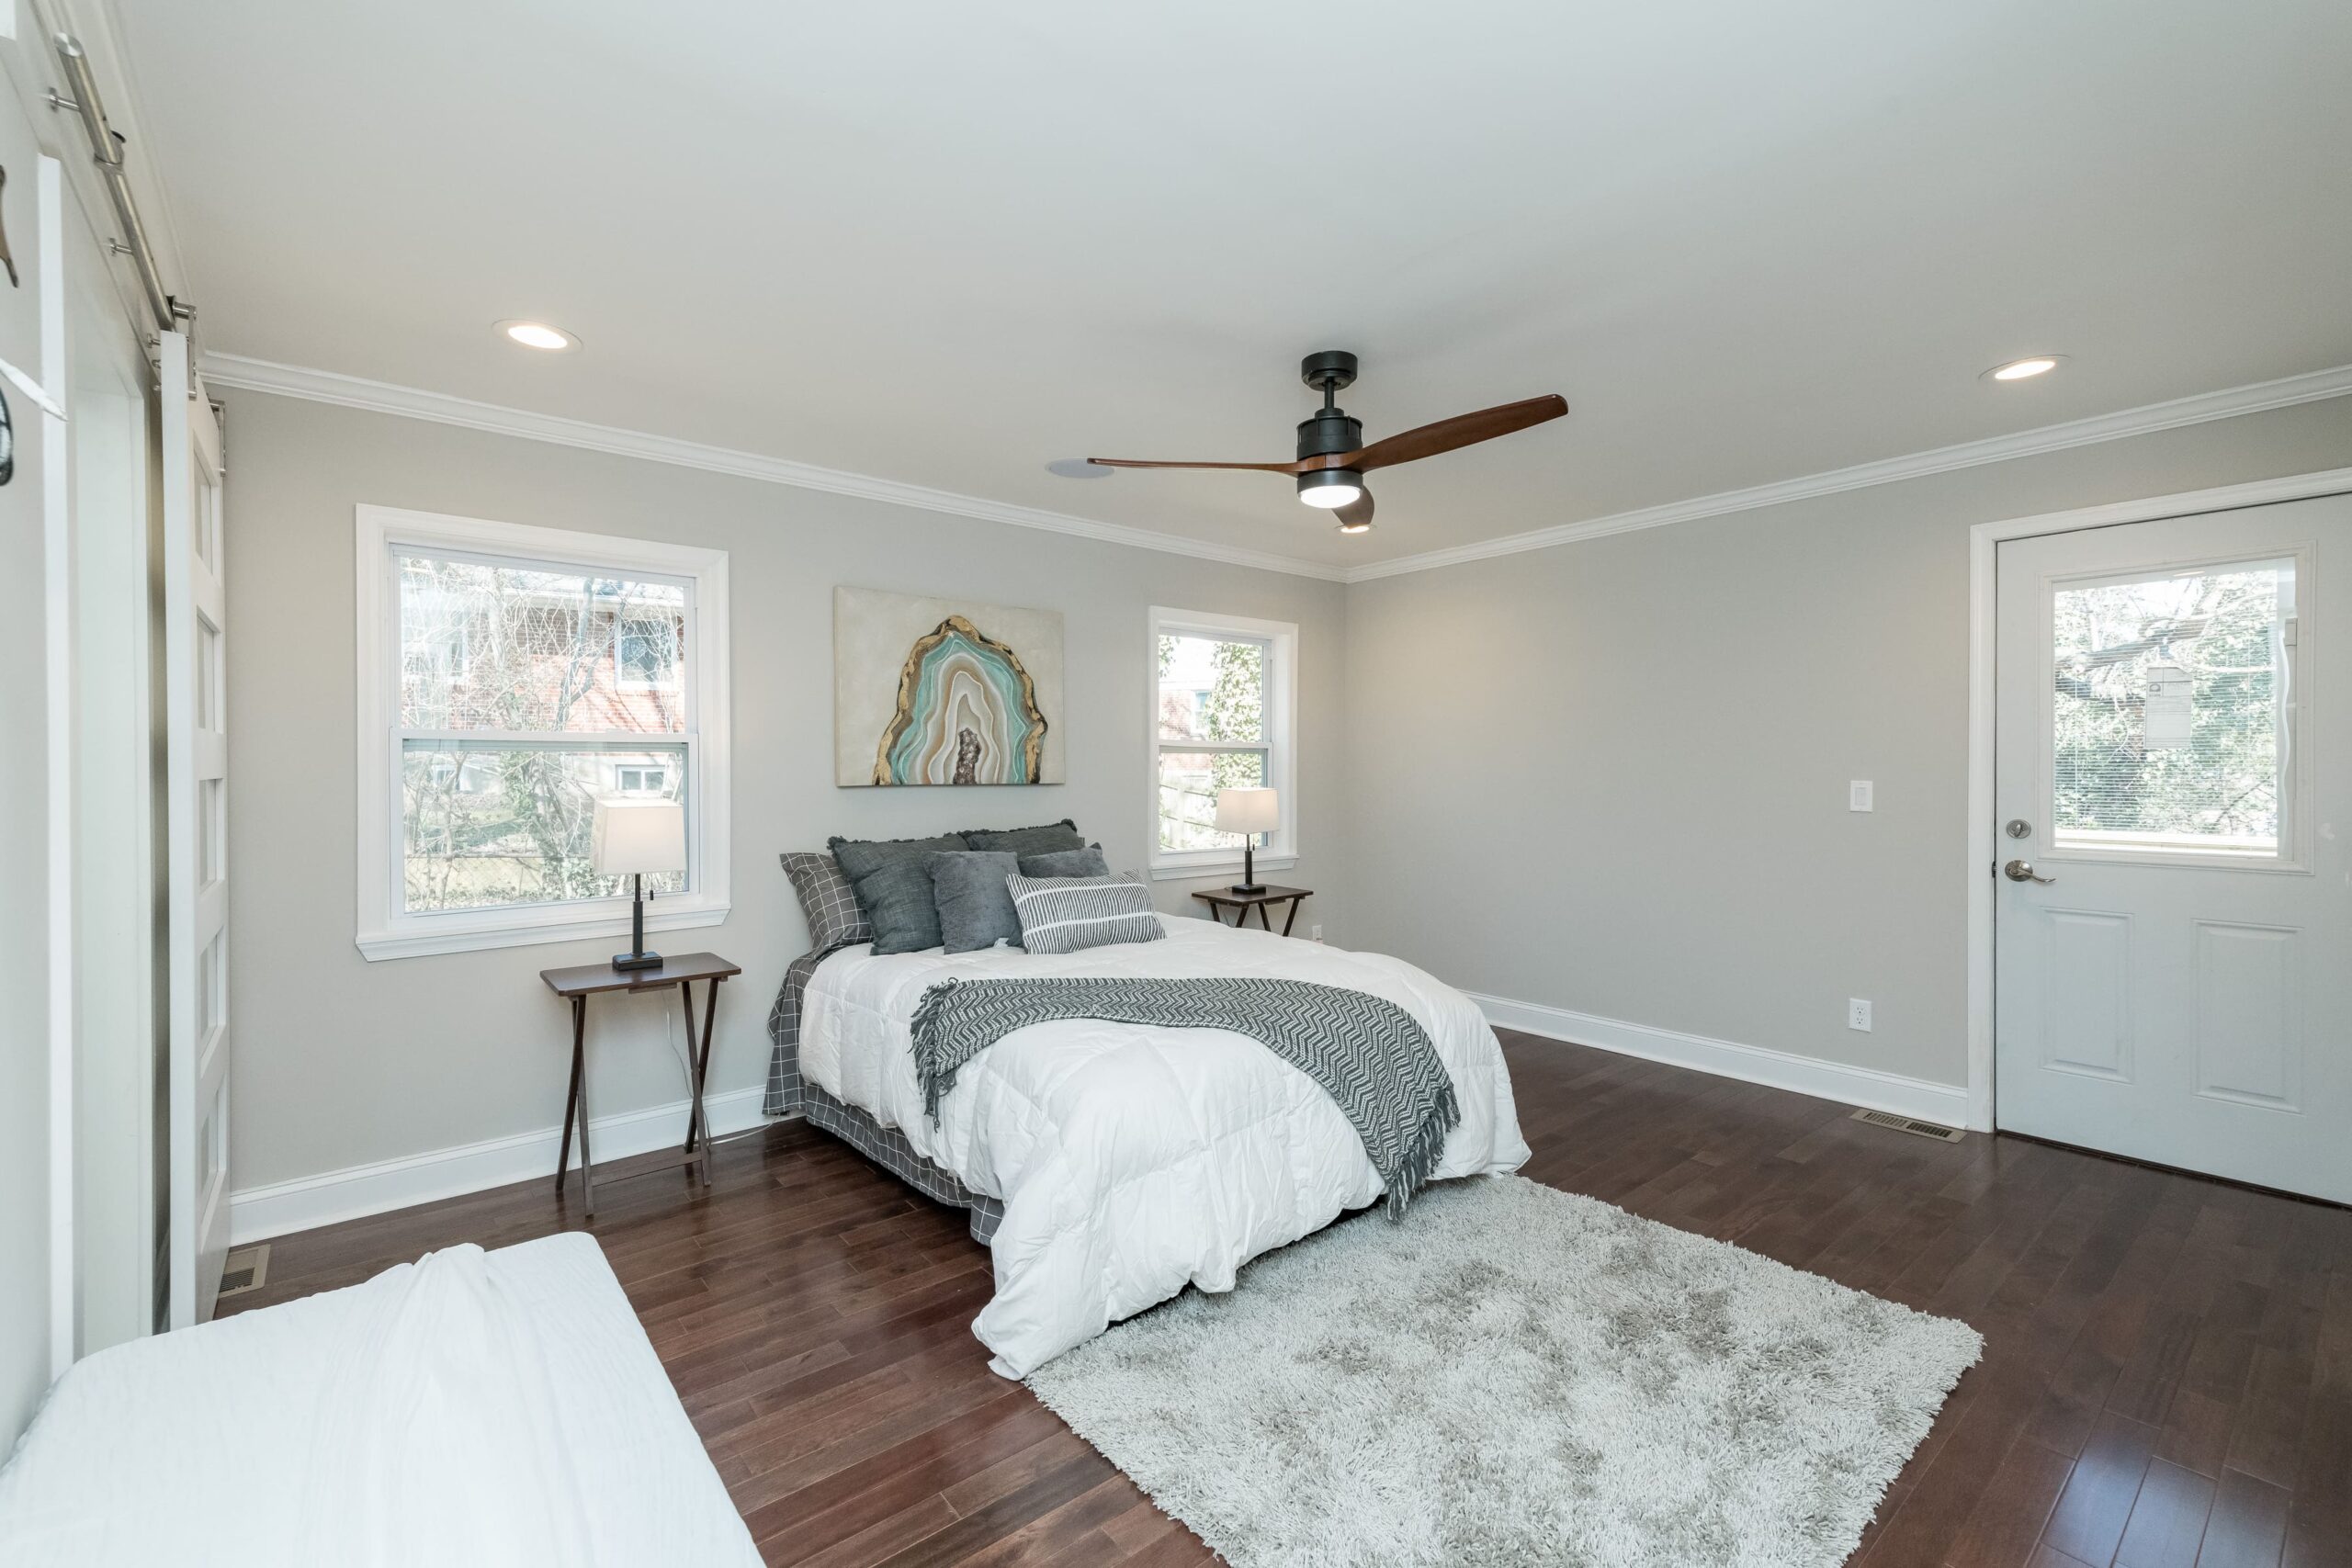
Ideally set near highways and Sligo Creek Stream Valley Park in Flora Ct, Silver Spring, MD, Apex Luxurious Living is an esteemed community that provides assisted living. Featuring cozy and luxurious accommodations, residents will surely have the time of their lives, accompanied by a variety of care services from a compassionate and well-trained team available around the clock. Medication assistance, mobility assistance and continence maintenance are also offered to ensure residents comfort and wellness.
Join a variety of activities and programs tailored to your interests and needs to remain socially engaged and live actively. The community also coordinates with trusted medical providers for residents’ medical needs; transportation coordination is also available for residents to conveniently travel for their medical appointments and errands. Meal preparation, laundry, and other household chores are handled by the community for a hassle-free dining. Experience the best of your later years in luxury with the community’s top-tier services and high-quality amenities.
Types of Care at APEX Luxurious Living
Assisted Living
5-bed community Rank #472 / 705Bed count — State benchmarkedThis home is ranked 472nd out of 705 homes in Maryland. Shows this facility's certified or reported bed count compared to other Maryland SNFs. Larger communities may offer more amenities, programs, and on-site services for residents and families.Click the rank badge to see the full State ranking.Click here to see the full State ranking.
A smaller, more intimate setting that may offer a quieter environment and closer staff-resident interactions.
Walk Score: 68 / 100 Rank #214 / 986Walk Score — State benchmarkedThis home is ranked 214th out of 986 homes in Maryland. Shows how walkable this facility's neighborhood is compared to the average Walk Score across Maryland SNFs. Higher scores benefit residents, families, and staff.Click the rank badge to see the full State ranking.Click here to see the full State ranking.
Moderately walkable. Some errands can be accomplished on foot, with a mix of nearby amenities.
About this community
AwardsBest in Assisted Living
CountyMontgomery
Emergency SystemsEmergency Call System
Safety FeaturesAdvanced safety and security features, including 24/7 monitoring and emergency response systems.
Staffing
Key information about the people who lead and staff this community.
No CNA training program
Licensed Nurses/CNAs
24-Hour Staffing
No mild Alzheimer's level
No moderate Alzheimer's level
No severe Alzheimer's level
ActivitiesCustomized activity programs tailored to individual interests and abilities, including diverse cultural, educational, and recreational activities.
Specific ProgramsCare staff at the community 24-hours a day, 7-days a week, Personal care assistance with activities of daily living, Medication assistance and administration, Mobility assistance, Continence maintenance, Robust Activity Calendar, Housekeeping and Laundry, Nursing Oversight, Care Coordination with Medical Providers, Transportation Coordination, Pharmacy Delivery Service, A safe, secure residence and community.
Food DescriptionNutritious, well-balanced meal preparation, with a focus on dietary management to meet specific health requirements and personal culinary preferences.
What does this home offer?
Housing Options: Private / Semi-Private Rooms
Building Type: 2-story
Dining Services
Housekeeping Services
Transportation Services
Recreational Activities
Security Systems
Places of interest near APEX Luxurious Living
![]() 2.0 miles from city center
2.0 miles from city center
![]() Estimated distance in miles from Silver Spring's city center to APEX Luxurious Living's address, calculated via Google Maps.
Estimated distance in miles from Silver Spring's city center to APEX Luxurious Living's address, calculated via Google Maps.
Calculate Travel Distance to APEX Luxurious Living
Add your location
Financial Assistance for
Assisted Living in Maryland
APEX Luxurious Living is located in Silver Spring, Maryland.
Here are the financial assistance programs available to residents in Maryland.
Compare Assisted Living around Silver Spring
The information below is reported by the Maryland Department of Health, Office of Health Care Quality.
Filter by care type
|
|
|
|
|
|
|
|
|
|
|
|
|
|
|
|
|
|
|---|---|---|---|---|---|---|---|---|---|---|---|---|---|---|---|---|
| Sunrise of Chevy Chase |
AL
Assisted Living A licensed, long-term care setting for seniors or individuals with disabilities who need help with daily activities — like bathing, dressing, and medication management — but not 24-hour skilled nursing. Offers housing, meals, and around-the-clock support while aiming to maximize resident independence.
MC
Memory Care Secured, specialized care for people living with Alzheimer's or dementia. Staff trained in cognitive impairment, with higher staff-to-resident ratios and an environment designed to reduce confusion and wandering risk. |
Silver Spring (Rock Creek Gardens) | 196 | No | 71 | Private / Semi-Private Rooms | 8 |
58%
Male Residents — State Benchmarked 58% of residents are male, compared to the Maryland average of 31%. An unusually high male share for assisted living, where most facilities skew heavily female. |
42%
Female Residents — State Benchmarked 42% of residents are female, compared to the Maryland average of 69%. An unusually low female share — most assisted living facilities have 65–75% female residents. |
69%
White Residents — State Benchmarked 69% of residents are reported as White, compared to the Maryland average of 82%. A lower White share than the Maryland average — the community may draw a more diverse resident mix relative to other facilities in Maryland. |
28%
African American Residents — State Benchmarked 28% of residents are reported as African American or Black, compared to the Maryland average of 12%. A higher African American share than the typical Maryland average — useful context when comparing cultural fit and community composition. |
3%
Other Ethnicity Residents — State Benchmarked 3% of residents fall into categories other than White or African American (combined), compared to the Maryland average of 6%. This column aggregates Hispanic, Asian, multiracial, and any other labeled groups that are not classified as White or African American. Reported subgroups in this total: Hispanic (2%), Asian (1%). |
12%
Residents Age 65–74 — State Benchmarked 12% of residents are 65–74, compared to the Maryland average of 12%. In line with the statewide profile for this youngest senior bracket in assisted living. |
39%
Residents Age 75–84 — State Benchmarked 39% of residents are 75–84, compared to the Maryland average of 31%. A high concentration in this mid-range bracket, where residents typically need moderate support with daily activities. |
42%
Residents Age 85–94 — State Benchmarked 42% of residents are 85–94, compared to the Maryland average of 44%. This is typically the most common age bracket in assisted living — this facility is in line with the statewide norm. |
6%
Residents Age 95+ — State Benchmarked 6% of residents are 95 or older, compared to the Maryland average of 16%. Most residents here have not yet reached the oldest-old bracket, suggesting a younger overall community. |
| Brightview Crofton Riverwalk |
AL
Assisted Living A licensed, long-term care setting for seniors or individuals with disabilities who need help with daily activities — like bathing, dressing, and medication management — but not 24-hour skilled nursing. Offers housing, meals, and around-the-clock support while aiming to maximize resident independence.
IL
Independent Living Lifestyle-focused communities for older adults offering dining, activities, and transportation with minimal personal care. Best for active, independent seniors who want community without medical support.
MC
Memory Care Secured, specialized care for people living with Alzheimer's or dementia. Staff trained in cognitive impairment, with higher staff-to-resident ratios and an environment designed to reduce confusion and wandering risk. |
Crofton | 92 | Yes | 45 | Private / Semi-Private Rooms | 6 |
27%
Male Residents — State Benchmarked 27% of residents are male, compared to the Maryland average of 31%. This facility caters to a majority female resident pool (73% female), consistent with the broader assisted living trend where women significantly outnumber men. |
73%
Female Residents — State Benchmarked 73% of residents are female, compared to the Maryland average of 69%. Women comprise the large majority, consistent with national assisted living demographics where women live longer and enter care facilities at higher rates. |
0%
White Residents — State Benchmarked 0% of residents are reported as White, compared to the Maryland average of 82%. A lower White share than the Maryland average — the community may draw a more diverse resident mix relative to other facilities in Maryland. |
0%
African American Residents — State Benchmarked 0% of residents are reported as African American or Black, compared to the Maryland average of 12%. A lower African American share than is typical in Maryland; local markets still vary widely. |
100%
Other Ethnicity Residents — State Benchmarked 100% of residents fall into categories other than White or African American (combined), compared to the Maryland average of 6%. This column aggregates Hispanic, Asian, multiracial, and any other labeled groups that are not classified as White or African American. Reported subgroups in this total: Other (100%). |
- | - | - | - |
| Sunrise of Silver Spring |
AL
Assisted Living A licensed, long-term care setting for seniors or individuals with disabilities who need help with daily activities — like bathing, dressing, and medication management — but not 24-hour skilled nursing. Offers housing, meals, and around-the-clock support while aiming to maximize resident independence.
MC
Memory Care Secured, specialized care for people living with Alzheimer's or dementia. Staff trained in cognitive impairment, with higher staff-to-resident ratios and an environment designed to reduce confusion and wandering risk. |
Silver Spring (New Hampshire Avenue) | 84 | Yes | 40 | Private / Semi-Private Rooms | 24 |
31%
Male Residents — State Benchmarked 31% of residents are male, compared to the Maryland average of 31%. This facility caters to a majority female resident pool (69% female), consistent with the broader assisted living trend where women significantly outnumber men. |
69%
Female Residents — State Benchmarked 69% of residents are female, compared to the Maryland average of 69%. Women comprise the large majority, consistent with national assisted living demographics where women live longer and enter care facilities at higher rates. |
53%
White Residents — State Benchmarked 53% of residents are reported as White, compared to the Maryland average of 82%. A lower White share than the Maryland average — the community may draw a more diverse resident mix relative to other facilities in Maryland. |
39%
African American Residents — State Benchmarked 39% of residents are reported as African American or Black, compared to the Maryland average of 12%. A higher African American share than the typical Maryland average — useful context when comparing cultural fit and community composition. |
9%
Other Ethnicity Residents — State Benchmarked 9% of residents fall into categories other than White or African American (combined), compared to the Maryland average of 6%. This column aggregates Hispanic, Asian, multiracial, and any other labeled groups that are not classified as White or African American. Reported subgroups in this total: Asian (4%), Hawaiian/Pacific Islander (3%), Hispanic (1%). |
4%
Residents Age 65–74 — State Benchmarked 4% of residents are 65–74, compared to the Maryland average of 12%. Fewer younger seniors suggests the resident population skews older, likely requiring higher acuity care and more hands-on support. |
43%
Residents Age 75–84 — State Benchmarked 43% of residents are 75–84, compared to the Maryland average of 31%. A high concentration in this mid-range bracket, where residents typically need moderate support with daily activities. |
37%
Residents Age 85–94 — State Benchmarked 37% of residents are 85–94, compared to the Maryland average of 44%. The population here skews younger than the statewide norm, which may indicate a more active, lower-acuity community. |
14%
Residents Age 95+ — State Benchmarked 14% of residents are 95 or older, compared to the Maryland average of 16%. In line with the statewide profile for the oldest resident bracket. |
| Seaton Silver Spring |
AL
Assisted Living A licensed, long-term care setting for seniors or individuals with disabilities who need help with daily activities — like bathing, dressing, and medication management — but not 24-hour skilled nursing. Offers housing, meals, and around-the-clock support while aiming to maximize resident independence.
IL
Independent Living Lifestyle-focused communities for older adults offering dining, activities, and transportation with minimal personal care. Best for active, independent seniors who want community without medical support.
RC
Respite Care Short-term temporary care — days to weeks — to give family caregivers a break. Full care provided during the stay. Often used after hospitalization or to trial a facility before a permanent placement decision. |
Silver Spring (Homecrest Road) | 55 | Yes | 33 | Private / Semi-Private Rooms | 36 |
15%
Male Residents — State Benchmarked 15% of residents are male, compared to the Maryland average of 31%. This facility caters to a majority female resident pool (85% female), consistent with the broader assisted living trend where women significantly outnumber men. |
85%
Female Residents — State Benchmarked 85% of residents are female, compared to the Maryland average of 69%. Women comprise the large majority, consistent with national assisted living demographics where women live longer and enter care facilities at higher rates. |
79%
White Residents — State Benchmarked 79% of residents are reported as White, compared to the Maryland average of 82%. Close to the average for this category among assisted living facilities in Maryland with reported race/ethnicity data. |
21%
African American Residents — State Benchmarked 21% of residents are reported as African American or Black, compared to the Maryland average of 12%. A higher African American share than the typical Maryland average — useful context when comparing cultural fit and community composition. |
0%
Other Ethnicity Residents — State Benchmarked 0% of residents fall into categories other than White or African American (combined), compared to the Maryland average of 6%. This column aggregates Hispanic, Asian, multiracial, and any other labeled groups that are not classified as White or African American. |
9%
Residents Age 65–74 — State Benchmarked 9% of residents are 65–74, compared to the Maryland average of 12%. In line with the statewide profile for this youngest senior bracket in assisted living. |
21%
Residents Age 75–84 — State Benchmarked 21% of residents are 75–84, compared to the Maryland average of 31%. Below the state norm — the resident mix may skew either younger or older than this typical middle bracket. |
38%
Residents Age 85–94 — State Benchmarked 38% of residents are 85–94, compared to the Maryland average of 44%. The population here skews younger than the statewide norm, which may indicate a more active, lower-acuity community. |
32%
Residents Age 95+ — State Benchmarked 32% of residents are 95 or older, compared to the Maryland average of 16%. A high proportion of the oldest-old suggests strong end-of-life care experience and very-high-acuity capabilities. |
| APEX Luxurious Living |
AL
Assisted Living A licensed, long-term care setting for seniors or individuals with disabilities who need help with daily activities — like bathing, dressing, and medication management — but not 24-hour skilled nursing. Offers housing, meals, and around-the-clock support while aiming to maximize resident independence. |
Silver Spring (Woodside Forest) | 5 | No | 68 | Private / Semi-Private Rooms | - | - | - | - | - | - | - | - | - | - |
Frequently Asked Questions about APEX Luxurious Living
What neighborhood is APEX Luxurious Living in?
APEX Luxurious Living is in the Woodside Forest neighborhood of Silver Spring.
Is APEX Luxurious Living in a walkable area?
APEX Luxurious Living has a walk score of 68. Moderately walkable. Some errands can be accomplished on foot, with a mix of nearby amenities.
How many beds does APEX Luxurious Living have?
APEX Luxurious Living has 5 beds.
Are there photos of APEX Luxurious Living?
Yes — there are 11 photos of APEX Luxurious Living in the photo gallery on this page.
What is the address of APEX Luxurious Living?
APEX Luxurious Living is located at 1520 Flora Ct, Silver Spring, MD 20910.
What is the phone number of APEX Luxurious Living?
(202) 760-1760 will put you in contact with the team at APEX Luxurious Living.
What county is APEX Luxurious Living located in?
APEX Luxurious Living is in Montgomery County.
Guides for Better Senior Living
Care Cost Calculator: See Prices in Your Area
Nursing Home Data Explorer
Don’t Wait Too Long: 7 Red Flag Signs Your Parent Needs Assisted Living Now
The True Cost of Assisted Living in 2025 – And How Families Are Paying For It
Understanding Senior Living Costs: Pricing Models, Discounts & Financial Assistance
Contact Us

Published on
Updated on
Feedback
Write a review for APEX Luxurious Living
Rate your overall experience with this community
Explore Open Rooms
1
Contact details
2
What type of senior care service are you looking for?
3
What budget do you have in mind for senior care?
4
How soon do you need to find care?
5
Additional details
Thank you for your interest!
Our team will be in touch shortly to help with next steps.
Need Help?
Let us help you or a loved one find the perfect senior home.
