


Apple Blossoms Assisted Living
Assisted Living & Respite Care · Silver Spring, MD


Apple Blossoms Assisted Living
Assisted Living & Respite Care · Silver Spring, MD
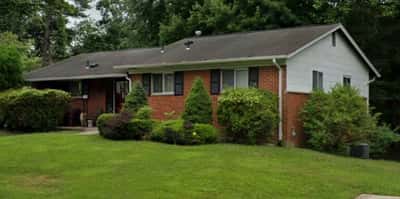
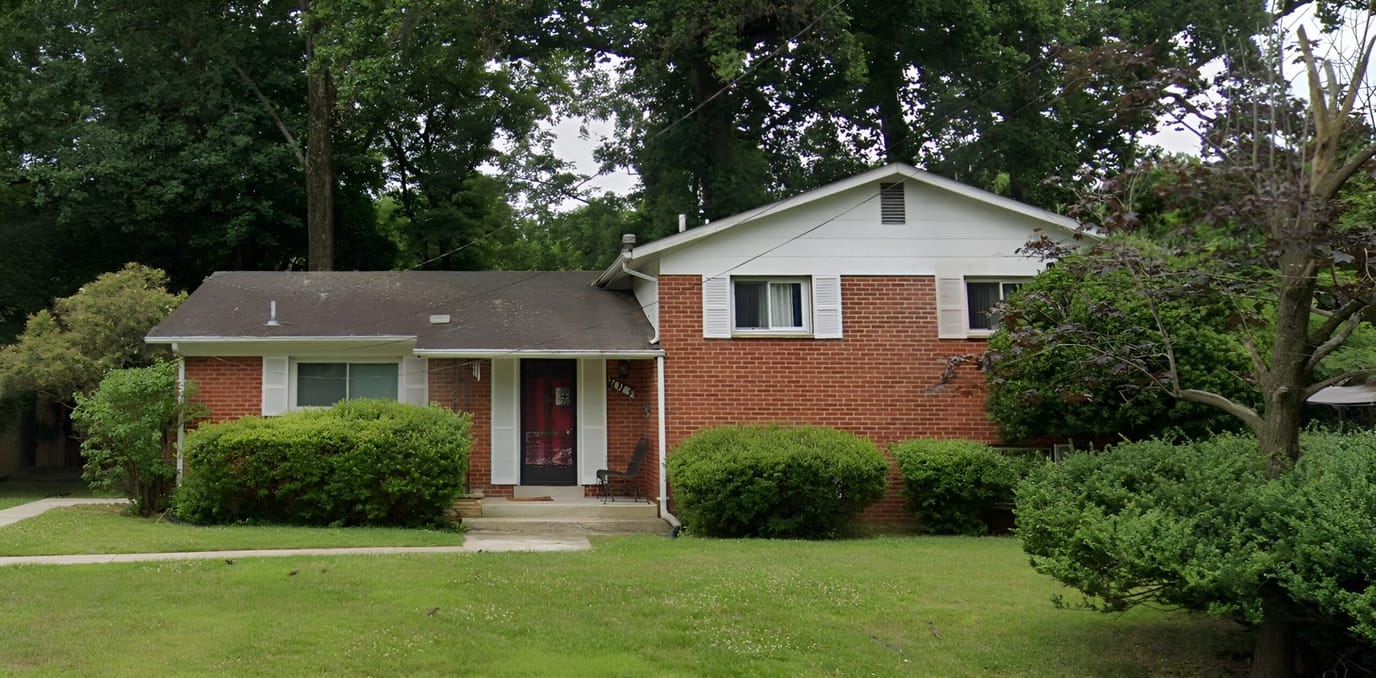
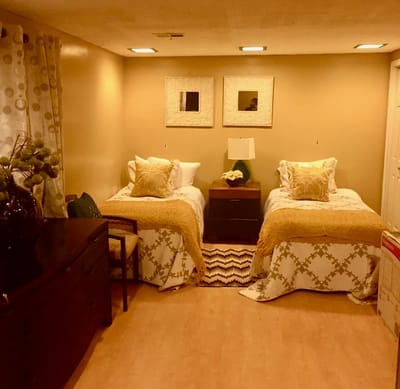
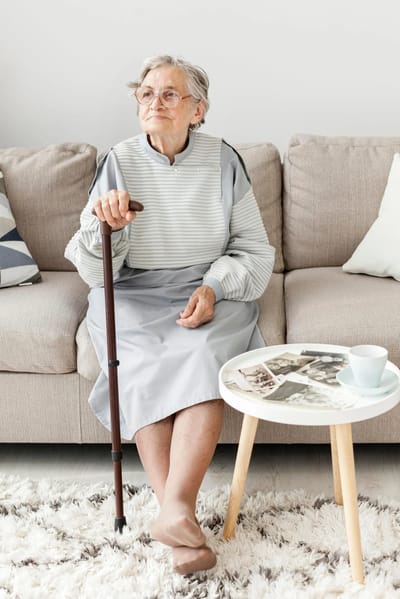
Apple Blossoms Assisted Living is an intimate community in Silver Spring, MD, designed to provide residents a safe and nurturing environment for assisted living. Their reliable team is always available on-site to help residents with their daily living activities while preserving their level of independence. There are cozy and spacious semi-private and private accommodations for residents to choose from, depending on their preferences and needs for guaranteed comfort and peace of mind.
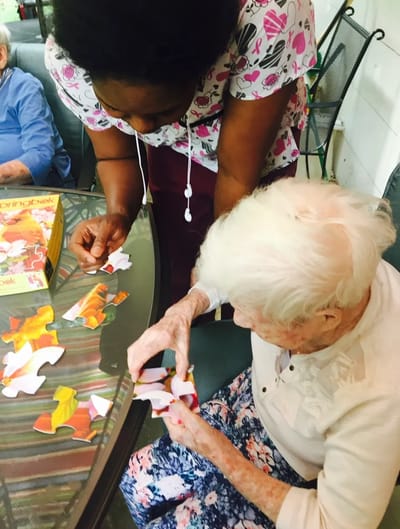
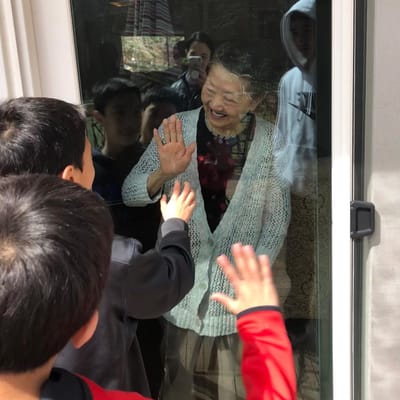
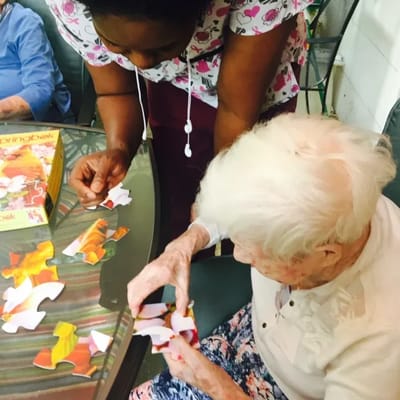
The community also provides short-term stays for residents with caregivers looking to enjoy a much-deserved break from caregiving. Recreation for all levels of abilities and various interests is also available to ensure residents are able to maintain an active and socially engaged lifestyle. To help them maintain proper nutrition, their team also handles the meal preparation and serves fresh, healthy meals daily. Here, you can live your golden years with ease while being surrounded by genuine and compassionate care.
5-bed community Rank #436 / 697Bed count — State benchmarkedThis home is ranked 436th out of 697 homes in Maryland for bed count. Shows this facility's certified or reported bed count compared to other Maryland SNFs. Larger communities may offer more amenities, programs, and on-site services for residents and families.Click the rank badge to see the full State ranking.Click here to see the full State ranking.
A smaller, more intimate setting that may offer a quieter environment and closer staff-resident interactions.
Walk Score: 6 / 100 Rank #891 / 985Walk Score — State benchmarkedThis home is ranked 891st out of 985 homes in Maryland for walk score. Shows how walkable this facility's neighborhood is compared to the average Walk Score across Maryland SNFs. Higher scores benefit residents, families, and staff.Click the rank badge to see the full State ranking.Click here to see the full State ranking.
Car-dependent. Most errands require a car, with limited nearby walkable options.
About this community
Facility TypeAl
CountyPrince George's
State License TypesApproved level 3 residence
Emergency SystemsYes
Staffing
Key information about the people who lead and staff this community.
No CNA training program
Rehabilitation Services
Respite Care
Licensed Nurses/CNAs
Staff-to-Resident Ratio:
1:5
No mild Alzheimer's level
No moderate Alzheimer's level
No severe Alzheimer's level
Pets Allowed
Admission CriteriaIndividuals who require ongoing care and daily support but no longer need hospitalization.
Linen ServiceYes
Transportation
Housekeeping
Laundry
Wellness ProgramRecreational activities to promote well-being
Specific ProgramsAssisted Living Facility
Food DescriptionThe facility offers healthy meals and snacks, with an emphasis on home-cooked meals that honor residents' personal food preferences.
What does this home offer?
Housing Options: Private / Semi-Private Rooms
Building Type: Single-story
Housekeeping Services
Recreational Activities

Health Programs
Apple Blossoms Assisted Living Reviews
Perry Degener
Apple Blossoms should be your number one pick if you want a warm and professional approach to assisted living for your precious loved one. Why? Because the head of Apple Blossoms, is an experienced caregiver who has created a special, family-style environment that provides individualized attention for each of the residents. Because the nurses are jewels, chosen for their qualities of patience, caring, and experience. Because, tasty, homemade meals are provided three times a day and two snacks (with some tweaks, tailored to each resident’s preferences). Because my precious mother was blessed to have spent her final time of life in its peaceful embrace. Therefore, if you are looking for a place with folks who will learn to build a special relationship with your loved one, watchful for anything that might affect their health or comfort, there is no better choice than Apple Blossoms. –Perry Degener, Silver Spring.
Apple Blossoms should be your number one pick if you want a warm and professional approach to assisted living for your precious loved one. Why? Because the head of Apple Blossoms, is an experienced caregiver who has created a special, family-style environment that provides individualized attention for each of the residents. Because the nurses are jewels, chosen for their qualities of patience, caring, and experience. Because, tasty, homemade meals are provided three times a day and two snacks (with some tweaks, tailored to each resident’s preferences). Because my precious mother was blessed to have spent her final time of life in its peaceful embrace. Therefore, if you are looking for a place with folks who will learn to build a special relationship with your loved one, watchful for anything that might affect their health or comfort, there is no better choice than Apple Blossoms. –Perry Degener, Silver Spring.
Places of interest near Apple Blossoms Assisted Living
![]() 5.9 miles from city center
5.9 miles from city center
![]() Estimated distance in miles from Silver Spring's city center to Apple Blossoms Assisted Living's address, calculated via Google Maps.
Estimated distance in miles from Silver Spring's city center to Apple Blossoms Assisted Living's address, calculated via Google Maps.
Calculate Travel Distance to Apple Blossoms Assisted Living
Add your location
Compare Assisted Living around Silver Spring
The information below is reported by the Maryland Department of Health, Office of Health Care Quality.
Filter by care type
| Sunrise of Chevy Chase |
AL Assisted Living A licensed, long-term care setting for seniors or individuals with disabilities who need help with daily activities — like bathing, dressing, and medication management — but not 24-hour skilled nursing. Offers housing, meals, and around-the-clock support while aiming to maximize resident independence.
MC Memory Care Secured, specialized care for people living with Alzheimer's or dementia. Staff trained in cognitive impairment, with higher staff-to-resident ratios and an environment designed to reduce confusion and wandering risk. | Silver Spring (Rock Creek Gardens) | 196
Facility
196
MD AVG
44
Rank
#11 / 697 | No |
71
Facility
71
MD AVG
43
Rank
#175 / 985 | Private / Semi-Private Rooms | 8
Facility
8
MD AVG
21
Rank
#162 / 208 |
58% Male Residents — State Benchmarked 58% of residents are male, compared to the Maryland average of 31%. An unusually high male share for assisted living, where most facilities skew heavily female. |
42% Female Residents — State Benchmarked 42% of residents are female, compared to the Maryland average of 69%. An unusually low female share — most assisted living facilities have 65–75% female residents. |
69% White Residents — State Benchmarked 69% of residents are reported as White, compared to the Maryland average of 81%. A lower White share than the Maryland average — the community may draw a more diverse resident mix relative to other facilities in Maryland. |
28% African American Residents — State Benchmarked 28% of residents are reported as African American or Black, compared to the Maryland average of 13%. A higher African American share than the typical Maryland average — useful context when comparing cultural fit and community composition. |
3% Other Ethnicity Residents — State Benchmarked 3% of residents fall into categories other than White or African American (combined), compared to the Maryland average of 6%. This column aggregates Hispanic, Asian, multiracial, and any other labeled groups that are not classified as White or African American. Reported subgroups in this total: Hispanic (2%), Asian (1%). |
12% Residents Age 65–74 — State Benchmarked 12% of residents are 65–74, compared to the Maryland average of 13%. In line with the statewide profile for this youngest senior bracket in assisted living. |
39% Residents Age 75–84 — State Benchmarked 39% of residents are 75–84, compared to the Maryland average of 31%. A high concentration in this mid-range bracket, where residents typically need moderate support with daily activities. |
42% Residents Age 85–94 — State Benchmarked 42% of residents are 85–94, compared to the Maryland average of 44%. This is typically the most common age bracket in assisted living — this facility is in line with the statewide norm. |
6% Residents Age 95+ — State Benchmarked 6% of residents are 95 or older, compared to the Maryland average of 16%. Most residents here have not yet reached the oldest-old bracket, suggesting a younger overall community. |
| Brightview Crofton Riverwalk |
AL Assisted Living A licensed, long-term care setting for seniors or individuals with disabilities who need help with daily activities — like bathing, dressing, and medication management — but not 24-hour skilled nursing. Offers housing, meals, and around-the-clock support while aiming to maximize resident independence.
IL Independent Living Lifestyle-focused communities for older adults offering dining, activities, and transportation with minimal personal care. Best for active, independent seniors who want community without medical support.
MC Memory Care Secured, specialized care for people living with Alzheimer's or dementia. Staff trained in cognitive impairment, with higher staff-to-resident ratios and an environment designed to reduce confusion and wandering risk. | Crofton | 92
Facility
92
MD AVG
44
Rank
#159 / 697 | Yes |
45
Facility
45
MD AVG
43
Rank
#475 / 985 | Private / Semi-Private Rooms | 6
Facility
6
MD AVG
21
Rank
#176 / 208 |
27% Male Residents — State Benchmarked 27% of residents are male, compared to the Maryland average of 31%. This facility caters to a majority female resident pool (73% female), consistent with the broader assisted living trend where women significantly outnumber men. |
73% Female Residents — State Benchmarked 73% of residents are female, compared to the Maryland average of 69%. Women comprise the large majority, consistent with national assisted living demographics where women live longer and enter care facilities at higher rates. |
0% White Residents — State Benchmarked 0% of residents are reported as White, compared to the Maryland average of 81%. A lower White share than the Maryland average — the community may draw a more diverse resident mix relative to other facilities in Maryland. |
0% African American Residents — State Benchmarked 0% of residents are reported as African American or Black, compared to the Maryland average of 13%. A lower African American share than is typical in Maryland; local markets still vary widely. |
100% Other Ethnicity Residents — State Benchmarked 100% of residents fall into categories other than White or African American (combined), compared to the Maryland average of 6%. This column aggregates Hispanic, Asian, multiracial, and any other labeled groups that are not classified as White or African American. Reported subgroups in this total: Other (100%). | - | - | - | - |
| Sunrise of Silver Spring |
AL Assisted Living A licensed, long-term care setting for seniors or individuals with disabilities who need help with daily activities — like bathing, dressing, and medication management — but not 24-hour skilled nursing. Offers housing, meals, and around-the-clock support while aiming to maximize resident independence.
MC Memory Care Secured, specialized care for people living with Alzheimer's or dementia. Staff trained in cognitive impairment, with higher staff-to-resident ratios and an environment designed to reduce confusion and wandering risk. | Silver Spring (New Hampshire Avenue) | 84
Facility
84
MD AVG
44
Rank
#174 / 697 | Yes |
40
Facility
40
MD AVG
43
Rank
#523 / 985 | Private / Semi-Private Rooms | 24
Facility
24
MD AVG
21
Rank
#92 / 208 |
31% Male Residents — State Benchmarked 31% of residents are male, compared to the Maryland average of 31%. This facility caters to a majority female resident pool (69% female), consistent with the broader assisted living trend where women significantly outnumber men. |
69% Female Residents — State Benchmarked 69% of residents are female, compared to the Maryland average of 69%. Women comprise the large majority, consistent with national assisted living demographics where women live longer and enter care facilities at higher rates. |
53% White Residents — State Benchmarked 53% of residents are reported as White, compared to the Maryland average of 81%. A lower White share than the Maryland average — the community may draw a more diverse resident mix relative to other facilities in Maryland. |
39% African American Residents — State Benchmarked 39% of residents are reported as African American or Black, compared to the Maryland average of 13%. A higher African American share than the typical Maryland average — useful context when comparing cultural fit and community composition. |
9% Other Ethnicity Residents — State Benchmarked 9% of residents fall into categories other than White or African American (combined), compared to the Maryland average of 6%. This column aggregates Hispanic, Asian, multiracial, and any other labeled groups that are not classified as White or African American. Reported subgroups in this total: Asian (4%), Hawaiian/Pacific Islander (3%), Hispanic (1%). |
4% Residents Age 65–74 — State Benchmarked 4% of residents are 65–74, compared to the Maryland average of 13%. Fewer younger seniors suggests the resident population skews older, likely requiring higher acuity care and more hands-on support. |
43% Residents Age 75–84 — State Benchmarked 43% of residents are 75–84, compared to the Maryland average of 31%. A high concentration in this mid-range bracket, where residents typically need moderate support with daily activities. |
37% Residents Age 85–94 — State Benchmarked 37% of residents are 85–94, compared to the Maryland average of 44%. The population here skews younger than the statewide norm, which may indicate a more active, lower-acuity community. |
14% Residents Age 95+ — State Benchmarked 14% of residents are 95 or older, compared to the Maryland average of 16%. In line with the statewide profile for the oldest resident bracket. |
| Seaton Silver Spring |
AL Assisted Living A licensed, long-term care setting for seniors or individuals with disabilities who need help with daily activities — like bathing, dressing, and medication management — but not 24-hour skilled nursing. Offers housing, meals, and around-the-clock support while aiming to maximize resident independence.
IL Independent Living Lifestyle-focused communities for older adults offering dining, activities, and transportation with minimal personal care. Best for active, independent seniors who want community without medical support.
RC Respite Care Short-term temporary care — days to weeks — to give family caregivers a break. Full care provided during the stay. Often used after hospitalization or to trial a facility before a permanent placement decision. | Silver Spring (Homecrest Road) | 55
Facility
55
MD AVG
44
Rank
#220 / 697 | Yes |
33
Facility
33
MD AVG
43
Rank
#597 / 985 | Private / Semi-Private Rooms | 36
Facility
36
MD AVG
21
Rank
#16 / 208 |
15% Male Residents — State Benchmarked 15% of residents are male, compared to the Maryland average of 31%. This facility caters to a majority female resident pool (85% female), consistent with the broader assisted living trend where women significantly outnumber men. |
85% Female Residents — State Benchmarked 85% of residents are female, compared to the Maryland average of 69%. Women comprise the large majority, consistent with national assisted living demographics where women live longer and enter care facilities at higher rates. |
79% White Residents — State Benchmarked 79% of residents are reported as White, compared to the Maryland average of 81%. Close to the average for this category among assisted living facilities in Maryland with reported race/ethnicity data. |
21% African American Residents — State Benchmarked 21% of residents are reported as African American or Black, compared to the Maryland average of 13%. A higher African American share than the typical Maryland average — useful context when comparing cultural fit and community composition. |
0% Other Ethnicity Residents — State Benchmarked 0% of residents fall into categories other than White or African American (combined), compared to the Maryland average of 6%. This column aggregates Hispanic, Asian, multiracial, and any other labeled groups that are not classified as White or African American. |
9% Residents Age 65–74 — State Benchmarked 9% of residents are 65–74, compared to the Maryland average of 13%. Fewer younger seniors suggests the resident population skews older, likely requiring higher acuity care and more hands-on support. |
21% Residents Age 75–84 — State Benchmarked 21% of residents are 75–84, compared to the Maryland average of 31%. Below the state norm — the resident mix may skew either younger or older than this typical middle bracket. |
38% Residents Age 85–94 — State Benchmarked 38% of residents are 85–94, compared to the Maryland average of 44%. The population here skews younger than the statewide norm, which may indicate a more active, lower-acuity community. |
32% Residents Age 95+ — State Benchmarked 32% of residents are 95 or older, compared to the Maryland average of 16%. A high proportion of the oldest-old suggests strong end-of-life care experience and very-high-acuity capabilities. |
| Apple Blossoms Assisted Living |
AL Assisted Living A licensed, long-term care setting for seniors or individuals with disabilities who need help with daily activities — like bathing, dressing, and medication management — but not 24-hour skilled nursing. Offers housing, meals, and around-the-clock support while aiming to maximize resident independence. | Silver Spring | 5
Facility
5
MD AVG
44
Rank
#436 / 697 | No |
6
Facility
6
MD AVG
43
Rank
#891 / 985 | Private / Semi-Private Rooms | - | - | - | - | - | - | - | - | - | - |
More homes from the same operator
Operated by
Apple Blossoms
Frequently Asked Questions about Apple Blossoms Assisted Living
Is Apple Blossoms Assisted Living in a walkable area?
Apple Blossoms Assisted Living has a walk score of 6. Car-dependent. Most errands require a car, with limited nearby walkable options.
How many beds does Apple Blossoms Assisted Living have?
Apple Blossoms Assisted Living has 5 beds.
Are there photos of Apple Blossoms Assisted Living?
Yes — there are 25 photos of Apple Blossoms Assisted Living in the photo gallery on this page.
What is the address of Apple Blossoms Assisted Living?
Apple Blossoms Assisted Living is located at 1013 Cresthaven Dr, Silver Spring, MD 20903.
What is the phone number of Apple Blossoms Assisted Living?
(301) 445-5837 will put you in contact with the team at Apple Blossoms Assisted Living.
What county is Apple Blossoms Assisted Living located in?
Apple Blossoms Assisted Living is in Prince George's County.
Is Apple Blossoms Assisted Living Medicare or Medicaid certified?
Apple Blossoms Assisted Living is not currently listed as a CMS-certified provider of Medicare or Medicaid.
Guides for Better Senior Living
Care Cost Calculator: See Prices in Your Area
Nursing Home Data Explorer
Don’t Wait Too Long: 7 Red Flag Signs Your Parent Needs Assisted Living Now
The True Cost of Assisted Living in 2025 – And How Families Are Paying For It
Understanding Senior Living Costs: Pricing Models, Discounts & Financial Assistance
Contact Us

Published on
Updated on
Feedback
Write a review for Apple Blossoms Assisted Living
Rate your overall experience with this community
Explore Open Rooms
1
Contact details
2
What type of senior care service are you looking for?
3
What budget do you have in mind for senior care?
4
How soon do you need to find care?
5
Additional details
Thank you for your interest!
Our team will be in touch shortly to help with next steps.
Need Help?
Let us help you or a loved one find the perfect senior home.
