


Occupancy rate
100%
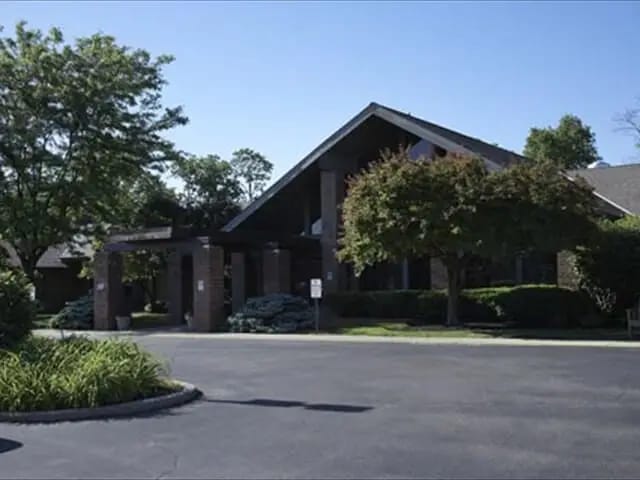
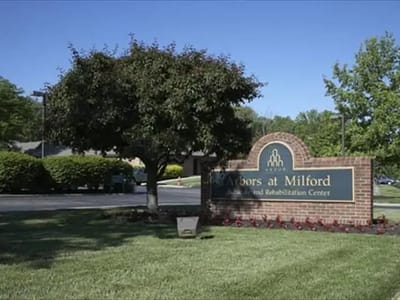
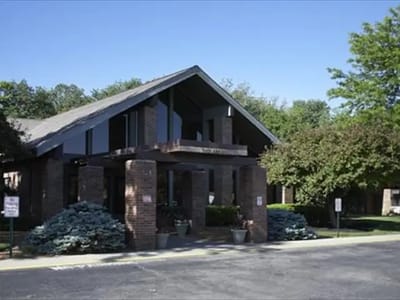

Focused on post-acute rehabilitation and short-term care recovery, Arbors at Milford is a 30-bed SNF in Milford, Ohio. Found on Meadowcreek Drive in a moderately walkable neighborhood, it serves patients transitioning from hospitals and those needing intensive rehabilitation services. Accepted are Medicare, Medicaid, and private pay, providing multiple pathways for families to fund care.
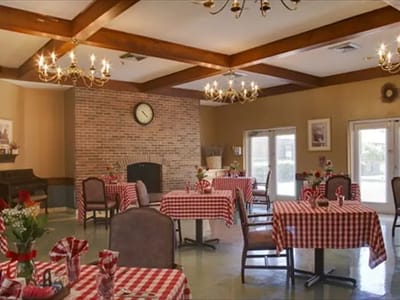
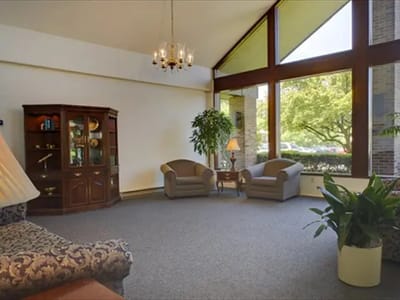
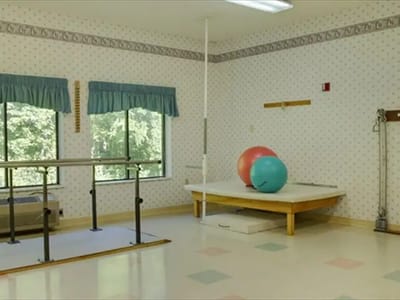
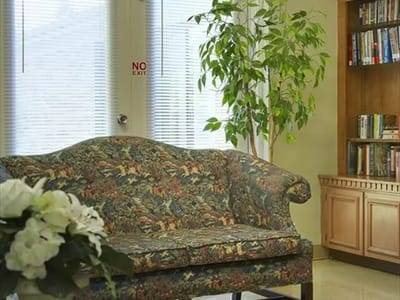
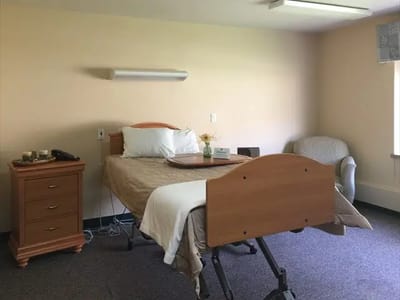
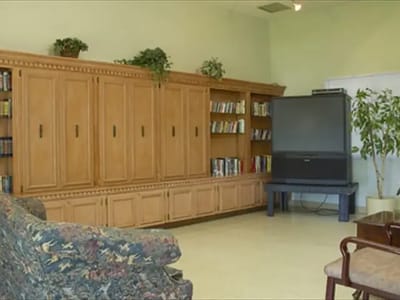
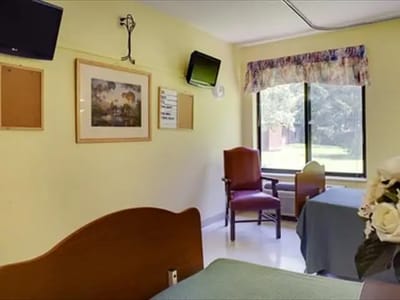
The community specializes in rehabilitation-focused care that emphasizes complex medical needs. Its programs span pulmonary care, wound care therapies, infusion services, and specialized programs for cancer recovery and ventilator-dependent patients. The team supports palliative care and transitional care, meaning families can find curative rehabilitation and comfort-focused options under one roof. Averaging a stay duration of 80 days, the community balances short-term post-hospital recovery with patients requiring longer rehabilitation periods. Daily nursing support averages 3 hours 46 minutes per resident, with registered nurses, nursing aides, and licensed practical nurses managing medications, wound care, and medical monitoring. The 900-square-foot rehabilitation and therapy center houses advanced equipment, anchored by an on-site medical director, podiatrist, and dentist, decreasing the need for outside appointments during recovery. Beyond clinical care, the community provides amenities that support recovery and family visits. Occupants enjoy fine dining with gourmet menus, private and semi-private rooms with cable TV and phones, and access to on-site salon and spa services. The property features a manicured garden and outdoor courtyard for residents who can spend time outside, pet therapy for people who benefit from animal companionship, and a cozy family lounge for visiting relatives. Wi-Fi exists community-wide, and on-site religious services are offered.
| Staff type | Hours / Day / Resident | vs state avg |
|---|---|---|
|
Registered Nurse (RN)
| 39m per day | ▲ 4% State avg: 38m per day · National avg: 41m per day |
|
LPN / LVN
| 52m per day | ▼ 10% State avg: 58m per day · National avg: 52m per day |
|
Nurse Aide
| 2h 54m per day | ▲ 36% State avg: 2h 8m per day · National avg: 2h 20m per day |
|
Weekend Total Nursing
| 3h 48m per day | ▲ 16% State avg: 3h 17m per day · National avg: 3h 26m per day |
|
Physical Therapist
| 2m per day | ▼ 45% State avg: 3m per day · National avg: 4m per day |
|
Weekend RN
| 17m per day | ▼ 30% State avg: 25m per day · National avg: 28m per day |
In Ohio, the Department of Health, Bureau of Survey and Certification conducts unannounced onsite inspections to evaluate the quality of care and environment in all licensed facilities.
Citations
| This Facility | OH Average | vs. OH Avg |
|---|---|---|---|
|
Total citations
| 3 | 2 | This facility has 50% more total citations than a typical Ohio nursing home (3 vs. OH avg 2).↑ 50% worse |
State average 6.7
Last Health inspection on Apr 2025
State average 30.9
State average 4.59
Health citations are formal notices following inspections when they fail to comply with safety and care standards.
40 of 56 citations resulted from standard inspections; 13 of 56 resulted from complaint investigations; and 3 of 56 came from combined inspections (standard and complaint).
State average: 0.3
State average: 0.9
Reporting period: October 1 – December 31, 2025 (Q4 2025). Source: CMS Payroll-Based Journal report.
Manages medical care and health needs.
Assists with medical care and medications.
Helps with daily care and mobility.
Total hours from contractors
2,653 contractor hours this quarter
| Certified Nursing Assistant | 58 | 0 | 58 | 17,837 | 92 | 100% | 9.1 |
| Licensed Practical Nurse | 15 | 0 | 15 | 4,472 | 92 | 100% | 9.4 |
| Registered Nurse | 14 | 1 | 15 | 2,658 | 92 | 100% | 9.7 |
| Qualified Activities Professional | 6 | 0 | 6 | 2,410 | 92 | 100% | 10 |
| Clinical Nurse Specialist | 19 | 0 | 19 | 1,418 | 62 | 67% | 8.6 |
| RN Director of Nursing | 3 | 0 | 3 | 1,163 | 63 | 68% | 8.7 |
| Physical Therapy Aide | 0 | 3 | 3 | 794 | 72 | 78% | 7.2 |
| Other Dietary Services Staff | 2 | 0 | 2 | 612 | 87 | 95% | 5.8 |
| Medication Aide/Technician | 1 | 0 | 1 | 516 | 54 | 59% | 9.5 |
| Mental Health Service Worker | 1 | 0 | 1 | 496 | 62 | 67% | 8 |
| Administrator | 1 | 0 | 1 | 488 | 61 | 66% | 8 |
| Dietitian | 1 | 0 | 1 | 476 | 61 | 66% | 7.8 |
| Dental Services Staff | 1 | 0 | 1 | 426 | 56 | 61% | 7.6 |
| Speech Language Pathologist | 0 | 3 | 3 | 356 | 73 | 79% | 3.8 |
| Occupational Therapy Aide | 0 | 1 | 1 | 335 | 41 | 45% | 8.2 |
| Nurse Aide in Training | 1 | 0 | 1 | 311 | 27 | 29% | 11.5 |
| Physical Therapy Assistant | 0 | 3 | 3 | 292 | 62 | 67% | 4.2 |
| Qualified Social Worker | 0 | 4 | 4 | 190 | 51 | 55% | 3.7 |
| Respiratory Therapy Technician | 0 | 7 | 7 | 177 | 62 | 67% | 1.9 |
| Medical Director | 1 | 1 | 2 | 174 | 22 | 24% | 7.3 |
| Nurse Practitioner | 1 | 0 | 1 | 160 | 16 | 17% | 10 |
| Occupational Therapy Assistant | 0 | 3 | 3 | 60 | 21 | 23% | 2.6 |
Includes penalties issued in 2024-2025
Federal penalties imposed by CMS for regulatory violations, including civil money penalties (fines) and denials of payment for new Medicare/Medicaid admissions.
Source: CMS Penalties Database (Data as of Jan 2026)
Ohio average: $69K
Ohio average: 1.9
Ohio average: 0.5
Penalties are imposed by CMS for violations of federal nursing home regulations.
5 penalties in the past 3 years
Multiple penalties were reported in the last 3 years.
Last updated: Jan 2026
These measures show how residents usually do over time at this home, based on health outcomes and preventive care.
Ohio average: 5.8
Ohio average: 12.7
Ohio average: 6.8%
Ohio average: 8.9%
Ohio average: 22.0%
Ohio average: 3.4%
Ohio average: 3.9%
Ohio average: 0.5%
Ohio average: 6.2%
Ohio average: 24.0%
Ohio average: 8.4%
Ohio average: 92.4%
Ohio average: 94.5%
Ohio average: 78.0%
Ohio average: 1.3%
Ohio average: 75.6%
Ohio average: 25.1%
Ohio average: 12.5%
Ohio average: 0.8%
Ohio average: 50.6%
Quality measures are calculated from Minimum Data Set (MDS) assessments. For most measures, lower percentages indicate better care quality.
15% of new residents, usually for short-term rehab.
79% of new residents, often for short stays.
6% of new residents, often for long-term daily care.
Source: CMS Long-Term Care Facility Characteristics (Data as of Jan 2026)
Residents meet regularly to discuss policies, care quality, and activities
Organized group of residents that meets regularly to discuss facility policies, quality of life, and activities.
Data sourced from CMS Long-Term Care Facility Characteristics quarterly report. Payer mix reflects the current resident census by primary payment source.
Historical financial and operational data for Arbors at Milford from 2011–2023, based on CMS SNF Cost Reports.
Key figures below are for fiscal year ending in 12/2023.
Based on CMS SNF Cost Report for fiscal year ending in 12/2023.
Residents typically stay for brief periods, with frequent admissions and discharges throughout the year.
Most new residents arrive under private pay (79% of admissions), and a typical private pay stay runs around 2 - 3 months.
Coverage residents most often arrive under.
Coverage residents most often leave under.
![]() 0.0 miles from city center
0.0 miles from city center
![]() Estimated distance in miles from Milford's city center to Arbors at Milford's address, calculated via Google Maps.
Estimated distance in miles from Milford's city center to Arbors at Milford's address, calculated via Google Maps.
Add your location
Info below is compiled from CMS reports & the OH Dept. of Health, senior community websites & trusted data sources such as Walk Score & BBB.
Communities are listed from highest to lowest based on our ranking methodology.
| Brookdale Westlake Village | NH AL IL MC SNF | Westlake | 60
Facility
60
OH AVG
75
Rank
#177 / 309 |
96.7%
Facility
96.7%
OH AVG
81.7
Rank
#4 / 138 | +18% | 4.38
Facility
4.38
OH AVG
3.54
Rank
#21 / 182 | +18% | +24% | $0
Facility
$0
OH AVG
$74.0k
Rank
#1 / 183 | 5
Facility
5
OH AVG
30.9
Rank
#9 / 183 | 1.3
Facility
1.3
OH AVG
4.6
Rank
#2 / 183 | - | 58 | A+ |
25
Facility
25
OH AVG
40
Rank
#500 / 704 | Labeed Diab | $20.1MFiscal year ending 12/2023
Facility
$20.1MFiscal year ending 12/2023
OH AVG
$10.1M
Rank
#66 / 183 | $10.2MFiscal year ending 12/2023
Facility
$10.2MFiscal year ending 12/2023
OH AVG
$3.9M
Rank
#11 / 183 | 50.8%Fiscal year ending 12/2023
Facility
50.8%Fiscal year ending 12/2023
OH AVG
40.2%
Rank
#5 / 183 | 366373 | ||||
| Alois Alzheimer Center | NH HOS MC PC RC SNF | Cincinnati (Greenhills) | 93
Facility
93
OH AVG
75
Rank
#92 / 309 |
82.8%
Facility
82.8%
OH AVG
81.7
Rank
#86 / 138 | +1% | 4.12
Facility
4.12
OH AVG
3.54
Rank
#36 / 182 | -31% | +16% | $0
Facility
$0
OH AVG
$74.0k
Rank
#1 / 183 | 7
Facility
7
OH AVG
30.9
Rank
#14 / 183 | 3.5
Facility
3.5
OH AVG
4.6
Rank
#58 / 183 | - | 77 | - |
49
Facility
49
OH AVG
40
Rank
#263 / 704 | Boymel Operations Holdings Co LLC | $7.5MFiscal year ending 12/2023
Facility
$7.5MFiscal year ending 12/2023
OH AVG
$10.1M
Rank
#136 / 183 | $4.6MFiscal year ending 12/2023
Facility
$4.6MFiscal year ending 12/2023
OH AVG
$3.9M
Rank
#111 / 183 | 61.4%Fiscal year ending 12/2023
Facility
61.4%Fiscal year ending 12/2023
OH AVG
40.2%
Rank
#21 / 183 | 366489 | ||||
| O’Neill Healthcare North Ridgeville | NH AL HOS IL MC PC SNF | North Ridgeville | 150
Facility
150
OH AVG
75
Rank
#12 / 309 |
85.3%
Facility
85.3%
OH AVG
81.7
Rank
#76 / 138 | +4% | 3.30
Facility
3.30
OH AVG
3.54
Rank
#112 / 182 | -18% | -7% | $0
Facility
$0
OH AVG
$74.0k
Rank
#1 / 183 | 10
Facility
10
OH AVG
30.9
Rank
#23 / 183 | 2.5
Facility
2.5
OH AVG
4.6
Rank
#23 / 183 | - | 128 | A+ |
29
Facility
29
OH AVG
40
Rank
#455 / 704 | Trisha Brown | $16.5MFiscal year ending 12/2023
Facility
$16.5MFiscal year ending 12/2023
OH AVG
$10.1M
Rank
#14 / 183 | $8.1MFiscal year ending 12/2023
Facility
$8.1MFiscal year ending 12/2023
OH AVG
$3.9M
Rank
#19 / 183 | 49%Fiscal year ending 12/2023
Facility
49%Fiscal year ending 12/2023
OH AVG
40.2%
Rank
#121 / 183 | 365685 | ||||
| Twin Towers | NH AL IL MC SNF | Cincinnati (College Hill) | 231
Facility
231
OH AVG
75
Rank
#1 / 309 |
31.2%
Facility
31.2%
OH AVG
81.7
Rank
#138 / 138 | -62% | 5.44
Facility
5.44
OH AVG
3.54
Rank
#8 / 182 | -14% | +54% | $0
Facility
$0
OH AVG
$74.0k
Rank
#1 / 183 | 13
Facility
13
OH AVG
30.9
Rank
#35 / 183 | 4.3
Facility
4.3
OH AVG
4.6
Rank
#99 / 183 | - | 72 | - |
31
Facility
31
OH AVG
40
Rank
#432 / 704 | Douglas Burgess | $10.7MFiscal year ending 12/2023
Facility
$10.7MFiscal year ending 12/2023
OH AVG
$10.1M
Rank
#38 / 183 | $5.8MFiscal year ending 12/2023
Facility
$5.8MFiscal year ending 12/2023
OH AVG
$3.9M
Rank
#63 / 183 | 54.5%Fiscal year ending 12/2023
Facility
54.5%Fiscal year ending 12/2023
OH AVG
40.2%
Rank
#163 / 183 | 366023 | ||||
| Arbors at Milford | NH PC RC SNF | Milford | 30
Facility
30
OH AVG
75
Rank
#277 / 309 | - | - | 3.77
Facility
3.77
OH AVG
3.54
Rank
#51 / 182 | +7% | +6% | $117.8k
Facility
$117.8k
OH AVG
$74.0k
Rank
#170 / 183 | 56
Facility
56
OH AVG
30.9
Rank
#163 / 183 | 8.0
Facility
8.0
OH AVG
4.6
Rank
#176 / 183 | 8 | 72 | A+ |
67
Facility
67
OH AVG
40
Rank
#84 / 704 | - | $9.1MFiscal year ending 12/2023
Facility
$9.1MFiscal year ending 12/2023
OH AVG
$10.1M
Rank
#87 / 183 | $4.9MFiscal year ending 12/2023
Facility
$4.9MFiscal year ending 12/2023
OH AVG
$3.9M
Rank
#93 / 183 | 53.3%Fiscal year ending 12/2023
Facility
53.3%Fiscal year ending 12/2023
OH AVG
40.2%
Rank
#115 / 183 | 365675 |
Arbors at Milford has a walk score of 67. Moderately walkable. Some errands can be accomplished on foot, with a mix of nearby amenities.
Arbors at Milford's occupancy is 100%.
No, Arbors at Milford has a no-pet policy.
The team at Arbors at Milford can be reached at CKISER@ARBORSATMILFORD.COM.
Arbors at Milford is registered as a for-profit in OH.
Arbors at Milford has 30 beds.
Arbors at Milford has had 3 reported citations since 2019 according to records from Ohio Department of Aging (ODA).
Care Cost Calculator: See Prices in Your Area
Nursing Home Data Explorer
Don’t Wait Too Long: 7 Red Flag Signs Your Parent Needs Assisted Living Now
The True Cost of Assisted Living in 2025 – And How Families Are Paying For It
Understanding Senior Living Costs: Pricing Models, Discounts & Financial Assistance


