Arcadia of Crofton II
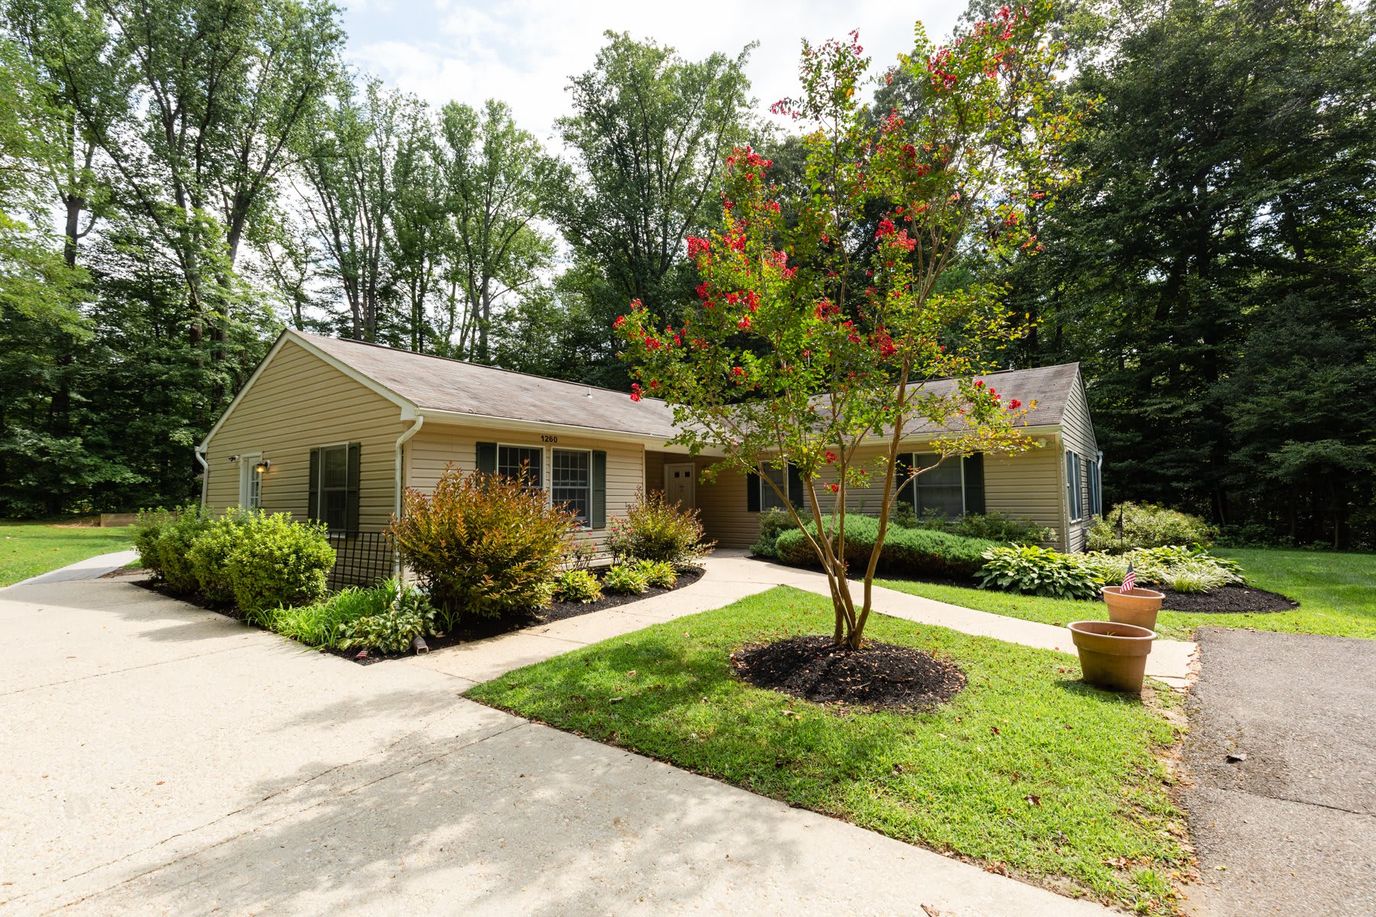
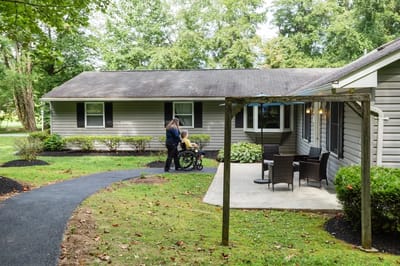
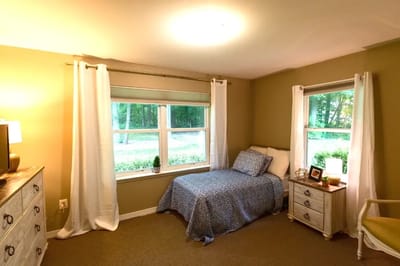
Located within the picturesque landscape of Gambrills, Maryland, Arcadia of Crofton II emerges as a gem, boasting 16 private rooms enveloped by lush surroundings. Formerly known as Autumn Meadows, this charming senior residence offers an inviting atmosphere that captures the essence of worry-free assisted senior living. With a spacious dining area and numerous spaces dedicated to diverse activities, Arcadia of Crofton II is designed to cater to every facet of assisted living homes.
This community also provides round-the-clock care and vigilant supervision, ensuring peace of mind for residents and their families in the realm of assisted senior living. Beyond the cozy confines of their private rooms, seniors can relish in the comfort of three delectable home-cooked meals, perfectly complemented by an emergency call bell system and the convenience of Wi-Fi and cable services. The thoughtful inclusion of a backup electric generator, along with the assistance of housekeeping and laundry services, fosters an environment where residents can truly embrace the joys of assisted living.
About this community
Hospice Affiliations
Staffing
Key information about the people who lead and staff this community.
Demographics
Resident demographic information for this facility.
Gender
- Female 64.3%
- Male 35.7%
Age Distribution
- 75-84 35.7%
- 85-94 28.6%
- 95+ 28.6%
- 65-74 7.1%
Ethnicity
- White 100%
Places of interest near Arcadia of Crofton II
8.0 miles from city center
Estimated distance in miles from Gambrills's city center to Arcadia of Crofton II's address, calculated via Google Maps.
— 6.9 miles to nearest hospital (Luminis Health Anne Arundel Medical Center)
Calculate Travel Distance to Arcadia of Crofton II
Add your location
Financial Assistance for
Assisted Living in Maryland
Arcadia of Crofton II is located in Gambrills, Maryland.
Here are the financial assistance programs available to residents in Maryland.
Compare Assisted Living around Bowie
The information below is reported by the Maryland Department of Health, Office of Health Care Quality.
|
|
|
|
|
|
|
|
|
|
|
|
|
|
|
|
|
|
|
|---|---|---|---|---|---|---|---|---|---|---|---|---|---|---|---|---|---|
| Tribute at Melford |
AL
Assisted Living A licensed, long-term care setting for seniors or individuals with disabilities who need help with daily activities — like bathing, dressing, and medication management — but not 24-hour skilled nursing. Offers housing, meals, and around-the-clock support while aiming to maximize resident independence.
MC
Memory Care Secured, specialized care for people living with Alzheimer's or dementia. Staff trained in cognitive impairment, with higher staff-to-resident ratios and an environment designed to reduce confusion and wandering risk. |
Bowie (Melford Boulevard) |
140
Facility
140
MD AVG
43
Rank
#52 / 697
| Yes |
17
Facility
17
MD AVG
43
Rank
#766 / 985
| Studio / 1 Bed |
5
Facility
5
MD AVG
21
Rank
#182 / 208
| - |
32%
Male Residents — State Benchmarked 32% of residents are male, compared to the Maryland average of 31%. This facility caters to a majority female resident pool (68% female), consistent with the broader assisted living trend where women significantly outnumber men. |
68%
Female Residents — State Benchmarked 68% of residents are female, compared to the Maryland average of 69%. Women comprise the large majority, consistent with national assisted living demographics where women live longer and enter care facilities at higher rates. |
24%
White Residents — State Benchmarked 24% of residents are reported as White, compared to the Maryland average of 81%. A lower White share than the Maryland average — the community may draw a more diverse resident mix relative to other facilities in Maryland. |
58%
African American Residents — State Benchmarked 58% of residents are reported as African American or Black, compared to the Maryland average of 13%. A higher African American share than the typical Maryland average — useful context when comparing cultural fit and community composition. |
18%
Other Ethnicity Residents — State Benchmarked 18% of residents fall into categories other than White or African American (combined), compared to the Maryland average of 6%. This column aggregates Hispanic, Asian, multiracial, and any other labeled groups that are not classified as White or African American. Reported subgroups in this total: Mixed Race (10%), Asian (4%), Hispanic (4%). |
16%
Residents Age 65–74 — State Benchmarked 16% of residents are 65–74, compared to the Maryland average of 13%. In line with the statewide profile for this youngest senior bracket in assisted living. |
26%
Residents Age 75–84 — State Benchmarked 26% of residents are 75–84, compared to the Maryland average of 31%. Below the state norm — the resident mix may skew either younger or older than this typical middle bracket. |
36%
Residents Age 85–94 — State Benchmarked 36% of residents are 85–94, compared to the Maryland average of 44%. The population here skews younger than the statewide norm, which may indicate a more active, lower-acuity community. |
18%
Residents Age 95+ — State Benchmarked 18% of residents are 95 or older, compared to the Maryland average of 16%. In line with the statewide profile for the oldest resident bracket. |
| Brookdale Woodward Estates |
AL
Assisted Living A licensed, long-term care setting for seniors or individuals with disabilities who need help with daily activities — like bathing, dressing, and medication management — but not 24-hour skilled nursing. Offers housing, meals, and around-the-clock support while aiming to maximize resident independence. |
Bowie (Bowie Town Center) |
100
Facility
100
MD AVG
43
Rank
#117 / 697
| No |
27
Facility
27
MD AVG
43
Rank
#668 / 985
| - |
27
Facility
27
MD AVG
21
Rank
#61 / 208
| - |
31%
Male Residents — State Benchmarked 31% of residents are male, compared to the Maryland average of 31%. This facility caters to a majority female resident pool (69% female), consistent with the broader assisted living trend where women significantly outnumber men. |
69%
Female Residents — State Benchmarked 69% of residents are female, compared to the Maryland average of 69%. Women comprise the large majority, consistent with national assisted living demographics where women live longer and enter care facilities at higher rates. |
29%
White Residents — State Benchmarked 29% of residents are reported as White, compared to the Maryland average of 81%. A lower White share than the Maryland average — the community may draw a more diverse resident mix relative to other facilities in Maryland. |
69%
African American Residents — State Benchmarked 69% of residents are reported as African American or Black, compared to the Maryland average of 13%. A higher African American share than the typical Maryland average — useful context when comparing cultural fit and community composition. |
2%
Other Ethnicity Residents — State Benchmarked 2% of residents fall into categories other than White or African American (combined), compared to the Maryland average of 6%. This column aggregates Hispanic, Asian, multiracial, and any other labeled groups that are not classified as White or African American. Reported subgroups in this total: Asian (2%). |
10%
Residents Age 65–74 — State Benchmarked 10% of residents are 65–74, compared to the Maryland average of 13%. Fewer younger seniors suggests the resident population skews older, likely requiring higher acuity care and more hands-on support. |
49%
Residents Age 75–84 — State Benchmarked 49% of residents are 75–84, compared to the Maryland average of 31%. A high concentration in this mid-range bracket, where residents typically need moderate support with daily activities. |
33%
Residents Age 85–94 — State Benchmarked 33% of residents are 85–94, compared to the Maryland average of 44%. The population here skews younger than the statewide norm, which may indicate a more active, lower-acuity community. |
6%
Residents Age 95+ — State Benchmarked 6% of residents are 95 or older, compared to the Maryland average of 16%. Most residents here have not yet reached the oldest-old bracket, suggesting a younger overall community. |
| Arbor Terrace at Waugh Chapel |
AL
Assisted Living A licensed, long-term care setting for seniors or individuals with disabilities who need help with daily activities — like bathing, dressing, and medication management — but not 24-hour skilled nursing. Offers housing, meals, and around-the-clock support while aiming to maximize resident independence.
MC
Memory Care Secured, specialized care for people living with Alzheimer's or dementia. Staff trained in cognitive impairment, with higher staff-to-resident ratios and an environment designed to reduce confusion and wandering risk. |
Gambrills (Waugh Chapel Towne Centre) |
96
Facility
96
MD AVG
43
Rank
#140 / 697
| No |
47
Facility
47
MD AVG
43
Rank
#459 / 985
| - |
4
Facility
4
MD AVG
21
Rank
#191 / 208
| A+ |
30%
Male Residents — State Benchmarked 30% of residents are male, compared to the Maryland average of 31%. This facility caters to a majority female resident pool (70% female), consistent with the broader assisted living trend where women significantly outnumber men. |
70%
Female Residents — State Benchmarked 70% of residents are female, compared to the Maryland average of 69%. Women comprise the large majority, consistent with national assisted living demographics where women live longer and enter care facilities at higher rates. |
86%
White Residents — State Benchmarked 86% of residents are reported as White, compared to the Maryland average of 81%. Close to the average for this category among assisted living facilities in Maryland with reported race/ethnicity data. |
12%
African American Residents — State Benchmarked 12% of residents are reported as African American or Black, compared to the Maryland average of 13%. In line with the Maryland average for African American residents among facilities reporting this breakdown. |
3%
Other Ethnicity Residents — State Benchmarked 3% of residents fall into categories other than White or African American (combined), compared to the Maryland average of 6%. This column aggregates Hispanic, Asian, multiracial, and any other labeled groups that are not classified as White or African American. Reported subgroups in this total: Asian (1%), Hawaiian/Pacific Islander (1%). |
10%
Residents Age 65–74 — State Benchmarked 10% of residents are 65–74, compared to the Maryland average of 13%. Fewer younger seniors suggests the resident population skews older, likely requiring higher acuity care and more hands-on support. |
43%
Residents Age 75–84 — State Benchmarked 43% of residents are 75–84, compared to the Maryland average of 31%. A high concentration in this mid-range bracket, where residents typically need moderate support with daily activities. |
39%
Residents Age 85–94 — State Benchmarked 39% of residents are 85–94, compared to the Maryland average of 44%. This is typically the most common age bracket in assisted living — this facility is in line with the statewide norm. |
8%
Residents Age 95+ — State Benchmarked 8% of residents are 95 or older, compared to the Maryland average of 16%. Most residents here have not yet reached the oldest-old bracket, suggesting a younger overall community. |
| Charter Senior Living of Bowie |
AL
Assisted Living A licensed, long-term care setting for seniors or individuals with disabilities who need help with daily activities — like bathing, dressing, and medication management — but not 24-hour skilled nursing. Offers housing, meals, and around-the-clock support while aiming to maximize resident independence.
MC
Memory Care Secured, specialized care for people living with Alzheimer's or dementia. Staff trained in cognitive impairment, with higher staff-to-resident ratios and an environment designed to reduce confusion and wandering risk. |
Bowie (Laurel Bowie Road) |
52
Facility
52
MD AVG
43
Rank
#221 / 697
| No |
30
Facility
30
MD AVG
43
Rank
#627 / 985
| - |
26
Facility
26
MD AVG
21
Rank
#77 / 208
| - |
21%
Male Residents — State Benchmarked 21% of residents are male, compared to the Maryland average of 31%. This facility caters to a majority female resident pool (79% female), consistent with the broader assisted living trend where women significantly outnumber men. |
79%
Female Residents — State Benchmarked 79% of residents are female, compared to the Maryland average of 69%. Women comprise the large majority, consistent with national assisted living demographics where women live longer and enter care facilities at higher rates. |
52%
White Residents — State Benchmarked 52% of residents are reported as White, compared to the Maryland average of 81%. A lower White share than the Maryland average — the community may draw a more diverse resident mix relative to other facilities in Maryland. |
46%
African American Residents — State Benchmarked 46% of residents are reported as African American or Black, compared to the Maryland average of 13%. A higher African American share than the typical Maryland average — useful context when comparing cultural fit and community composition. |
2%
Other Ethnicity Residents — State Benchmarked 2% of residents fall into categories other than White or African American (combined), compared to the Maryland average of 6%. This column aggregates Hispanic, Asian, multiracial, and any other labeled groups that are not classified as White or African American. Reported subgroups in this total: American Indian (2%). |
- | - |
83%
Residents Age 85–94 — State Benchmarked 83% of residents are 85–94, compared to the Maryland average of 44%. A high concentration of very elderly residents signals a higher-acuity facility with experience caring for advanced age-related needs. |
17%
Residents Age 95+ — State Benchmarked 17% of residents are 95 or older, compared to the Maryland average of 16%. In line with the statewide profile for the oldest resident bracket. |
| Arcadia of Crofton II |
AL
Assisted Living A licensed, long-term care setting for seniors or individuals with disabilities who need help with daily activities — like bathing, dressing, and medication management — but not 24-hour skilled nursing. Offers housing, meals, and around-the-clock support while aiming to maximize resident independence.
MC
Memory Care Secured, specialized care for people living with Alzheimer's or dementia. Staff trained in cognitive impairment, with higher staff-to-resident ratios and an environment designed to reduce confusion and wandering risk. |
Gambrills |
16
Facility
16
MD AVG
43
Rank
#260 / 697
| No |
21
Facility
21
MD AVG
43
Rank
#731 / 985
| - |
4
Facility
4
MD AVG
21
Rank
#191 / 208
| - |
36%
Male Residents — State Benchmarked 36% of residents are male, compared to the Maryland average of 31%. This facility caters to a majority female resident pool (64% female), consistent with the broader assisted living trend where women significantly outnumber men. |
64%
Female Residents — State Benchmarked 64% of residents are female, compared to the Maryland average of 69%. Closer to an even gender split than most assisted living facilities, which typically have 65–75% female residents. |
100%
White Residents — State Benchmarked 100% of residents are reported as White, compared to the Maryland average of 81%. A higher White share than is typical for assisted living in Maryland in this dataset — compare with peer facilities for local context. |
0%
African American Residents — State Benchmarked 0% of residents are reported as African American or Black, compared to the Maryland average of 13%. A lower African American share than is typical in Maryland; local markets still vary widely. |
0%
Other Ethnicity Residents — State Benchmarked 0% of residents fall into categories other than White or African American (combined), compared to the Maryland average of 6%. This column aggregates Hispanic, Asian, multiracial, and any other labeled groups that are not classified as White or African American. |
7%
Residents Age 65–74 — State Benchmarked 7% of residents are 65–74, compared to the Maryland average of 13%. Fewer younger seniors suggests the resident population skews older, likely requiring higher acuity care and more hands-on support. |
36%
Residents Age 75–84 — State Benchmarked 36% of residents are 75–84, compared to the Maryland average of 31%. This is the second most common age bracket in assisted living, representing residents with moderate care needs. |
29%
Residents Age 85–94 — State Benchmarked 29% of residents are 85–94, compared to the Maryland average of 44%. The population here skews younger than the statewide norm, which may indicate a more active, lower-acuity community. |
29%
Residents Age 95+ — State Benchmarked 29% of residents are 95 or older, compared to the Maryland average of 16%. A high proportion of the oldest-old suggests strong end-of-life care experience and very-high-acuity capabilities. |
Frequently Asked Questions about Arcadia of Crofton II
What neighborhood is Arcadia of Crofton II in?
Arcadia of Crofton II is in the Gambrills neighborhood of Gambrills.
Is Arcadia of Crofton II in a walkable area?
Arcadia of Crofton II has a walk score of 21. Car-dependent. Most errands require a car, with limited nearby walkable options.
How many beds does Arcadia of Crofton II have?
Arcadia of Crofton II has 16 beds.
Are there photos of Arcadia of Crofton II?
Yes — there are 5 photos of Arcadia of Crofton II in the photo gallery on this page.
What is the phone number of Arcadia of Crofton II?
(410) 643-4344 will put you in contact with the team at Arcadia of Crofton II.
What county is Arcadia of Crofton II located in?
Arcadia of Crofton II is in Anne Arundel County.
Is Arcadia of Crofton II Medicare or Medicaid certified?
Arcadia of Crofton II is not currently listed as a CMS-certified provider of Medicare or Medicaid.
Guides for Better Senior Living
Care Cost Calculator: See Prices in Your Area
Nursing Home Data Explorer
Don’t Wait Too Long: 7 Red Flag Signs Your Parent Needs Assisted Living Now
The True Cost of Assisted Living in 2025 – And How Families Are Paying For It
Understanding Senior Living Costs: Pricing Models, Discounts & Financial Assistance
Contact Us
Write a review for Arcadia of Crofton II
Rate your overall experience with this community
Thank you for your interest!
Our team will be in touch shortly to help with next steps.
Need Help?
Let us help you or a loved one find the perfect senior home.