Explore Open Rooms
1 Contact details
2 What type of senior care service are you looking for?
3 What budget do you have in mind for senior care?
4 How soon do you need to find care?
5 Additional details

Thank you for your interest!

Our team will be in touch shortly to help with next steps.

Nursing Home in New York City

CMS overall rating Info The Overall CMS Rating combines results from health inspections, staffing levels and quality measures. Health inspections carry the most weight. Staffing and quality scores can increase or decrease the final rating based on performance compared to state and national standards.

ArchCare at Mary Manning Walsh Nursing Home & Rehabilitation Center

Overview of Archcare at Mary Manning Walsh Nursing Home & Rehabilitation Center

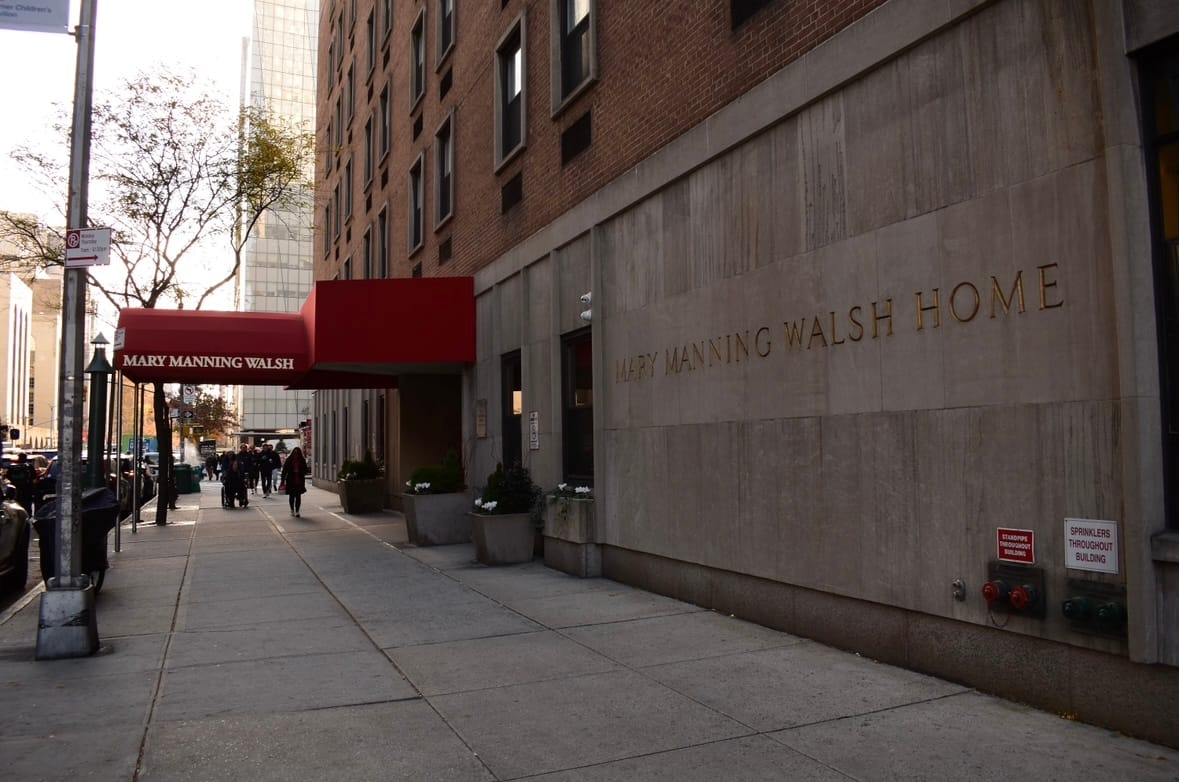
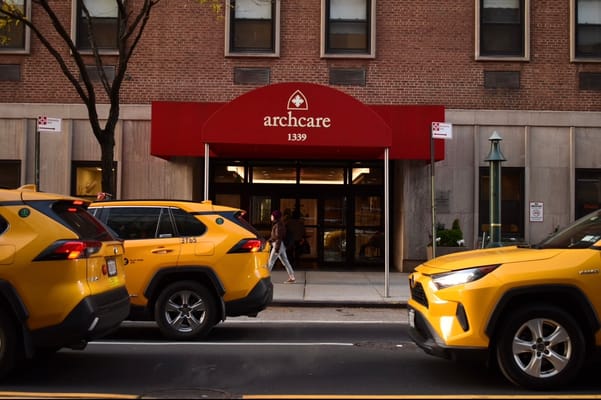
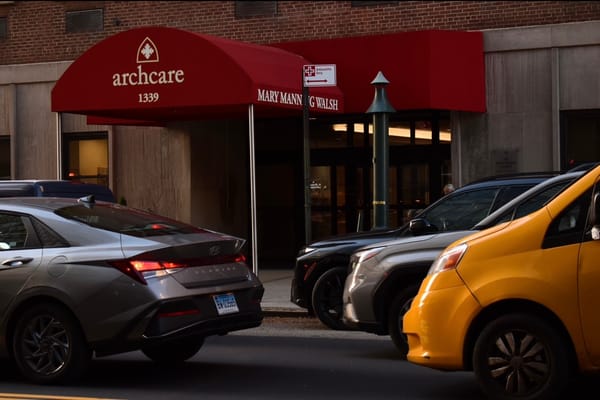
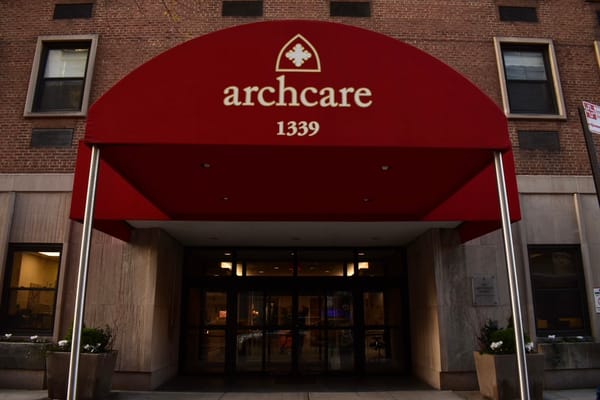
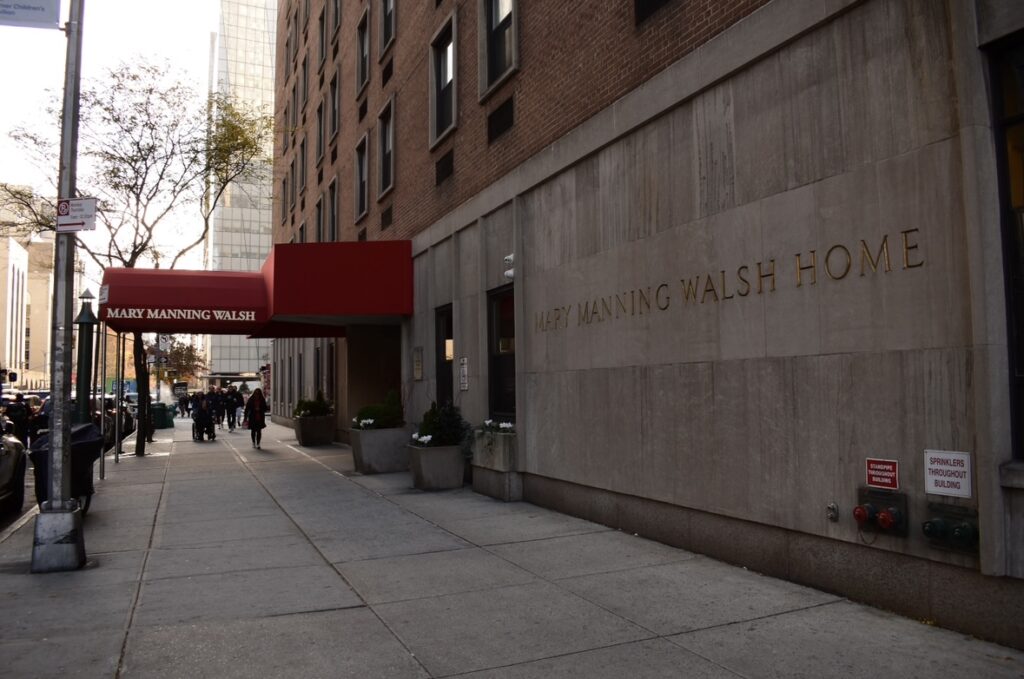
ArchCare at Mary Manning Walsh Nursing Home & Rehabilitation Center is a compassionate nursing home in New York, NY, that offers comprehensive care services. The community doubles its efforts to help older adults move into their new home without worries, with its supportive and welcoming environment. 24-hour care, a specially trained team, and maintenance services are also offered to enhance residents’ living experiences. Accompanied by its faith-based approach, the community ensures residents’ needs are met through personalized care plans.

Book clubs, yoga, and a talent show allow residents to interact with their peers and maintain an active lifestyle. A coffee shop, a beauty salon and barber shop, and an outdoor terrace are also among the community’s top-notch amenities that provide residents with more avenues to relax. The New York Presbyterian/ Weill Cornell Medical Center Emergency Department, as well as public transportation, are also easily accessible. This nursing home is one of the best options for senior living in New York, as showcased by its wide range of care options.

(212) 628-2800

Quality ratings

Measured by Centers for Medicare & Medicaid Services (CMS)

Overall rating Info The Overall CMS Rating combines results from health inspections, staffing levels and quality measures. Health inspections carry the most weight. Staffing and quality scores can increase or decrease the final rating based on performance compared to state and national standards.
5/5
New York average: 3.1/5
Health Inspection Info Based on the results of the facility's three most recent standard inspections and any complaint investigations. CMS reviews the number, scope, and severity of deficiencies, with more recent findings weighted more heavily.
4/5
New York average: 2.8/5
Staffing Info Measures average nursing staff hours per resident per day, including Registered Nurses (RNs) and total nursing staff. Ratings are adjusted based on the level of care residents require and are compared to state and national benchmarks.
3/5
New York average: 2.7/5
Quality Measures Info Based on clinical and physical health indicators reported to CMS, such as hospital readmissions, falls, pressure ulcers, and improvements in mobility. These measures reflect how well residents' health needs are being managed.
5/5
New York average: 3.8/5

Nursing care per resident

Info This shows how many total hours of nursing staff time are available per resident each day. Higher numbers usually mean more staff support.
3h 13m per day

This home provides 10% less nursing time per resident than the New York average.

New York average: 3h 35m per day

Capacity and availability

High-capacity home

May provide extensive amenities, services and programs.

Total beds 360

This home usually has limited availability

Occupancy is moderate, suggesting balanced demand.

Similar demand to the New York average
Occupancy rate 93.7%
Residents per day (avg) 340
Occupancy rate
93.7%
Residents per day (avg)
340

Who this home usually serves

TYPE OF STAY

Mostly short-term rehab stays

Most residents typically stay for a few weeks or months before returning home or moving on.

Might be optimal for
Short stays Recovery Medicare-covered care

Breakdown by payment type

Medicare

58% of new residents, usually for short-term rehab.

Typical stay 1 - 2 months

Private pay

42% of new residents, often for short stays.

Typical stay 1 - 2 months

Medicaid

1% of new residents, often for long-term daily care.

Typical stay 9 years

Finances and operations

Voluntary non-profit community
Home revenue
$136.1M
Surplus of revenue
$589.4K
Voluntary non-profit community
Home revenue
$136.1M
Surplus of revenue
$589.4K
Payroll costs Info The portion of the home's budget spent on staff, including nurses, caregivers, and other employees who support care and operations.
$23.9M
17.6% of revenue
Other operating costs Info All remaining costs needed to run the home, such as food, utilities, building maintenance, supplies and administrative expenses.
$110.4M
Total costs $134.3M
Walk Score
Walk Score: 98 / 100
Walker's paradise. Daily errands do not require a car, with many shops and services nearby.

About this community

Therapy & Rehabilitation

3 services
Rehabilitation Services
Respite Care
Short-Term Rehab

Staffing & Medical

2 services
Skilled Nursing
24-Hour Staffing

Additional Services

4 services
Nursing Homes
Home Care
Huntington’s Disease
End-Of-Life Care

Amenities & Lifestyle

14 amenities
Coffee Shop
Emerald Cocktail Lounge
Outdoor Terrace
Yoga & Exercise Programs
Art
Music & Dance
Book Clubs & Discussion Groups
Holiday Pageant & Talent Show
Wifi
Beauty Salon & Barber Shop
On-Site Personal Laundry Service
Local Dry Cleaning
Interfaith Chapel
Gift Shop
Specific ProgramsNursing Homes, Home Care, Short-term Rehab, Hospital for Special Needs, Independent Housing Program, Huntington’s Disease, Memory Care, End-of-Life Care
Operating HoursOpen 24/7

Pricing & Financial Information

What does this home offer?

Housing options icon

Housing Options: Private Rooms

Building type icon
Building type icon

Building Type: High-rise

Dining services icon

Dining Services

Beauty services icon

Beauty Services

Housekeeping icon
Housekeeping icon

Housekeeping Services

Social and recreational activities icon

Social and Recreational Activities

Exercise program icon

Exercise Programs

Types of Care at ArchCare at Mary Manning Walsh Nursing Home & Rehabilitation Center

Nursing Home

Contact ArchCare at Mary Manning Walsh Nursing Home & Rehabilitation Center

Health Inspection History

Inspections
Total health inspections 4

New York average 3.6


Last Health inspection on Nov 2023

Total health citations 14

New York average 18.5

Citations per inspection
3.5

New York average 5.05


Health citations are formal notices following inspections when they fail to comply with safety and care standards.

11 of 14 citations resulted from standard inspections; and 3 of 14 resulted from complaint investigations.

Breakdown of citation severity (last 3 years)
Critical Health citations More info 0
100% better than New York average

New York average: 0.2


Serious Health citations More info 0
100% better than New York average

New York average: 0.2

0 critical citations More info New York average: 0.2

0 serious citations More info New York average: 0.2

14 moderate citations More info New York average: 17.4

0 minor citations More info New York average: 0.7
Citations history (last 3 years)
Abuse/Neglect moderate citation Info Issues related to protecting resident's from harm, including abuse, neglect, or mistreatment. Nov 16, 2023
Corrected

Quality of Care moderate citation Info Issues related to how well residents receive appropriate treatment and support for their medical and daily care needs. Nov 16, 2023
Corrected

Quality of Care moderate citation Info Issues related to how well residents receive appropriate treatment and support for their medical and daily care needs. Apr 17, 2023
Corrected

Nutrition moderate citation Info Issues related to food quality, meal service, and resident's nutritional needs. Jan 13, 2022
Corrected

Compare Nursing Homes around New York City The information below is reported by the New York State Department of Health.

5 facilities compared · CMS & NY Dept. of Health data · Updated Apr 2026

Filter by care type
Fort Tryon Center for Rehabilitation and Nursing
NH

Nursing Home Licensed facility providing 24/7 skilled nursing care for residents with complex, ongoing medical needs. Staffed by RNs, LPNs, and CNAs. Inspected and star-rated annually by CMS. Accepts Medicare (short-term rehab) and Medicaid (long-term care).

New York City (Manhattan)
205
97.9%
+11%
3.63
+8%
+1%
0
9
3.0
0
199
-
88
Nakdimen, Shelly
$32.8M
$7.7M
23.5%
335257
Dry Harbor Nursing Home and Rehabilitation Center
MC

Memory Care Secured, specialized care for people living with Alzheimer's or dementia. Staff trained in cognitive impairment, with higher staff-to-resident ratios and an environment designed to reduce confusion and wandering risk.

NH

Nursing Home Licensed facility providing 24/7 skilled nursing care for residents with complex, ongoing medical needs. Staffed by RNs, LPNs, and CNAs. Inspected and star-rated annually by CMS. Accepts Medicare (short-term rehab) and Medicaid (long-term care).

Middle Village (Flushing)
360
93.3%
+6%
3.83
+52%
+7%
0
15
5.0
0
333
-
86
Strasser, Jonathan
$79.0M
$20.1M
25.5%
335416
ArchCare at Mary Manning Walsh Nursing Home & Rehabilitation Center
NH

Nursing Home Licensed facility providing 24/7 skilled nursing care for residents with complex, ongoing medical needs. Staffed by RNs, LPNs, and CNAs. Inspected and star-rated annually by CMS. Accepts Medicare (short-term rehab) and Medicaid (long-term care).

New York City (Manhattan)
360
93.7%
+6%
3.22
+73%
-10%
0
14
3.5
0
340
-
98
Catholic Healthcare Systems
$130.9M
$23.9M
18.3%
335050
Amsterdam Nursing Home
NH

Nursing Home Licensed facility providing 24/7 skilled nursing care for residents with complex, ongoing medical needs. Staffed by RNs, LPNs, and CNAs. Inspected and star-rated annually by CMS. Accepts Medicare (short-term rehab) and Medicaid (long-term care).

New York City (Manhattan)
409
95.7%
+8%
3.25
+39%
-9%
0
14
7.0
0
402
A+
93
Fenster, Judith
$87.7M
$22.9M
26.1%
335570
Elmhurst Care Center
MC

Memory Care Secured, specialized care for people living with Alzheimer's or dementia. Staff trained in cognitive impairment, with higher staff-to-resident ratios and an environment designed to reduce confusion and wandering risk.

NH

Nursing Home Licensed facility providing 24/7 skilled nursing care for residents with complex, ongoing medical needs. Staffed by RNs, LPNs, and CNAs. Inspected and star-rated annually by CMS. Accepts Medicare (short-term rehab) and Medicaid (long-term care).

East Elmhurst (East Elmhurst)
240
92.6%
+5%
3.53
-
-1%
0
0
0.0
0
225
-
57
-
$37.5M
$11.8M
31.5%
335814

Places of interest near ArchCare at Mary Manning Walsh Nursing Home & Rehabilitation Center

Address 5.9 miles from city center

Calculate Travel Distance to ArchCare at Mary Manning Walsh Nursing Home & Rehabilitation Center

Add your location

Address

Staffing Data (Q2 2025)

This data corresponds to Q2 2025 and is based on CMS Payroll-Based Journal.

Total staff 397
Employees 329
Contractors 68
Staff to resident ratio 1.18:1
572% better than New York average

New York average ratio: 0.18:1

Avg staff/day 200
Average shift 7.6 hours
0% compared with New York average

New York average: 7.7 hours

Total staff hours (quarter) 138,929
Nursing staff breakdown
Registered Nurse

Manages medical care and health needs.

Total count 85
Average shift length Info Average shift length. Calculated as total hours divided by days worked and average staff per day. 8 hours

This role is partially covered by contractors.

Licensed Practical Nurse

Assists with medical care and medications.

Total count 15
Average shift length Info Average shift length. Calculated as total hours divided by days worked and average staff per day. 7.3 hours

This role is partially covered by contractors.

Certified Nursing Assistant

Helps with daily care and mobility.

Total count 177
Average shift length Info Average shift length. Calculated as total hours divided by days worked and average staff per day. 7.8 hours

This role is partially covered by contractors.

Contractor staffing

Total hours from contractors

9.6%

13,397 contractor hours this quarter

Physical Therapy Assistant: 12 Certified Nursing Assistant: 8 Registered Nurse: 7 Clinical Nurse Specialist: 7 Speech Language Pathologist: 7 Physical Therapy Aide: 6 Respiratory Therapy Technician: 4 Licensed Practical Nurse: 4 Occupational Therapy Assistant: 4 Mental Health Service Worker: 2 Feeding Assistant: 2 Occupational Therapy Aide: 2 Qualified Social Worker: 2 Qualified Activities Professional: 1
Staff by category
Certified Nursing Assistant169817771,28591100%7.8
Registered Nurse7878531,19991100%8
Licensed Practical Nurse114155,44691100%7.3
Physical Therapy Assistant1012225,26991100%7.2
Clinical Nurse Specialist127194,9767582%7.2
Speech Language Pathologist107174,7559099%7.1
Mental Health Service Worker7292,8647886%7.3
Respiratory Therapy Technician5492,30391100%7.2
Other Social Services Staff6062,0968897%6.9
Physical Therapy Aide3691,9378290%6.8
Other Dietary Services Staff8081,6309099%6.2
Occupational Therapy Aide1231,2036774%7.9
Qualified Social Worker2249196571%7
Administrator2027987178%7
Qualified Activities Professional0115046369%8
Feeding Assistant0224716571%7.3
Nurse Practitioner1014416369%7
Medical Director1013434954%7
Nurse Aide in Training3032491415%7.1
Occupational Therapy Assistant0442413134%6
177 Certified Nursing Assistant
% of Days 100%
85 Registered Nurse
% of Days 100%
15 Licensed Practical Nurse
% of Days 100%
22 Physical Therapy Assistant
% of Days 100%
19 Clinical Nurse Specialist
% of Days 82%
17 Speech Language Pathologist
% of Days 99%
9 Mental Health Service Worker
% of Days 86%
9 Respiratory Therapy Technician
% of Days 100%
6 Other Social Services Staff
% of Days 97%
9 Physical Therapy Aide
% of Days 90%
8 Other Dietary Services Staff
% of Days 99%
3 Occupational Therapy Aide
% of Days 74%
4 Qualified Social Worker
% of Days 71%
2 Administrator
% of Days 78%
1 Qualified Activities Professional
% of Days 69%
2 Feeding Assistant
% of Days 71%
1 Nurse Practitioner
% of Days 69%
1 Medical Director
% of Days 54%
3 Nurse Aide in Training
% of Days 15%
4 Occupational Therapy Assistant
% of Days 34%

Facility Characteristics

Source: CMS Long-Term Care Facility Characteristics (Data as of Jan 2026)

Total census
337 residents
Residents by payment source
Medicare
118 residents (35%)
Medicaid
188 residents (55.8%)
Private pay or other
31 residents (9.2%)
Programs & Services
Residents' Group

Residents meet regularly to discuss policies, care quality, and activities

Family Member Group

Family members meet regularly to discuss policies, care quality, and activities

Nurse Aide Training

State-approved Nurse Aide Training and Competency Evaluation Program on-site

Active Family Council

Organized group of family members that meets regularly to discuss facility policies, resident care, and activities.

Active Resident Council

Organized group of residents that meets regularly to discuss facility policies, quality of life, and activities.

Quality of care over time

These measures show how residents usually do over time at this home, based on health outcomes and preventive care.

High-risk clinical events score Info A composite score based on pressure ulcers, falls with injury, weight loss, walking ability decline, and activities of daily living decline. 6.0
39% better than New York average

New York average: 9.8

Functional decline score Info A composite score based on activities of daily living decline, walking ability decline, and incontinence. 8.7
52% better than New York average

New York average: 18.1

Long-stay resident measures
Need for Help with Daily Activities Increased Info Percent of long-stay residents whose need for help with daily activities has increased 7.5%
55% better than New York average

New York average: 16.4%

Walking Ability Worsened Info Percent of long-stay residents whose ability to move independently worsened 10.7%
36% better than New York average

New York average: 16.6%

Low Risk Residents with Bowel/Bladder Incontinence Info Percent of low risk long-stay residents who lose control of their bowels or bladder 7.9%
63% better than New York average

New York average: 21.4%

Falls with Major Injury Info Percent of long-stay residents experiencing one or more falls with major injury 2.7%
8% better than New York average

New York average: 3.0%

High Risk Residents with Pressure Ulcers Info Percent of long-stay high risk residents with pressure ulcers 3.7%
48% better than New York average

New York average: 7.2%

Urinary Tract Infection Info Percent of long-stay residents with a urinary tract infection 0.2%
84% better than New York average

New York average: 1.4%

Lost Too Much Weight Info Percent of long-stay residents who lose too much weight 5.2%
15% better than New York average

New York average: 6.1%

Depressive Symptoms Info Percent of long-stay residents who have depressive symptoms 4.6%
75% better than New York average

New York average: 18.1%

Antipsychotic Use Info Percent of long-stay residents who received an antipsychotic medication 5.6%
55% better than New York average

New York average: 12.6%

Pneumococcal Vaccine Info Percent of long-stay residents assessed and appropriately given the pneumococcal vaccine 99.8%
9% better than New York average

New York average: 91.4%

Influenza Vaccine Info Percent of long-stay residents assessed and appropriately given the seasonal influenza vaccine 100.0%
5% better than New York average

New York average: 95.2%

Short-stay resident measures
Pneumococcal Vaccine Info Percent of short-stay residents assessed and appropriately given the pneumococcal vaccine 95.6%
25% better than New York average

New York average: 76.6%

Antipsychotic medication increase Info Percent of short-stay residents who newly received an antipsychotic medication 0.7%
46% better than New York average

New York average: 1.3%

Influenza Vaccine Info Percent of short-stay residents assessed and appropriately given the seasonal influenza vaccine 94.3%
20% better than New York average

New York average: 78.8%

Guides for Better Senior Living

Care Cost Calculator: See Prices in Your Area

Nursing Home Data Explorer

Don’t Wait Too Long: 7 Red Flag Signs Your Parent Needs Assisted Living Now

The True Cost of Assisted Living in 2025 – And How Families Are Paying For It

Understanding Senior Living Costs: Pricing Models, Discounts & Financial Assistance

Financial Aid for New York Seniors

Get financial aid guidance

Community First Choice Option

NY Medicaid CFCO

Age 65+ or disabled, New York resident, Medicaid- eligible, care need (not necessarily nursing home level).

~$2,829/month (300% FBR, individual).

$30,182 (individual, higher due to NY Medicaid expansion).

Higher asset limit; urban density increases demand.

Expanded In-Home Services for the Elderly Program (EISEP)

NY EISEP

Age 60+, New York resident, at risk of decline but not nursing home level.

~$2,500/month (individual, varies).

$15,000 (individual).

Cost-sharing required above certain income; urban/rural balance.

Senior Citizen Rent Increase Exemption (SCRIE)

NY SCRIE

Age 62+, NYC resident, live in rent-controlled/stabilized apartment, spend >1/3 of income on rent.

$50,000/year (household).

No strict asset cap, but income-focused eligibility.

Limited to NYC’s rent-regulated units; high demand in urban areas.

Senior Citizen Homeowners’ Exemption (SCHE)

NY SCHE

Age 65+, NYC resident, own and live in a 1-3 family home, co-op, or condo.

$58,399/year (household).

No strict asset cap, income-driven eligibility.

Applies only in NYC; excludes large apartment buildings.

New York Foundation for Senior Citizens (NYFSC) Home Sharing Program

NYFSC Home Sharing

One participant must be 60+ (host or guest), NYC resident, able to share living space.

No strict limit, but targets those needing cost relief.

Not applicable; focus on housing need.

Primarily NYC-focused; limited slots due to demand.