Dry Harbor Nursing Home and Rehabilitation Center
Nursing Home, Nursing Care & Respite Care · New York City, NY
CMS overall rating Info The Overall CMS Rating is scored from 1 to 5 stars and combines results from health inspections, staffing levels, and quality measures. Health inspections carry the most weight. Staffing and quality scores can increase or decrease the final rating based on performance compared to state and national standards.

Dry Harbor Nursing Home and Rehabilitation Center

Nursing Home, Nursing Care & Respite Care · New York City, NY
CMS overall rating Info The Overall CMS Rating is scored from 1 to 5 stars and combines results from health inspections, staffing levels, and quality measures. Health inspections carry the most weight. Staffing and quality scores can increase or decrease the final rating based on performance compared to state and national standards.
Calculator: See prices in your area
Dry Harbor Nursing Home and Rehabilitation Center accepts Medicare, Medicaid, and private pay.

Overview of Dry Harbor Nursing Home and Rehabilitation Center

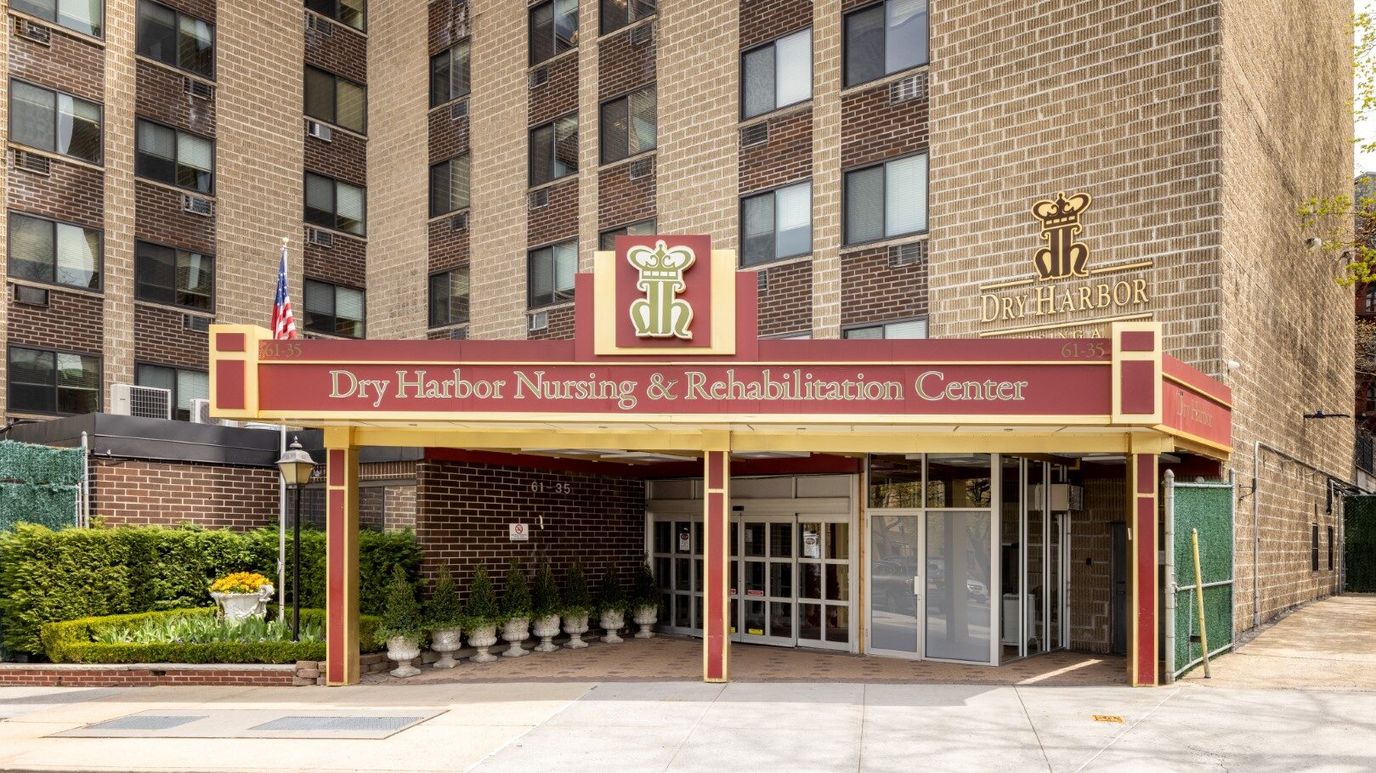
Dry Harbor Nursing Home and Rehabilitation Center is a compassionate nursing home in Middle Village, NY, that offers a wide range of care options that focus on older adults’ healing and recovery. Dedicated to maintaining older adults’ independence and individuality, the community promotes a nurturing environment. With rehabilitation therapies, nutrition programs, and discharge planning, older adults are guaranteed to receive high-quality care. The community works closely with older adults to craft comprehensive care plans that best match their healthcare needs. 

Physical, occupational, and speech therapies are conducted seven days a week to help residents return to their normal lives as quickly as possible. A state-of-the-art gym, lively recreational spaces, and a dining room are also available for residents’ leisure and wellness. Situated near public transportation and other local amenities, residents have easy access to their needs. As one of the most sought-after nursing homes in New York, this nursing home ensures residents are well-cared for during their stay.

Quality ratings

Measured by Centers for Medicare & Medicaid Services (CMS)

Overall rating Info The Overall CMS Rating combines results from health inspections, staffing levels and quality measures. Health inspections carry the most weight. Staffing and quality scores can increase or decrease the final rating based on performance compared to state and national standards.
▲ 59.2% Above NY avg. ▲ 59.2% Above NY avg.Click the badge to see the full State ranking.Click here to see the full State ranking.
Health Inspection Info Based on the results of the facility's three most recent standard inspections and any complaint investigations. CMS reviews the number, scope, and severity of deficiencies, with more recent findings weighted more heavily.
▲ 40.8% Above NY avg. ▲ 40.8% Above NY avg.Click the badge to see the full State ranking.Click here to see the full State ranking.
Staffing Info Measures average nursing staff hours per resident per day, including Registered Nurses (RNs) and total nursing staff. Ratings are adjusted based on the level of care residents require and are compared to state and national benchmarks.
▲ 48.1% Above NY avg. ▲ 48.1% Above NY avg.Click the badge to see the full State ranking.Click here to see the full State ranking.
Quality Measures Info Based on clinical and physical health indicators reported to CMS, such as hospital readmissions, falls, pressure ulcers, and improvements in mobility. These measures reflect how well residents' health needs are being managed.
▲ 26.6% Above NY avg. ▲ 26.6% Above NY avg.Click the badge to see the full State ranking.Click here to see the full State ranking.

Staffing hours breakdown

Info Daily nursing hours per resident by staff type, reported to CMS. Higher is generally better — compare this facility to state and national averages to see where staffing stands.

Hours per resident per day — compared to New York state averages

Total nursing care / resident Info This home is ranked 111th out of 388 homes in New York. Total adjusted nursing hours per resident per day, combining RN, LPN, and aide time. CMS adjusts this for case-mix so facilities can be fairly compared.
3h 50m per day
Rank #111 / 388Nurse hours — State benchmarkedThis home is ranked 111th out of 388 homes in New York. Shows adjusted nurse hours per resident per day benchmarked to the New York average, with a ranking across 388 New York SNFs. More hours mean more direct care. The national average is about 3.5 hrs; below 3.0 is a red flag.Click the rank badge to see the full State ranking.Click here to see the full State ranking.
This facility New York avg (3h 29m per day)
vs New York avg
+10%

2 of 6 metrics below state avg

Standout metric Weekend RN is +57% above state avg
Staff typeHours / Day / Residentvs state avg
Registered Nurse (RN) Info RNs hold the highest nursing license and can assess residents, interpret test results, and direct care plans. More RN hours per day often signals stronger clinical oversight and faster response to health changes. 55m per day ▲ 31% State avg: 42m per day · National avg: 41m per day
LPN / LVN Info Licensed Practical Nurses (LPNs) or Licensed Vocational Nurses (LVNs) deliver routine hands-on care — medication administration, wound dressing, and monitoring vital signs. They work under RN supervision and make up a large share of daily bedside care. 21m per day ▼ 54% State avg: 46m per day · National avg: 52m per day
Nurse Aide Info Certified Nurse Aides (CNAs) provide the most direct day-to-day assistance: bathing, dressing, feeding, and mobility. Nurse aide hours are typically the largest staffing category and directly affect residents' quality of life. 2h 46m per day ▲ 27% State avg: 2h 11m per day · National avg: 2h 21m per day
Weekend Total Nursing Info Combined nursing hours (RN + LPN + Nurse Aide) per resident per day on weekends. Staffing often drops on weekends — this figure reveals whether the facility maintains adequate coverage outside of weekday hours. 3h 51m per day ▲ 22% State avg: 3h 10m per day · National avg: 3h 26m per day
Physical Therapist Info Hours per resident per day provided by licensed Physical Therapists (PTs) or PT Assistants. PT services help residents recover mobility after injury or illness and are especially important for post-acute (short-stay) rehabilitation. 3m per day ▼ 57% State avg: 7m per day · National avg: 4m per day
Weekend RN Info Registered nurse hours specifically on weekends. Facilities sometimes reduce RN presence on Saturdays and Sundays — a low weekend RN figure compared to weekday hours can indicate reduced clinical oversight when most administrative staff are absent. 44m per day ▲ 57% State avg: 28m per day · National avg: 29m per day

Types of Care at Dry Harbor Nursing Home and Rehabilitation Center

Nursing Home Nursing Care Respite Care

Capacity and availability

Avg. Length of Stay
134 days
Bed community size
360-bed community Rank #35 / 752Bed count — State benchmarkedThis home is ranked 35th out of 752 homes in New York. Shows this facility's certified or reported bed count compared to other New York SNFs. Larger communities may offer more amenities, programs, and on-site services for residents and families.Click the rank badge to see the full State ranking.Click here to see the full State ranking.
A large-scale community that may provide a wide range of amenities, services, and structured programs.
Walk Score
Walk Score: 86 / 100 Rank #360 / 1167Walk Score — State benchmarkedThis home is ranked 360th out of 1167 homes in New York. Shows how walkable this facility's neighborhood is compared to the average Walk Score across New York SNFs. Higher scores benefit residents, families, and staff.Click the rank badge to see the full State ranking.Click here to see the full State ranking.
Very walkable. Most errands can be accomplished on foot, and many essentials are within a short walk.

About this community

Occupancy

Occupancy rate
98%
Higher than the New York average: 88.3%
Occupied beds
352 / 360
Average occupied beds in New York homes 166 beds

License Details

Facility TypeNursing Home
CountyQueens
CMS Certification Number335416
AccreditationsCMS 5-star rated facility overall, with 5 stars for quality measures, 4 stars for staffing and 4 stars for health inspections

Ownership & Operating Entity

Dry Harbor Nursing Home and Rehabilitation Center is legally operated by Dry Harbor HRF, Inc (For Profit).

Therapy & Rehabilitation

2 services
Rehabilitation Services
Short-Term Rehab

Memory & Specialized Care

1 service
No Alzheimer's certification

Additional Policies & Features

Visitor PolicyRegular visiting hours are 9am to 7pm, 7 days a week.

Amenities & Lifestyle

Smart Tv With Free Internet & Cable Access
Unlimited Telephone Service
Wi-Fi Internet Service For Personal Computers
Use Of Facility Computer With Internet
Daily Newspaper Delivery
Transportation For Family Visits
Specific ProgramsNursing & Medical Care, Recreation, Schedule a Visit
Operating Hours9am to 7pm, 7 days a week

Dining & Nutrition

Food DescriptionMeals are prepared in-house and tailored to meet specific dietary requirements, including kosher meals.

Contact Dry Harbor Nursing Home and Rehabilitation Center

Inspection History

In New York, the Department of Health, Office of Aging and Long Term Care performs unannounced onsite inspections to monitor compliance with state and federal healthcare regulations.

Inspection Score Info A composite 0–100 score combining this facility's inspections, citations, complaints, and enforcement actions relative to the New York state average. See the nursing homes benchmark below for the typical New York score; higher is better.

D · Below the New York average for nursing homes.

New York nursing homes benchmark: C 74/100

Inspection score: 64 out of 100. Letter grade D. Below the New York average for nursing homes.

Enforcement Actions Info Enforcement actions are formal penalties or interventions imposed by New York regulators when a nursing home fails to meet state or federal care, safety, or regulatory standards. They may include directed plans of correction, civil monetary penalties, denial of payment, or appointment of temporary management.

Since 2020
2 enforcement actions

This facility has 2 enforcement actions. 34% of New York nursing homes have zero, and the statewide average is 1.6.

  • November 24, 2020 Quality of Care #NH-22-036
  • April 7, 2021 Quality of Care #NH-21-140

Inspection Scorecard Info This scorecard compares key inspection, citation, and complaint metrics at this facility against the New York state average. Metrics rated ≥15% worse than average are highlighted in red; those ≥15% better are highlighted in green.

Since 2021 vs. New York state average
Overall vs. NY average 7 Worse Metrics worse than New York average:
• Total citations (23% above)
• Life safety citations (25% above)
• Citations per year (23% above)
• Citations per inspection (64% above)
• Inspection citation rate (30% above)
• Total complaints (44% above)
• Complaints per year (44% above)
1 At Avg Metrics at New York average:
• Inspections with citations (at NY avg)
4 Better Metrics better than New York average:
• Health citations (45% below)
• Total inspections (22% below)
• Complaints per bed (36% below)
• Complaint investigations (40% below)
Latest Inspection April 22, 2025 Annual Inspection

Citations Info Citations are formal regulatory issues recorded during state inspections.

This FacilityNY Averagevs. NY Avg
Total citations Info Formal regulatory issues recorded by inspectors across all inspection types. 1613 This facility has 23% more total citations than a typical New York nursing home (16 vs. NY avg 13).↑ 23% worse
Health citations Info Violations related to resident care, clinical practices, and day-to-day operations. 1120 This facility has 45% fewer health citations than a typical New York nursing home (11 vs. NY avg 20).↓ 45% better
Life safety citations Info Violations related to building safety — fire prevention, emergency egress, and similar. 54 This facility has 25% more life safety citations than a typical New York nursing home (5 vs. NY avg 4).↑ 25% worse
Citations per year Info Average citations per year since 2021. 3.22.6 This facility has 23% more citations per year than a typical New York nursing home (3.2 vs. NY avg 2.6).↑ 23% worse
Citations per inspection Info Average citations per inspection. 2.31.4 This facility has 64% more citations per inspection than a typical New York nursing home (2.3 vs. NY avg 1.4).↑ 64% worse

Inspections Info State inspections evaluate whether the facility meets health and safety standards.

This FacilityNY Averagevs. NY Avg
Total inspections Info Combined count of all routine and focused inspections. Excludes complaint investigations. 79 This facility has 22% fewer total inspections than a typical New York nursing home (7 vs. NY avg 9).↓ 22% better
Inspections with citations Info Inspections that resulted in at least one regulatory citation. 44 This facility has inspections with citations in line with the New York average (4 vs. NY avg 4).— At avg
Inspection citation rate Info Percentage of inspections that resulted in at least one citation. 57%44% This facility has 13 percentage points higher inspection citation rate than a typical New York nursing home (57% vs. NY avg 44%).↑ 13% worse

Complaints & Investigations Info Complaints are formal concerns filed by residents, families, or staff. Investigations are on-site follow-ups.

This FacilityNY Averagevs. NY Avg
Total complaints Info Formal expressions of concern made by residents, families, or staff. 11479 This facility has 44% more total complaints than a typical New York nursing home (114 vs. NY avg 79).↑ 44% worse
Complaints per year Info Average complaints per year since 2021. 22.815.8 This facility has 44% more complaints per year than a typical New York nursing home (22.8 vs. NY avg 15.8).↑ 44% worse
Complaints per bed Info Size-adjusted complaint rate based on occupied beds. 0.320.50 This facility has 36% fewer complaints per bed than a typical New York nursing home (0.32 vs. NY avg 0.5).↓ 36% better
Complaint investigations Info On-site investigations triggered by complaints filed with New York regulators. 915 This facility has 40% fewer complaint investigations than a typical New York nursing home (9 vs. NY avg 15).↓ 40% better

Inspection Reports Summary Info An editor-reviewed summary of the themes and findings across this facility's recent inspection reports.

The most recent inspection on April 22, 2025, identified multiple deficiencies including failure to timely report an injury of unknown source, incomplete care planning for osteoporosis, and issues with medication administration and documentation. Earlier inspections showed a pattern of similar issues with care planning, reporting suspected abuse promptly, medication management, and some food service and safety concerns, many of which were corrected over time. Complaint investigations substantiated a privacy violation involving a resident’s image posted on social media without consent, resulting in staff termination and policy updates, while other complaints about abuse reporting were unsubstantiated or involved no enforcement actions. Enforcement actions such as fines or license suspensions were not listed in the available reports. The facility’s inspection history indicates ongoing challenges with regulatory compliance, particularly in care planning and reporting, with some corrective actions taken but deficiencies persisting into the most recent survey.

Read the full inspection reports for this facility, including detailed findings and corrective actions.

Show Inspection Reports

Health Inspection History

Inspections since 2021
Total health inspections 3

New York average 3.6


Last Health inspection on Apr 2025

Total health citations
15 Rank #165 / 394Health citations — State benchmarkedThis home is ranked 165th out of 394 homes in New York. Shows this facility's total health deficiency citations benchmarked to the New York State average, with a ranking across all 394 NY SNFs. Lower citation counts earn a better rank.Click the rank badge to see the full State ranking.Click here to see the full State ranking.

New York average 18.5

Citations per inspection
5 Rank #213 / 394Citations per inspection — State benchmarkedThis home is ranked 213th out of 394 homes in New York. Shows average deficiency citations per CMS inspection for this facility versus the New York mean across 394 SNFs with citation data. Lower is better.Click the rank badge to see the full State ranking.Click here to see the full State ranking.

New York average 5.05


Health citations are formal notices following inspections when they fail to comply with safety and care standards.

14 of 15 citations resulted from standard inspections; and 1 of 15 came from combined inspections (standard and complaint).

Breakdown of citation severity (last 5 years)
Critical health citations
0
100% better than New York average

New York average: 0.2


Serious health citations
0
100% better than New York average

New York average: 0.2

0 critical citations New York average: 0.2

0 serious citations New York average: 0.2

15 moderate citations New York average: 17.4

0 minor citations New York average: 0.7
Citations history (last 5 years)
Abuse/Neglect moderate citation Apr 22, 2025
Corrected

Pharmacy moderate citation Apr 22, 2025
Corrected

Care Planning moderate citation Apr 22, 2025
Corrected

Care Planning moderate citation Apr 22, 2025
Corrected

Infection Prevention & Vaccination

How this facility protects residents through staff vaccination policies and immunization practices.

Employee Flu Vaccination Rate: 79%

Percentage of facility employees vaccinated against influenza.

Staffing Data

Reporting period: October 1 – December 31, 2025 (Q4 2025). Source: CMS Payroll-Based Journal report.

Total staff 489
Employees 486
Contractors 3
Staff to resident ratio 1.48:1
743% better than New York average
New York average ratio: 0.18:1 New York average ratio: 0.18:1See full New York ranking
Avg staff/day 245
Average shift 6.9 hours
10% worse than New York average
New York average: 7.7 hours New York average shift: 7.7 hoursSee full New York ranking
Total staff hours (quarter) 155,928

Nursing staff breakdown

Q4 2025 · Oct 1 – Dec 31 More info This data comes from the CMS Payroll-Based Journal report covering October 1 – December 31, 2025.
Registered Nurse

Manages medical care and health needs.

RN Staff 102
Average shift length Info Average shift length. Calculated as total hours divided by days worked and average staff per day. 7.4 hours

This role is partially covered by contractors.

Licensed Practical Nurse

Assists with medical care and medications.

LPN Staff 33
Average shift length Info Average shift length. Calculated as total hours divided by days worked and average staff per day. 6.5 hours

This role is partially covered by contractors.

Certified Nursing Assistant

Helps with daily care and mobility.

CNA Staff 265
Average shift length Info Average shift length. Calculated as total hours divided by days worked and average staff per day. 6.8 hours

No contractors work on this role.

Contractor staffing

Q4 2025 · Oct 1 – Dec 31 More info This data comes from the CMS Payroll-Based Journal report covering October 1 – December 31, 2025.

Total hours from contractors

0.4%

562 contractor hours this quarter

Registered Nurse: 1 Licensed Practical Nurse: 1 Respiratory Therapy Technician: 1

Staff by category

Q4 2025 · Oct 1 – Dec 31 More info This data comes from the CMS Payroll-Based Journal report covering October 1 – December 31, 2025.
Certified Nursing Assistant265026587,56692100%6.8
Registered Nurse101110231,26892100%7.4
Licensed Practical Nurse321339,27392100%6.5
Physical Therapist200205,51392100%6.2
Respiratory Therapist130135,0837986%7.6
Therapeutic Recreation Specialist120124,9907885%8.1
Dietitian110113,29492100%6.2
Respiratory Therapy Technician8191,6967683%7.6
Dental Services Staff4041,6127784%6.9
Physical Therapy Assistant6061,5177986%7
Occupational Therapy Aide4041,5127986%7
Qualified Social Worker3038076368%7
Administrator1014065863%7
Clinical Nurse Specialist1013804953%7.8
Mental Health Service Worker1013765358%7.1
Medical Director1012605257%5
Other Physician2022454043%4.6
RN Director of Nursing1011323134%4.3
265 Certified Nursing Assistant
% of Days 100%
102 Registered Nurse
% of Days 100%
33 Licensed Practical Nurse
% of Days 100%
20 Physical Therapist
% of Days 100%
13 Respiratory Therapist
% of Days 86%
12 Therapeutic Recreation Specialist
% of Days 85%
11 Dietitian
% of Days 100%
9 Respiratory Therapy Technician
% of Days 83%
4 Dental Services Staff
% of Days 84%
6 Physical Therapy Assistant
% of Days 86%
4 Occupational Therapy Aide
% of Days 86%
3 Qualified Social Worker
% of Days 68%
1 Administrator
% of Days 63%
1 Clinical Nurse Specialist
% of Days 53%
1 Mental Health Service Worker
% of Days 58%
1 Medical Director
% of Days 57%
2 Other Physician
% of Days 43%
1 RN Director of Nursing
% of Days 34%

Penalties and fines

Federal penalties imposed by CMS for regulatory violations, including civil money penalties (fines) and denials of payment for new Medicare/Medicaid admissions.

Source: CMS Penalties Database

No penalties in the past 3 years

No civil money penalties or payment denials were reported in the last 3 years.

Quality of care over time

These measures show how residents usually do over time at this home, based on health outcomes and preventive care.

High-risk clinical events score Info A composite score based on pressure ulcers, falls with injury, weight loss, walking ability decline, and activities of daily living decline. 6.1
38% better than New York average

New York average: 9.8

Functional decline score Info A composite score based on activities of daily living decline, walking ability decline, and incontinence. 16.3
10% better than New York average

New York average: 18.1

Long-stay resident measures
Significantly above average New York avg: 4.0 Info CMS star rating based on long-stay quality measure performance. 5 stars = significantly above average, 1 star = significantly below average.
Need for Help with Daily Activities Increased Info Percent of long-stay residents whose need for help with daily activities has increased 11.7%
29% better than New York average

New York average: 16.4%

Walking Ability Worsened Info Percent of long-stay residents whose ability to move independently worsened 9.2%
45% better than New York average

New York average: 16.6%

Low Risk Residents with Bowel/Bladder Incontinence Info Percent of low risk long-stay residents who lose control of their bowels or bladder 28.1%
32% worse than New York average

New York average: 21.4%

Falls with Major Injury Info Percent of long-stay residents experiencing one or more falls with major injury 1.2%
60% better than New York average

New York average: 3.0%

High Risk Residents with Pressure Ulcers Info Percent of long-stay high risk residents with pressure ulcers 6.4%
10% better than New York average

New York average: 7.2%

Urinary Tract Infection Info Percent of long-stay residents with a urinary tract infection 0.7%
54% better than New York average

New York average: 1.4%

Lost Too Much Weight Info Percent of long-stay residents who lose too much weight 2.2%
64% better than New York average

New York average: 6.1%

Depressive Symptoms Info Percent of long-stay residents who have depressive symptoms 3.7%
80% better than New York average

New York average: 18.1%

Antipsychotic Use Info Percent of long-stay residents who received an antipsychotic medication 5.6%
56% better than New York average

New York average: 12.6%

Pneumococcal Vaccine Info Percent of long-stay residents assessed and appropriately given the pneumococcal vaccine 91.4%
In line with New York average

New York average: 91.4%

Influenza Vaccine Info Percent of long-stay residents assessed and appropriately given the seasonal influenza vaccine 99.7%
5% better than New York average

New York average: 95.2%

Hospitalizations per 1,000 days Info Number of hospitalizations per 1,000 long-stay resident days. 0.98
43% better than New York average

New York average: 1.71

ED visits per 1,000 days Info Number of outpatient emergency department visits per 1,000 long-stay resident days. 0.70
48% better than New York average

New York average: 1.35

Short-stay resident measures
Significantly above average New York avg: 3.5 Info CMS star rating based on short-stay quality measure performance. 5 stars = much above average, 1 star = much below average.
Pneumococcal Vaccine Info Percent of short-stay residents assessed and appropriately given the pneumococcal vaccine 76.2%
In line with New York average

New York average: 76.6%

Antipsychotic medication increase Info Percent of short-stay residents who newly received an antipsychotic medication 0.6%
50% better than New York average

New York average: 1.3%

Influenza Vaccine Info Percent of short-stay residents assessed and appropriately given the seasonal influenza vaccine 88.9%
13% better than New York average

New York average: 78.8%

Re-hospitalized after SNF stay Info Percentage of short-stay residents who were re-hospitalized after their nursing home admission. 14.3%
31% better than New York average

New York average: 20.6%

Emergency department visits Info Percentage of short-stay residents who had an outpatient emergency department visit. 5.4%
44% better than New York average

New York average: 9.7%

Falls with major injury Info Percentage of SNF residents who experience falls with major injury during their stay. 1.1%
47% worse than New York average

New York average: 0.8%

Ability to care for self at discharge Info Percentage of residents at or above expected ability to care for themselves at discharge. 44.1%
18% worse than New York average

New York average: 53.7%

Successful return to home or community Info Rate of successful return to home or community from a skilled nursing facility. 57.7%
14% better than New York average

New York average: 50.6%

Breakdown by payment type

Medicare

42% of new residents, usually for short-term rehab.

Typical stay 5 - 6 months

Private pay

57% of new residents, often for short stays.

Typical stay 2 - 3 months

Medicaid

1% of new residents, often for long-term daily care.

Facility Characteristics

Source: CMS Long-Term Care Facility Characteristics (Data as of Jan 2026)

Total residents 331
Medicare
102
30.8% of residents
Medicaid
215
65% of residents
Private pay or other
14
4.2% of residents
Programs & Services
Residents Group

Residents meet regularly to discuss policies, care quality, and activities

Family Member Group

Family members meet regularly to discuss policies, care quality, and activities

Active Family Council

Organized group of family members that meets regularly to discuss facility policies, resident care, and activities.

Active Resident Council

Organized group of residents that meets regularly to discuss facility policies, quality of life, and activities.

Finances and operations

Privately-owned community
Operated by a business corporation.
Home revenue
$79.7M
Profit
$6.3M
Privately-owned community Operated by a business corporation.
Home revenue
$79.7M Rank #28 / 383Revenue — State benchmarkedThis home is ranked 28th out of 383 homes in New York. Shows this facility's annual revenue compared to the New York SNF average. Higher revenue generally means more resources for staffing and capital — read alongside Payroll %.Click the rank badge to see the full State ranking.Click here to see the full State ranking.
Profit
$6.3M
Payroll costs Info The portion of the home's budget spent on staff, including nurses, caregivers, and other employees who support care and operations. Rank #44 / 383Payroll — State benchmarkedThis home is ranked 44th out of 383 homes in New York. Shows total annual staff payroll benchmarked to the New York average. Higher payroll investment relative to peers often signals better staffing and less reliance on cheaper contract labor.Click the rank badge to see the full State ranking.Click here to see the full State ranking.
$31.8M
39.9% of revenue Rank #312 / 383Payroll % — State benchmarkedThis home is ranked 312th out of 383 homes in New York. Shows payroll as a percentage of revenue versus the New York average. Well-run New York SNFs typically land around 53–65% — the top third Statewide. Below 25% may signal understaffing or heavy agency use — read with Staffing ratings.Click the rank badge to see the full State ranking.Click here to see the full State ranking.
Other operating costs Info All remaining costs needed to run the home, such as food, utilities, building maintenance, supplies and administrative expenses.
$41.6M
Total costs $73.4M

What does this home offer?

Total residents icon

Total Residents: 360

Housing options icon

Housing Options: Private / Shared Rooms

Building type icon
Building type icon

Building Type: High-rise

Dining services icon

Dining Services

Housekeeping icon
Housekeeping icon

Housekeeping Services

Social and recreational activities icon

Social and Recreational Activities

Exercise program icon

Exercise Programs

Who this home usually serves

TYPE OF STAY

Mix of rehab and long-term care

This home supports both short-term rehab and long-term care, with residents staying for a wide range of durations.

Places of interest near Dry Harbor Nursing Home and Rehabilitation Center

Address 1.0 miles from city center Info Estimated distance in miles from Middle Village's city center to Dry Harbor Nursing Home and Rehabilitation Center's address, calculated via Google Maps. — 1.06 miles to nearest hospital (Emergency department - Long Island Jewish Forest Hills)

Calculate Travel Distance to Dry Harbor Nursing Home and Rehabilitation Center

Add your location

Address

Compare Nursing Home around New York City

The information below is reported by the New York State Department of Health.

Filter by care type
Dry Harbor Nursing Home and Rehabilitation Center
NH

Nursing Home Licensed facility providing 24/7 skilled nursing care for residents with complex, ongoing medical needs. Staffed by RNs, LPNs, and CNAs. Inspected and star-rated annually by CMS. Accepts Medicare (short-term rehab) and Medicaid (long-term care).

MC

Memory Care Secured, specialized care for people living with Alzheimer's or dementia. Staff trained in cognitive impairment, with higher staff-to-resident ratios and an environment designed to reduce confusion and wandering risk.

Middle Village (Flushing) -360 - 86Private / Shared Rooms
Amsterdam Nursing Home
NH

Nursing Home Licensed facility providing 24/7 skilled nursing care for residents with complex, ongoing medical needs. Staffed by RNs, LPNs, and CNAs. Inspected and star-rated annually by CMS. Accepts Medicare (short-term rehab) and Medicaid (long-term care).

New York City (Manhattan) -409 A+ 93Private / Shared Rooms
ArchCare at Mary Manning Walsh Nursing Home & Rehabilitation Center
NH

Nursing Home Licensed facility providing 24/7 skilled nursing care for residents with complex, ongoing medical needs. Staffed by RNs, LPNs, and CNAs. Inspected and star-rated annually by CMS. Accepts Medicare (short-term rehab) and Medicaid (long-term care).

New York City (Manhattan) -360 - 98Private / Shared Rooms
Upper East Side Rehabilitation and Nursing Center
NH

Nursing Home Licensed facility providing 24/7 skilled nursing care for residents with complex, ongoing medical needs. Staffed by RNs, LPNs, and CNAs. Inspected and star-rated annually by CMS. Accepts Medicare (short-term rehab) and Medicaid (long-term care).

MC

Memory Care Secured, specialized care for people living with Alzheimer's or dementia. Staff trained in cognitive impairment, with higher staff-to-resident ratios and an environment designed to reduce confusion and wandering risk.

New York City (Manhattan) -499 - 97Private / Shared Rooms
Fort Tryon Center for Rehabilitation and Nursing
NH

Nursing Home Licensed facility providing 24/7 skilled nursing care for residents with complex, ongoing medical needs. Staffed by RNs, LPNs, and CNAs. Inspected and star-rated annually by CMS. Accepts Medicare (short-term rehab) and Medicaid (long-term care).

New York City (Manhattan) -205 - 88Private / Shared Rooms

Frequently Asked Questions about Dry Harbor Nursing Home and Rehabilitation Center

What neighborhood is Dry Harbor Nursing Home and Rehabilitation Center in?

Dry Harbor Nursing Home and Rehabilitation Center is in the Flushing neighborhood of Middle Village.

Who is the owner of Dry Harbor Nursing Home and Rehabilitation Center?

The legal owner and operator of Dry Harbor Nursing Home and Rehabilitation Center is Dry Harbor HRF, Inc (For Profit).

Is Dry Harbor Nursing Home and Rehabilitation Center in a walkable area?

Dry Harbor Nursing Home and Rehabilitation Center has a walk score of 86. Very walkable. Most errands can be accomplished on foot, and many essentials are within a short walk.

What is the occupancy rate at Dry Harbor Nursing Home and Rehabilitation Center?

Dry Harbor Nursing Home and Rehabilitation Center's occupancy is 98%.

How many beds does Dry Harbor Nursing Home and Rehabilitation Center have?

Dry Harbor Nursing Home and Rehabilitation Center has 360 beds.

Has Dry Harbor Nursing Home and Rehabilitation Center had any recent deficiencies or citations?

Dry Harbor Nursing Home and Rehabilitation Center has had 16 recently reported deficiencies.

What is the address of Dry Harbor Nursing Home and Rehabilitation Center?

Dry Harbor Nursing Home and Rehabilitation Center is located at 61-35 Dry Harbor Rd, Middle Village, NY 11379, United States.

Guides for Better Senior Living

Care Cost Calculator: See Prices in Your Area

Nursing Home Data Explorer

Don’t Wait Too Long: 7 Red Flag Signs Your Parent Needs Assisted Living Now

The True Cost of Assisted Living in 2025 – And How Families Are Paying For It

Understanding Senior Living Costs: Pricing Models, Discounts & Financial Assistance

Explore Open Rooms
1 Contact details
2 What type of senior care service are you looking for?
3 What budget do you have in mind for senior care?
4 How soon do you need to find care?
5 Additional details

Thank you for your interest!

Our team will be in touch shortly to help with next steps.