Arroyo Vista Nursing Center

Nursing Home · San Diego, CA
CMS overall rating Info The Overall CMS Rating is scored from 1 to 5 stars and combines results from health inspections, staffing levels, and quality measures. Health inspections carry the most weight. Staffing and quality scores can increase or decrease the final rating based on performance compared to state and national standards.
Arroyo Vista Nursing Center
Nursing Home · San Diego, CA
CMS overall rating Info The Overall CMS Rating is scored from 1 to 5 stars and combines results from health inspections, staffing levels, and quality measures. Health inspections carry the most weight. Staffing and quality scores can increase or decrease the final rating based on performance compared to state and national standards.
Calculator: See prices in your area
Arroyo Vista Nursing Center accepts Medicare, Medicaid, and private pay.

Overview of Arroyo Vista Nursing Center

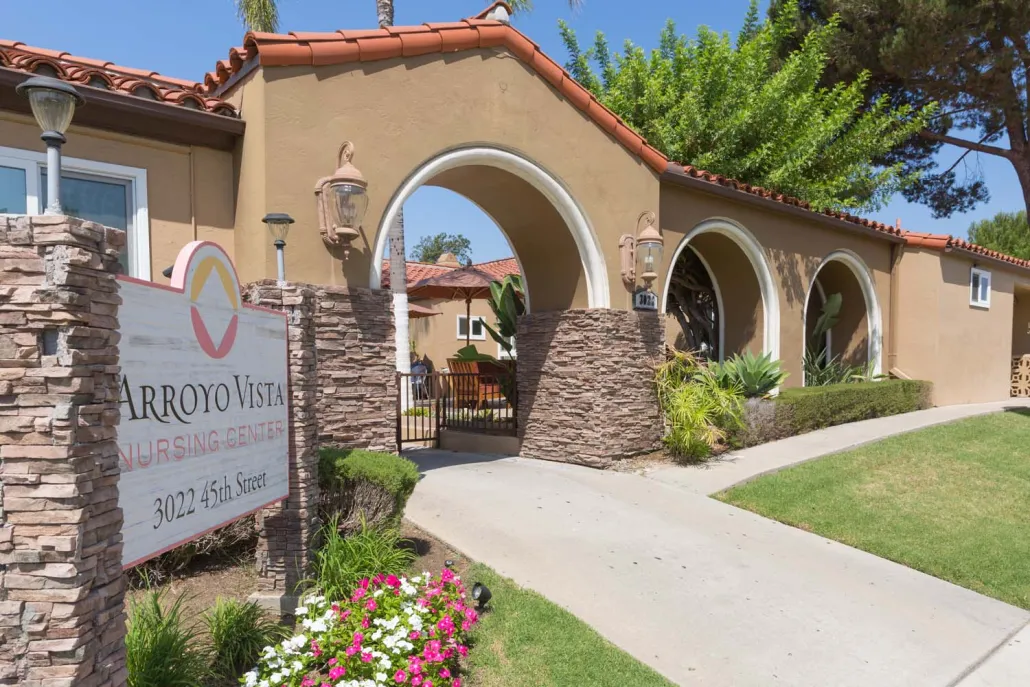
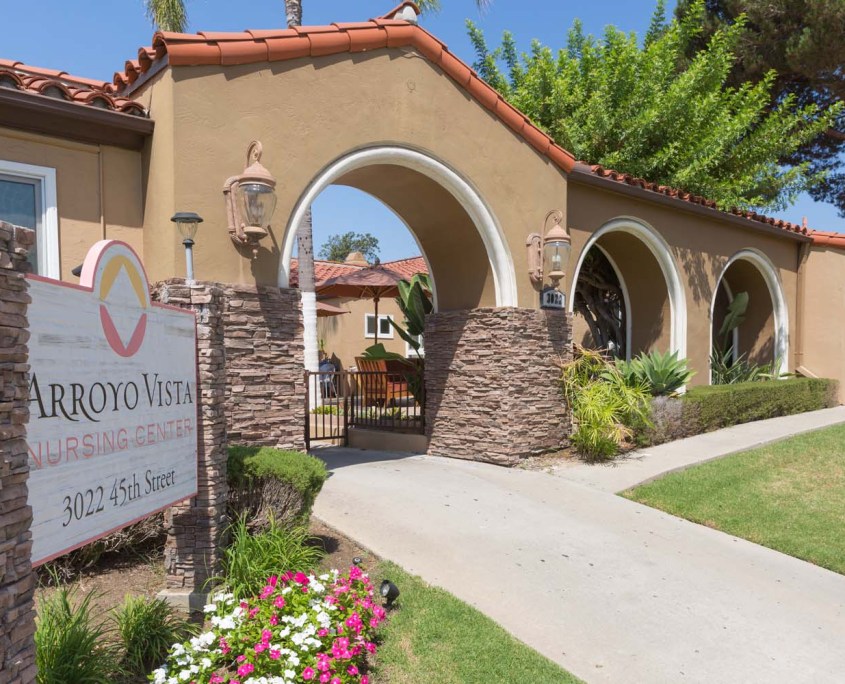
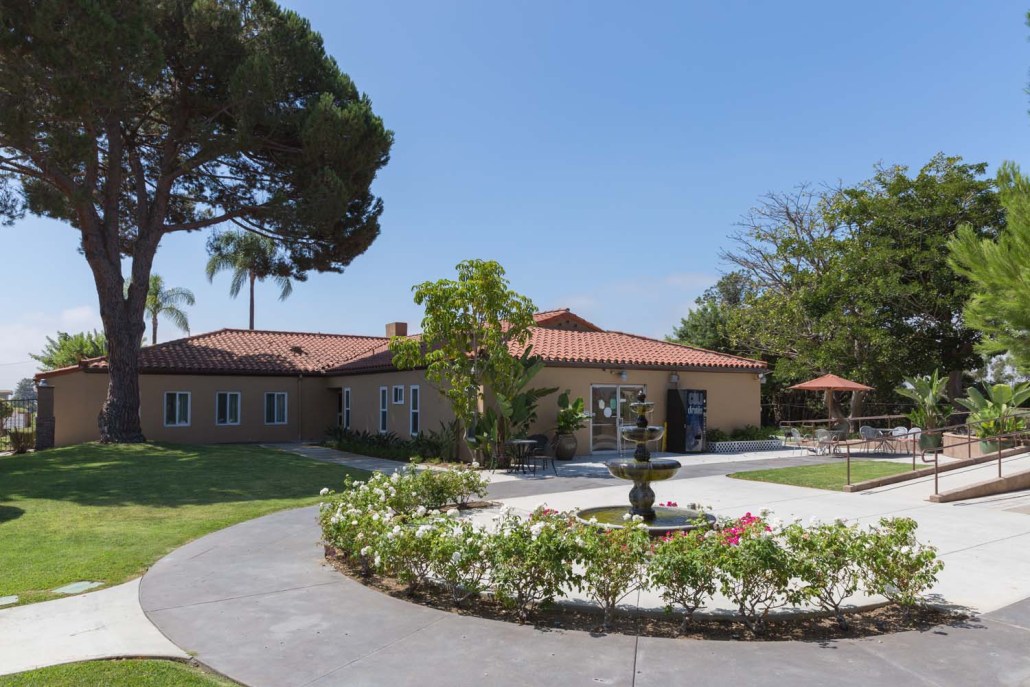
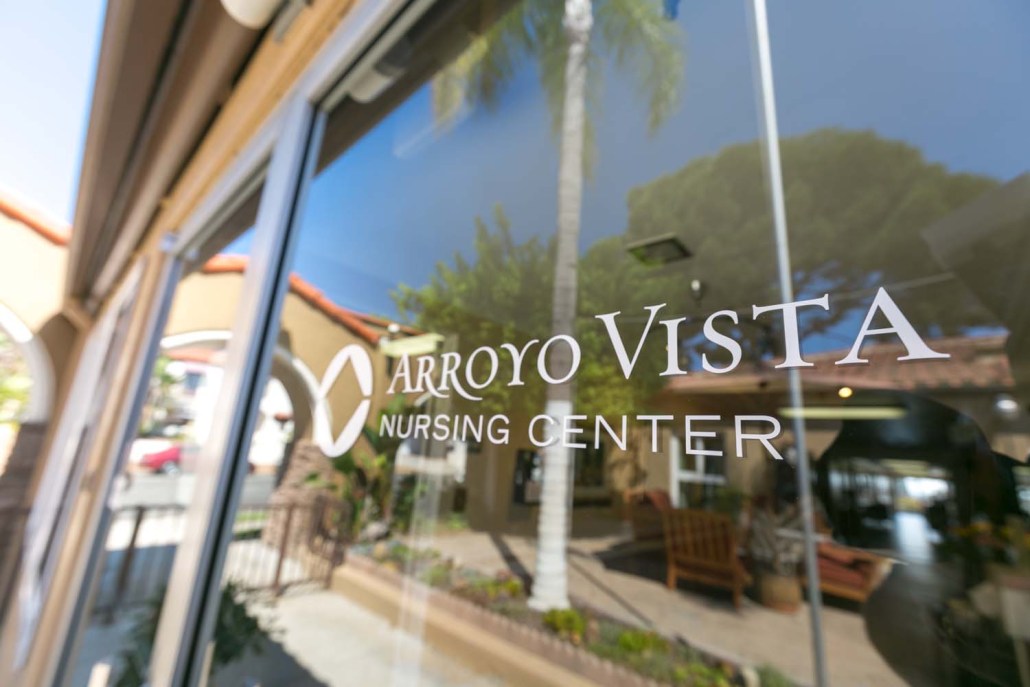
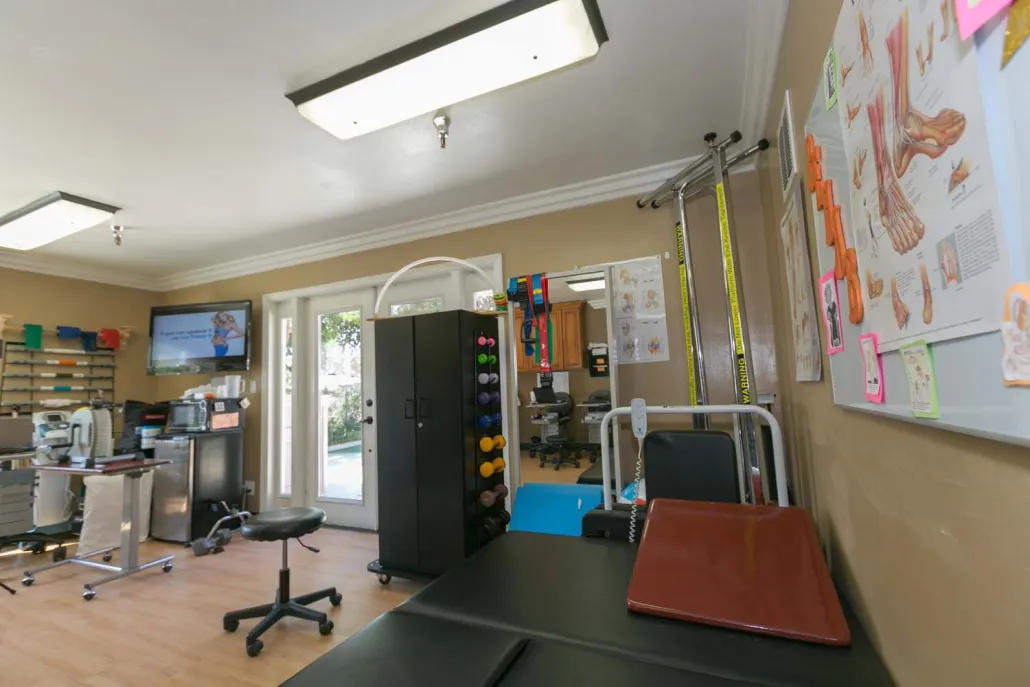
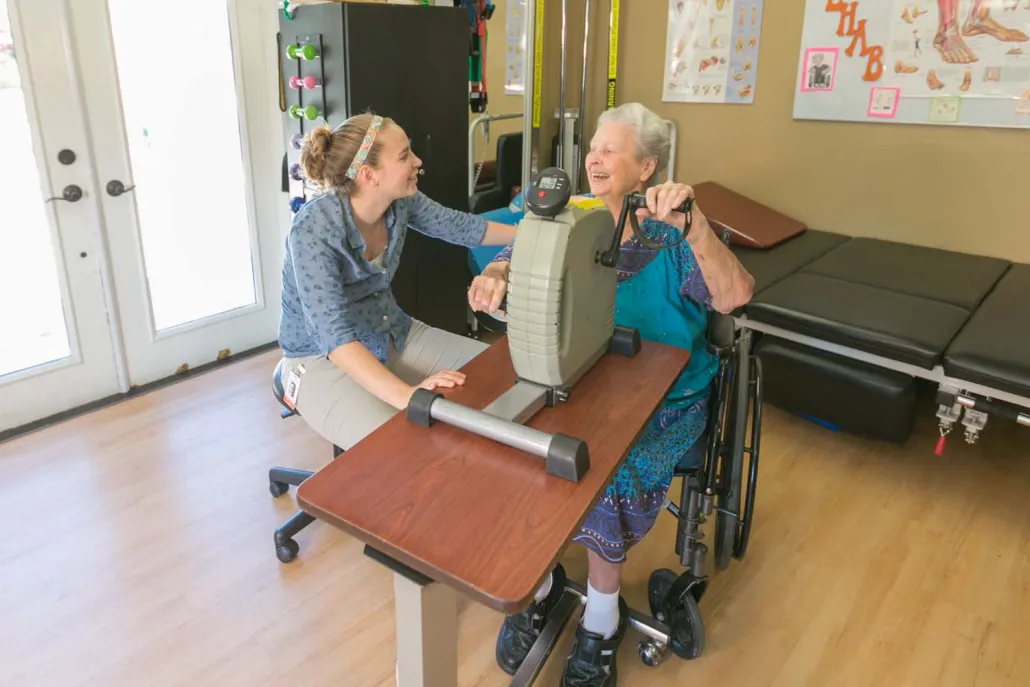
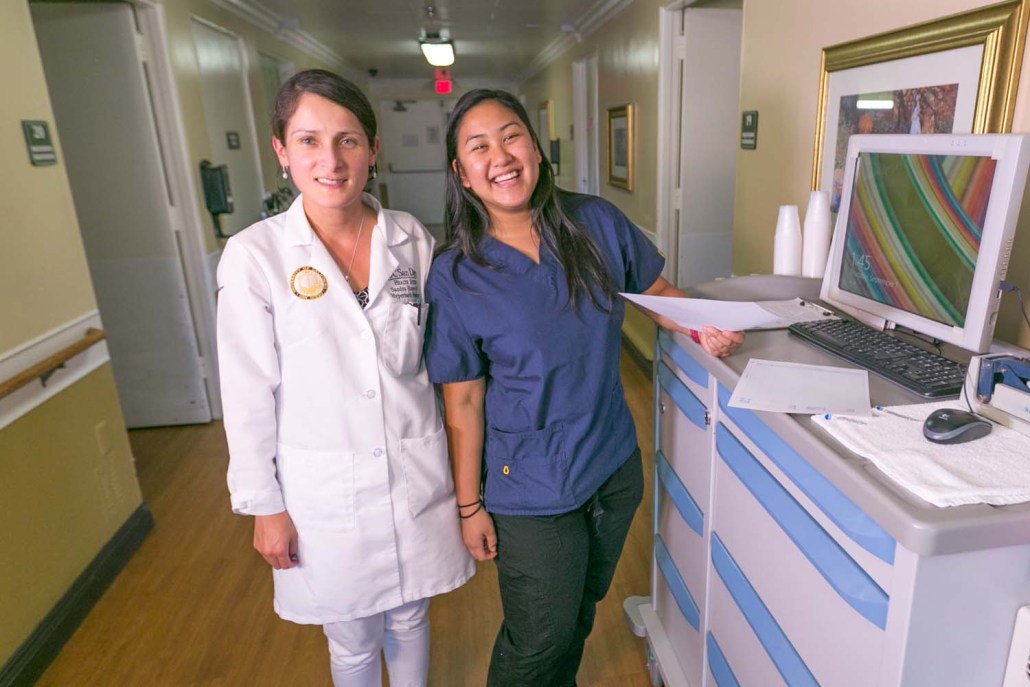
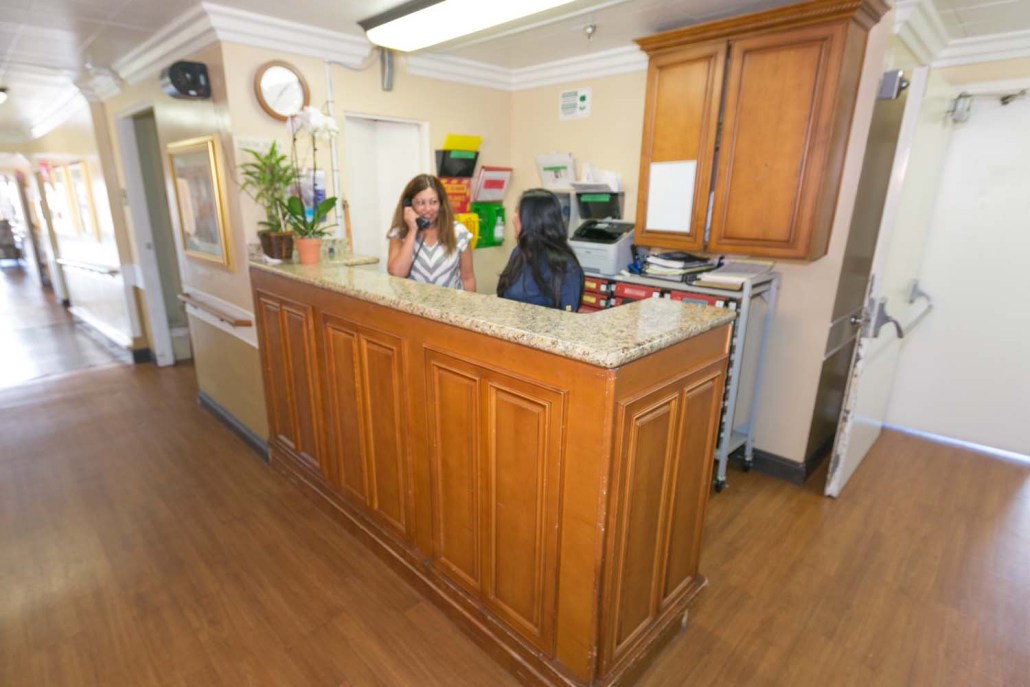
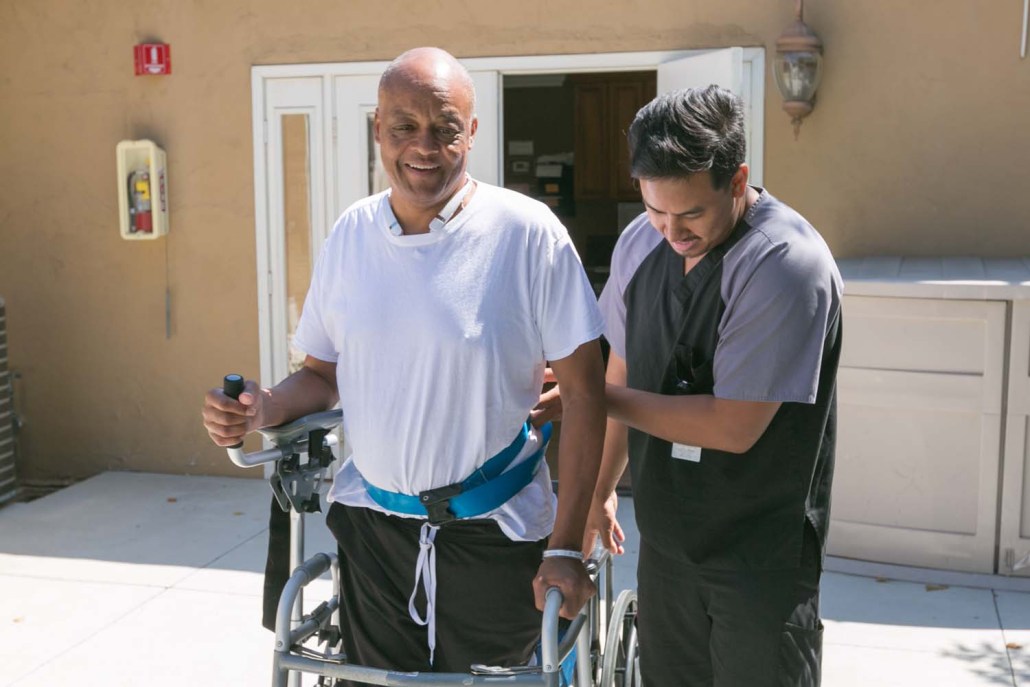
Arroyo Vista Nursing Center in San Diego, California is a welcoming and lively community that provides exceptional care to its residents. Cleanliness is a top priority at Arroyo Vista Nursing Center, as it plays a vital role in the residents’ overall health and well-being. The team includes physical therapists, occupational therapists, physical therapy assistants, speech pathologists, and other skilled professionals. Rehab therapists work on-site, allowing them to develop meaningful relationships with the residents. 
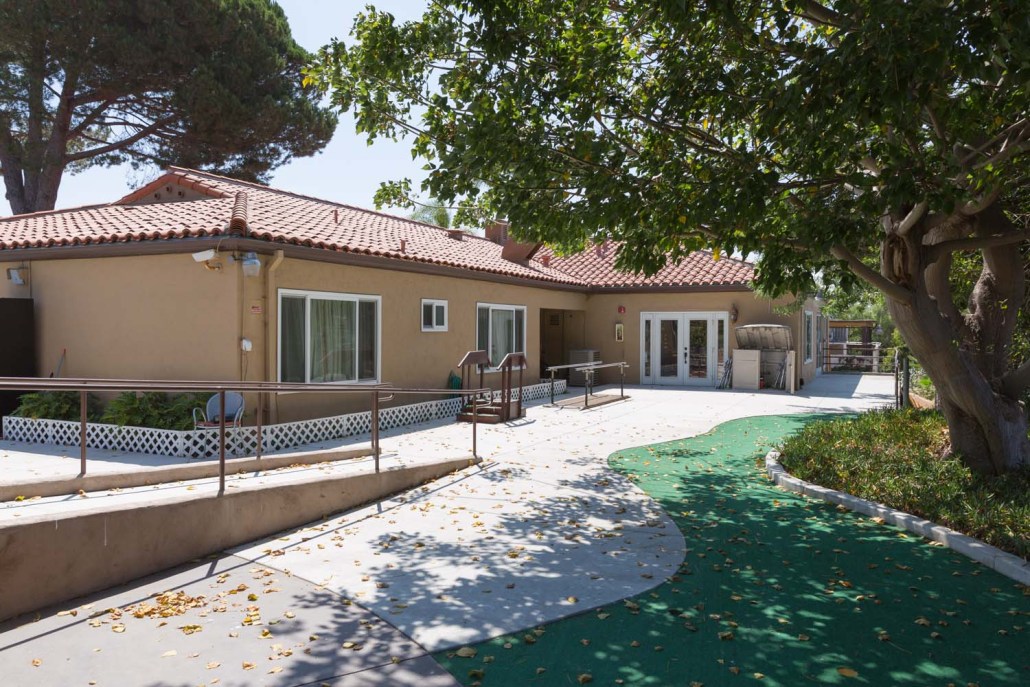
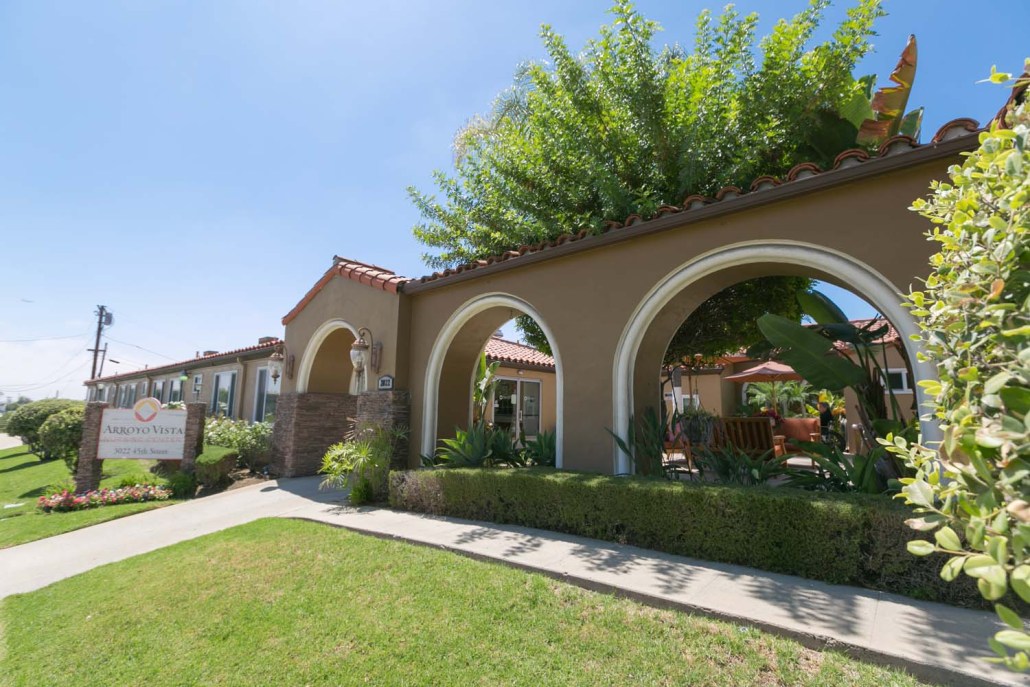
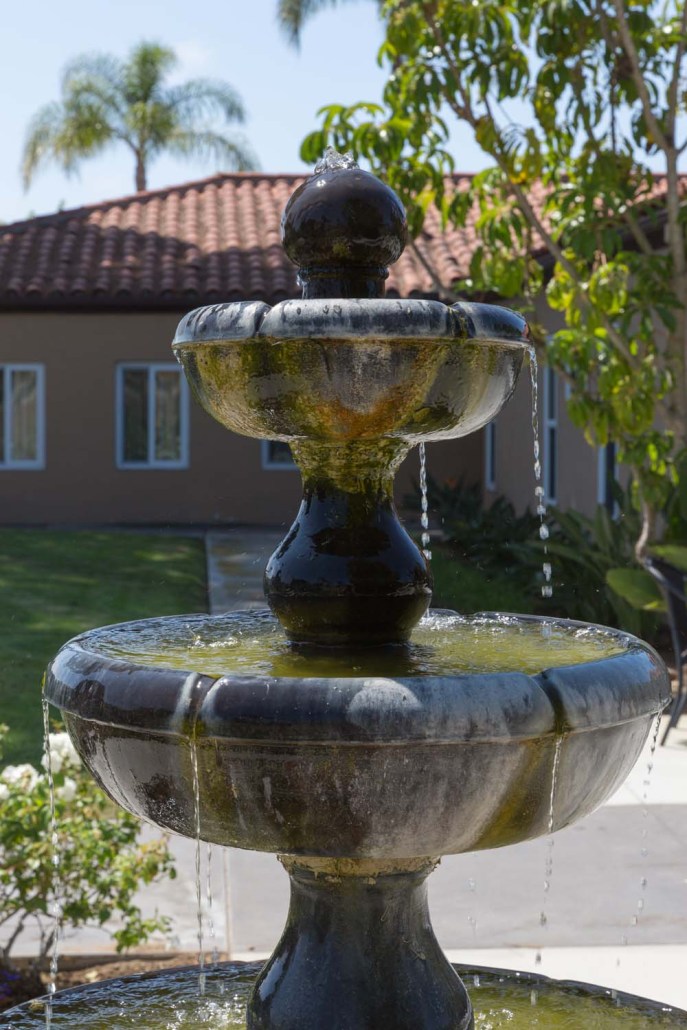
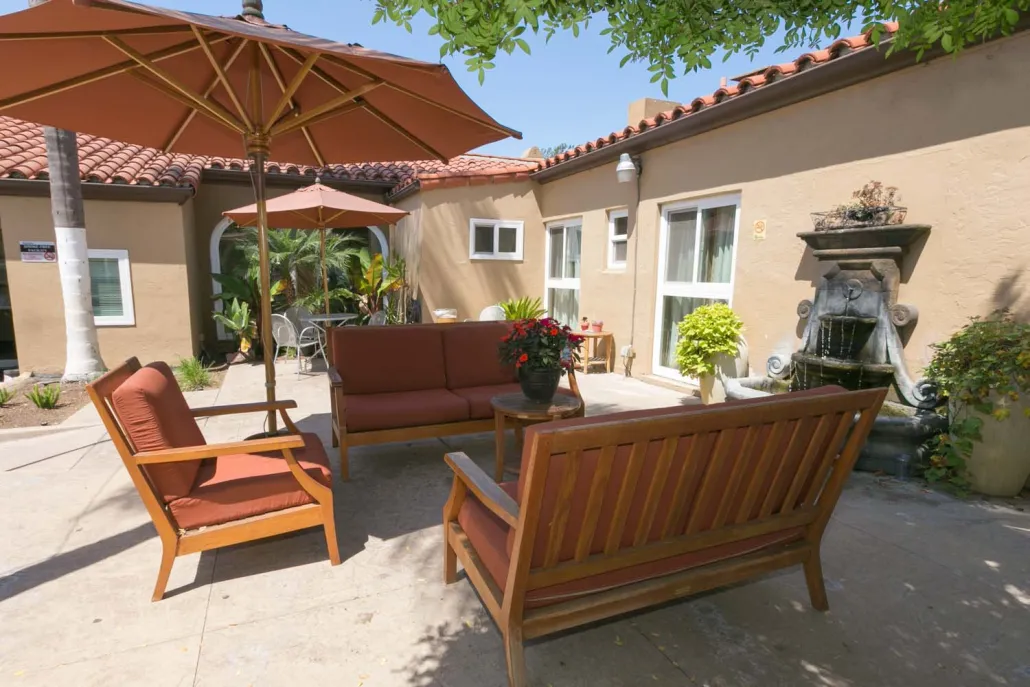
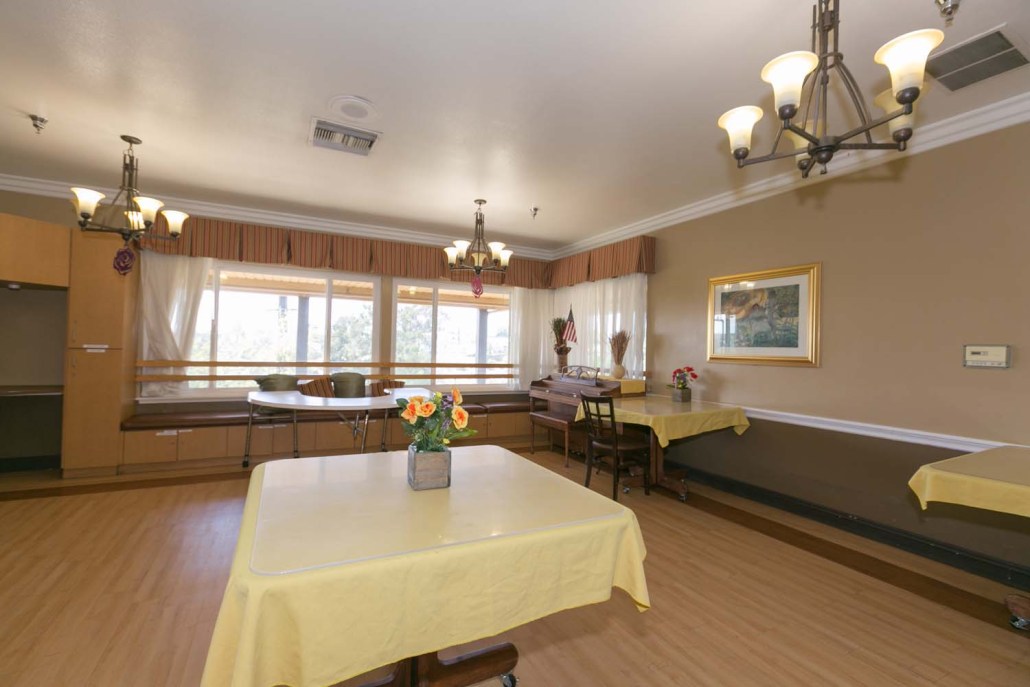
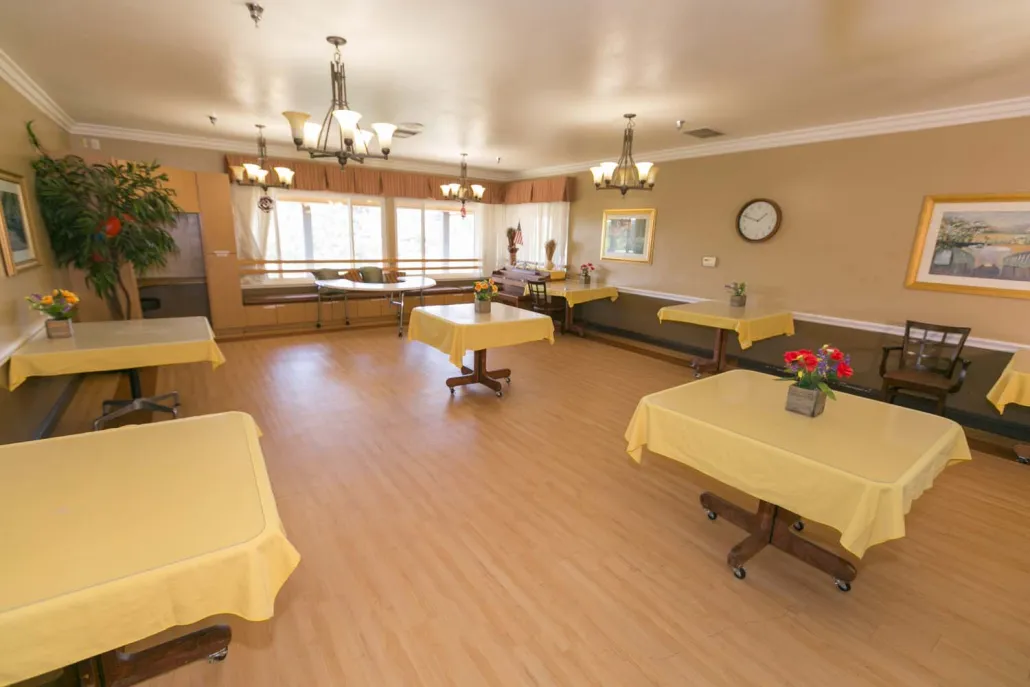
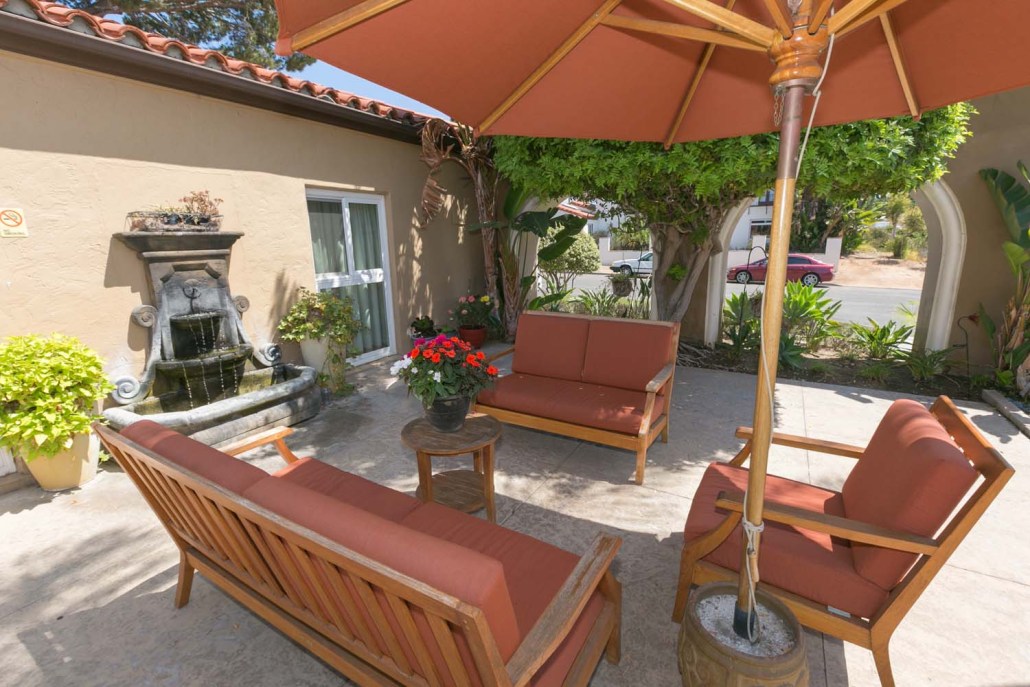
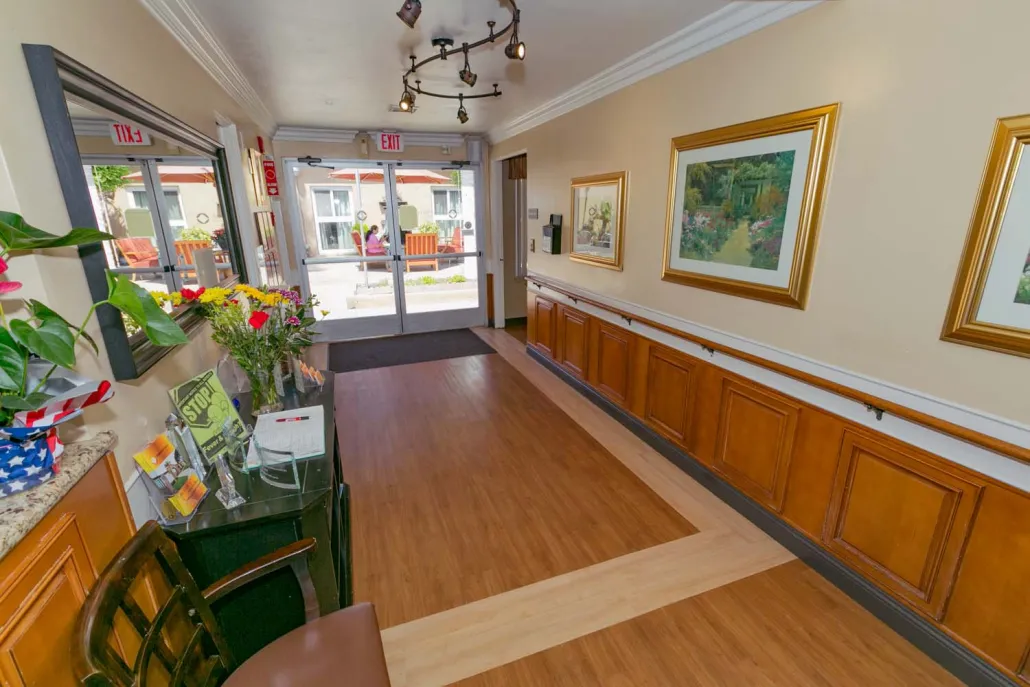
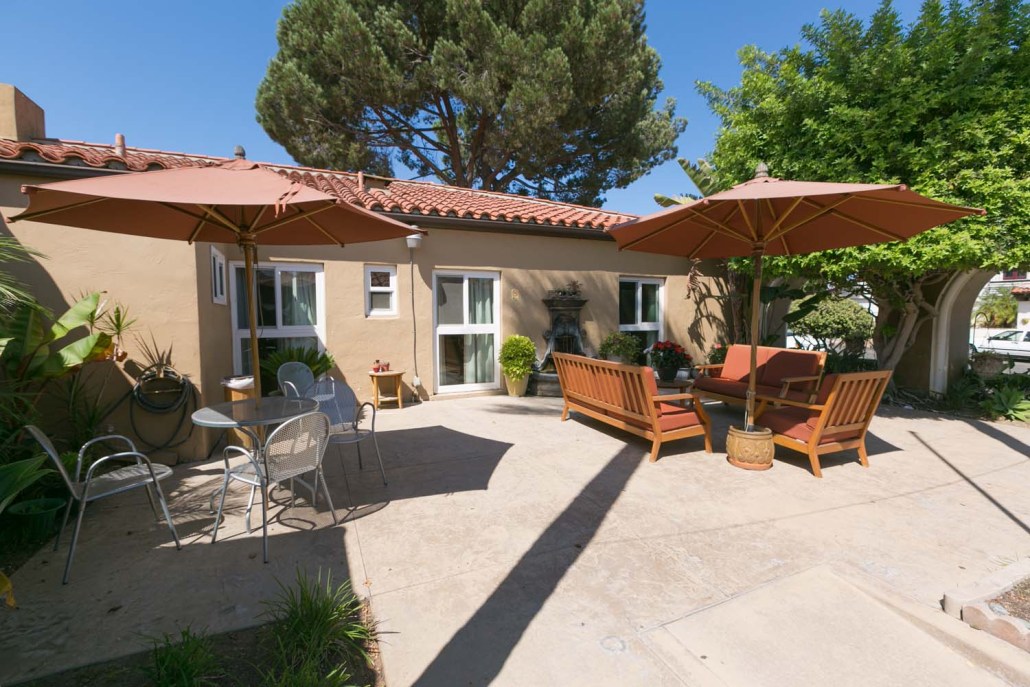
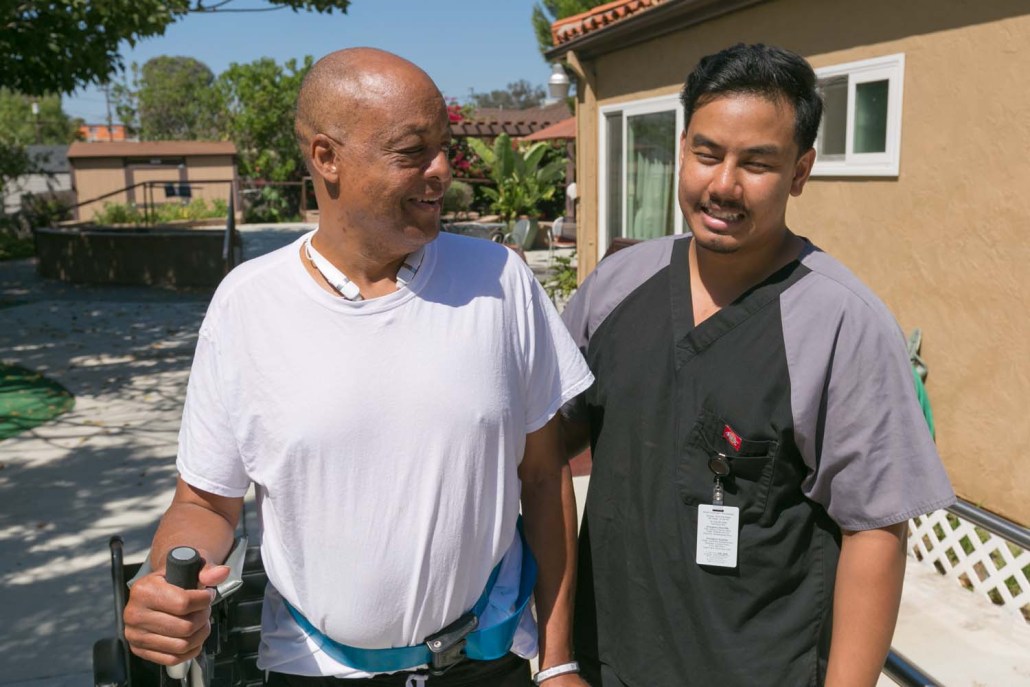
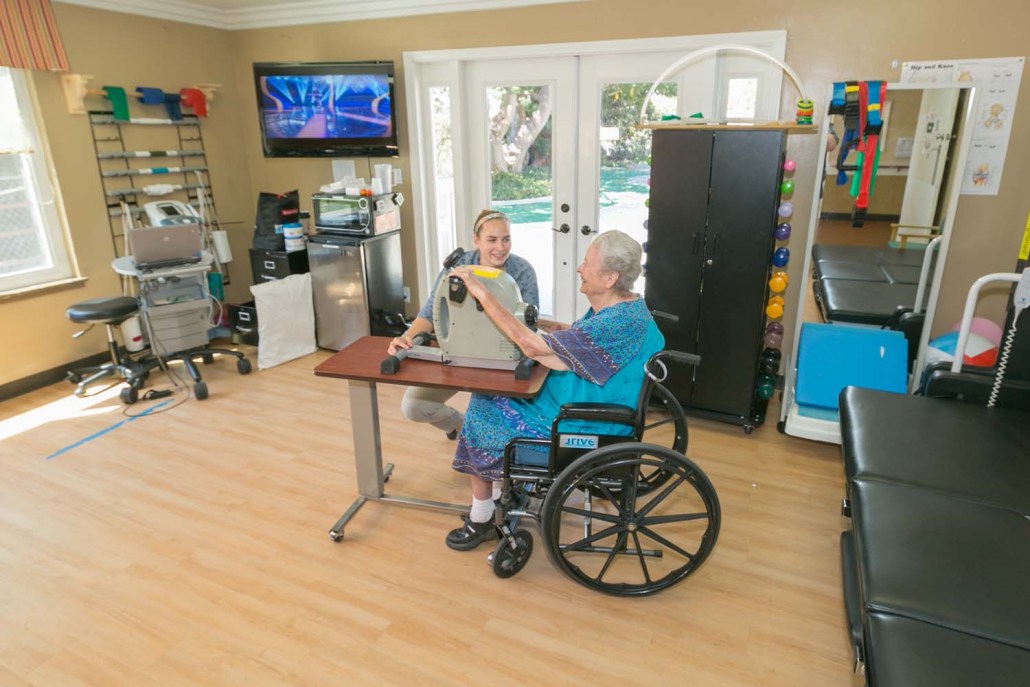
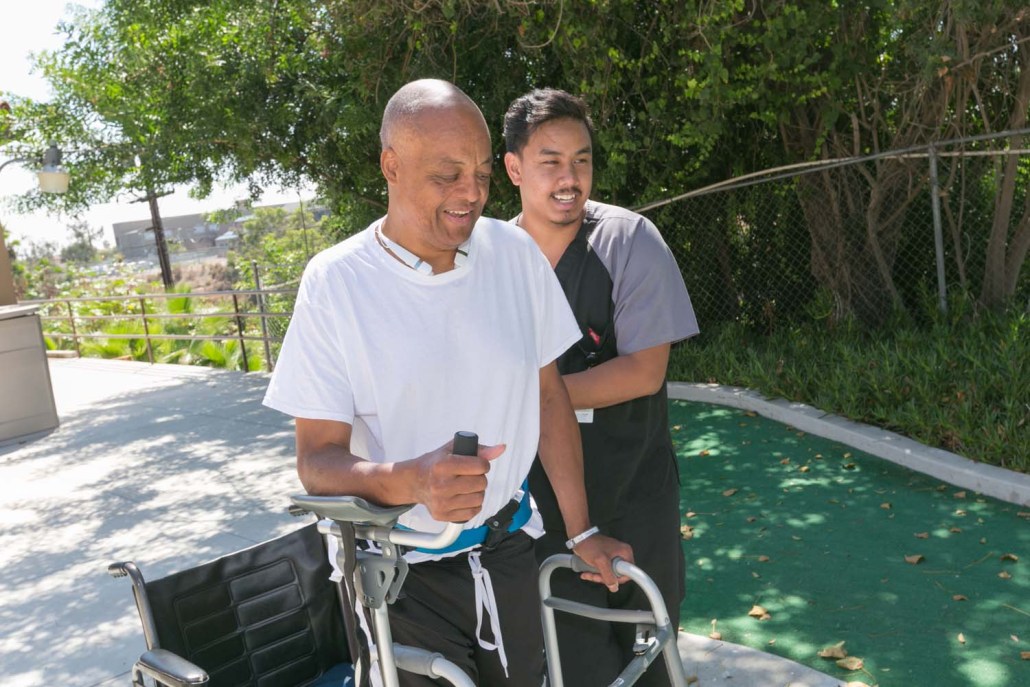
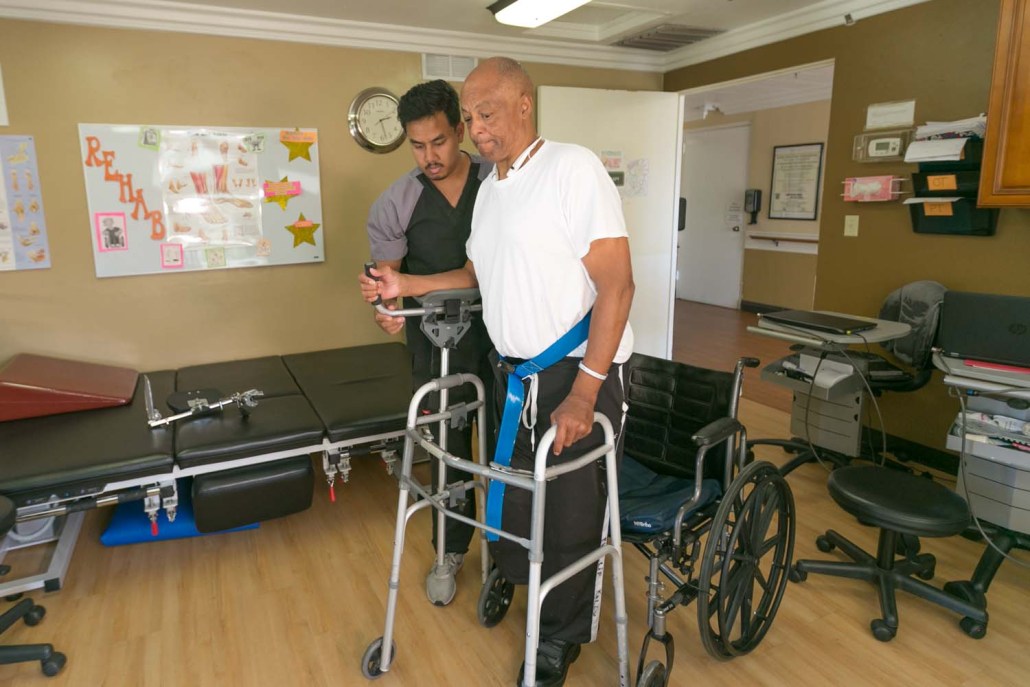
They feature a state-of-the-art therapy gym, where highly skilled therapists utilize both cutting-edge technology and hands-on techniques to ensure the best possible outcomes for the residents. The facility also boasts outdoor spaces, including a lovely patio area, that provides a serene and lush environment to relax and unwind. The dining room is filled with natural light and the interior is adorned with beautiful artwork, creating an ambiance of comfort and elegance.

(619) 283-5855

Quality ratings

Measured by Centers for Medicare & Medicaid Services (CMS)

Overall rating Info The Overall CMS Rating combines results from health inspections, staffing levels and quality measures. Health inspections carry the most weight. Staffing and quality scores can increase or decrease the final rating based on performance compared to state and national standards.
▲ 58.8% Above CA avg.
Health Inspection Info Based on the results of the facility's three most recent standard inspections and any complaint investigations. CMS reviews the number, scope, and severity of deficiencies, with more recent findings weighted more heavily.
▲ 43.0% Above CA avg.
Staffing Info Measures average nursing staff hours per resident per day, including Registered Nurses (RNs) and total nursing staff. Ratings are adjusted based on the level of care residents require and are compared to state and national benchmarks.
▼ 4.4% Below CA avg.
Quality Measures Info Based on clinical and physical health indicators reported to CMS, such as hospital readmissions, falls, pressure ulcers, and improvements in mobility. These measures reflect how well residents' health needs are being managed.
▲ 22.4% Above CA avg.

Staffing hours breakdown

Info Daily nursing hours per resident by staff type, reported to CMS. Higher is generally better — compare this facility to state and national averages to see where staffing stands.

Hours per resident per day — compared to California state averages

Total nursing care / resident Info This home is ranked 238th out of 271 homes in California.

Total adjusted nursing hours per resident per day, combining RN, LPN, and aide time. CMS adjusts this for case-mix so facilities can be fairly compared.
3h 23m per day
Rank #238 / 271Nurse hours — state benchmarkedThis home is ranked 238th out of 271 homes in California.Shows adjusted nurse hours per resident per day benchmarked to the California average, with a ranking across 271 California SNFs. More hours mean more direct care. The national average is about 3.5 hrs; below 3.0 is a red flag.
This facility California avg (4h 13m per day)
vs California avg
-20%

4 of 6 metrics below state avg

Standout metric Physical Therapist is +160% above state avg
Staff typeHours / dayvs state avg
Registered Nurse (RN) Info RNs hold the highest nursing license and can assess residents, interpret test results, and direct care plans. More RN hours per day often signals stronger clinical oversight and faster response to health changes. 34m per day ▼ 13% State avg: 39m per day · National avg: 41m per day
LPN / LVN Info Licensed Practical Nurses (LPNs) or Licensed Vocational Nurses (LVNs) deliver routine hands-on care — medication administration, wound dressing, and monitoring vital signs. They work under RN supervision and make up a large share of daily bedside care. 1h 5m per day ▼ 11% State avg: 1h 13m per day · National avg: 52m per day
Nurse Aide Info Certified Nurse Aides (CNAs) provide the most direct day-to-day assistance: bathing, dressing, feeding, and mobility. Nurse aide hours are typically the largest staffing category and directly affect residents' quality of life. 2h 30m per day ▼ 6% State avg: 2h 39m per day · National avg: 2h 21m per day
Total Nursing (Weekend) Info Combined nursing hours (RN + LPN + Nurse Aide) per resident per day on weekends. Staffing often drops on weekends — this figure reveals whether the facility maintains adequate coverage outside of weekday hours. 3h 49m per day ▼ 7% State avg: 4h 5m per day · National avg: 3h 26m per day
Physical Therapist Info Hours per resident per day provided by licensed Physical Therapists (PTs) or PT Assistants. PT services help residents recover mobility after injury or illness and are especially important for post-acute (short-stay) rehabilitation. 13m per day ▲ 160% State avg: 5m per day · National avg: 4m per day
RN (Weekend) Info Registered nurse hours specifically on weekends. Facilities sometimes reduce RN presence on Saturdays and Sundays — a low weekend RN figure compared to weekday hours can indicate reduced clinical oversight when most administrative staff are absent. 31m per day ▲ 3% State avg: 30m per day · National avg: 29m per day

Capacity and availability

This home usually has limited availability

Occupancy between 85% and 95% suggests balanced demand.

Higher occupancy than the California average: 84.7%
Occupancy rate 89.7% Rank #92 / 277Occupancy rate — state benchmarkedThis home is ranked 92nd out of 277 homes in California.Shows this facility's occupancy rate versus the California average, with its statewide rank out of 277. Higher occupancy signals strong local demand and financial stability.
Avg. Length of Stay 46 days
Occupancy rate
89.7% Rank #92 / 277Occupancy rate — state benchmarkedThis home is ranked 92nd out of 277 homes in California.Shows this facility's occupancy rate versus the California average, with its statewide rank out of 277. Higher occupancy signals strong local demand and financial stability.
Avg. Length of Stay
46 days

Who this home usually serves

TYPE OF STAY

Primarily short stays

Residents typically stay for brief periods, with frequent admissions and discharges throughout the year.

Breakdown by payment type

Medicare

37% of new residents, usually for short-term rehab.

Typical stay 1 - 2 months

Private pay

62% of new residents, often for short stays.

Typical stay 30 days

Medicaid

1% of new residents, often for long-term daily care.

Typical stay 3 - 4 years

Finances and operations

Privately-owned community
Operated by a business corporation.
Home revenue
$10.4M
Profit
$2.2M
Privately-owned community Operated by a business corporation.
Home revenue
$10.4M Rank #196 / 275Revenue — state benchmarkedThis home is ranked 196th out of 275 homes in California.Shows this facility's annual revenue compared to the California SNF average. Higher revenue generally means more resources for staffing and capital — read alongside Payroll %.
Profit
$2.2M
Payroll costs Info The portion of the home's budget spent on staff, including nurses, caregivers, and other employees who support care and operations. Rank #200 / 275Payroll — state benchmarkedThis home is ranked 200th out of 275 homes in California.Shows total annual staff payroll benchmarked to the California average. Higher payroll investment relative to peers often signals better staffing and less reliance on cheaper contract labor.
$5.6M
53.3% of revenue Rank #108 / 275Payroll % — state benchmarkedThis home is ranked 108th out of 275 homes in California.Shows payroll as a percentage of revenue versus the California average. Well-run SNFs often land around 55–65%. Below 25% may signal understaffing or heavy agency use — read with Staffing ratings.
Other operating costs Info All remaining costs needed to run the home, such as food, utilities, building maintenance, supplies and administrative expenses.
$2.6M
Total costs $8.2M
Walk Score
Walk Score: 49 / 100 Rank #175 / 229Walk Score — state benchmarkedThis home is ranked 175th out of 229 homes in California.Shows how walkable this facility's neighborhood is compared to the average Walk Score across California SNFs. Higher scores benefit residents, families, and staff.
Somewhat walkable. A few nearby services may be reachable on foot, but most trips require transportation.

About this community

Therapy & Rehabilitation

1 service
Rehabilitation Services

Amenities & Lifestyle

Specific ProgramsState-of-the-Art, At Your Service, Things To Do, Photos, Menu
Operating HoursVisits are available everyday from 8:30am-8:30pm.

Contact Arroyo Vista Nursing Center

Health Inspection History

Inspections
Total health inspections 6

California average 12.5


Last Health inspection on Apr 2025

Total health citations
25 Rank #64 / 275Health citations — state benchmarkedThis home is ranked 64th out of 275 homes in California.Shows this facility's total health deficiency citations benchmarked to the California state average, with a ranking across all 275 CA SNFs. Lower citation counts earn a better rank.

California average 50.2

Citations per inspection
4.17 Rank #136 / 275Citations per inspection — state benchmarkedThis home is ranked 136th out of 275 homes in California.Shows average deficiency citations per CMS inspection for this facility versus the California mean across 275 SNFs with citation data. Lower is better.

California average 4.65


Health citations are formal notices following inspections when they fail to comply with safety and care standards.

20 of 25 citations resulted from standard inspections; and 5 of 25 resulted from complaint investigations.

Breakdown of citation severity (last 7 years)
Critical Health citations More info
0
100% better than California average

California average: 0.4


Serious Health citations More info 0
100% better than California average

California average: 1

0 critical citations More info California average: 0.4

0 serious citations More info California average: 1

25 moderate citations More info California average: 47.2

0 minor citations More info California average: 1.5
Citations history (last 7 years)
Care Planning moderate citation Info Issues related to creating and updating personalized care plans for residents based on their needs and conditions. Apr 11, 2025
Corrected

Resident Rights moderate citation Info Issues related to resident's rights, including dignity, privacy, and the ability to make decisions about their care. Apr 11, 2025
Corrected

Resident Rights moderate citation Info Issues related to resident's rights, including dignity, privacy, and the ability to make decisions about their care. Apr 11, 2025
Corrected

Infection Control moderate citation Info Issues related to preventing and controlling infections, including hygiene practices and safety protocols. Oct 10, 2024
Corrected

Financial Assistance for
Nursing Home in California

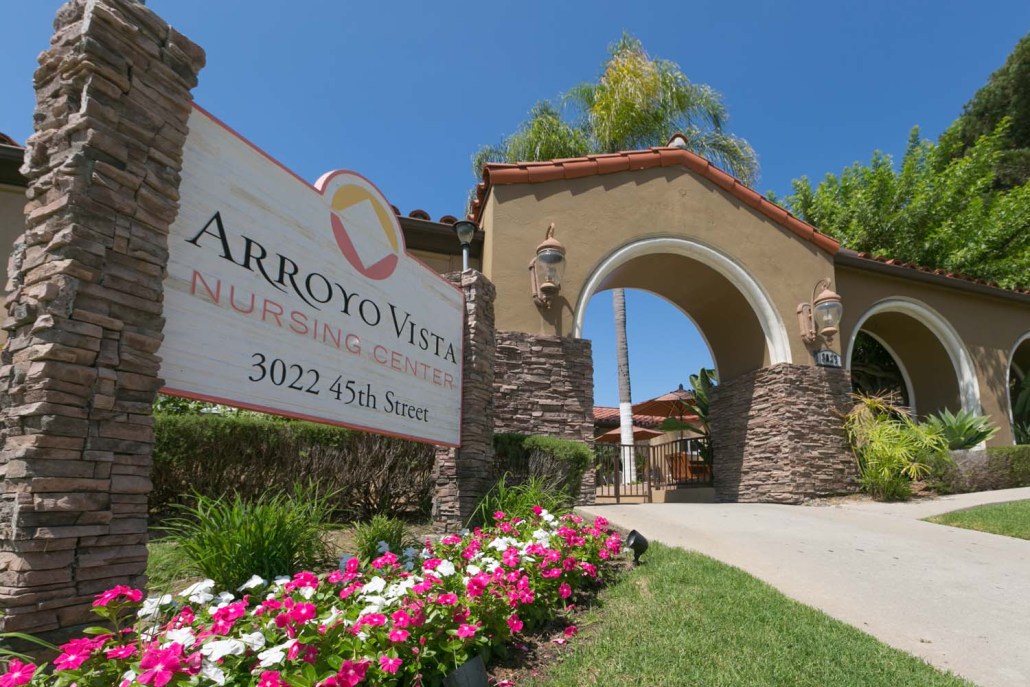
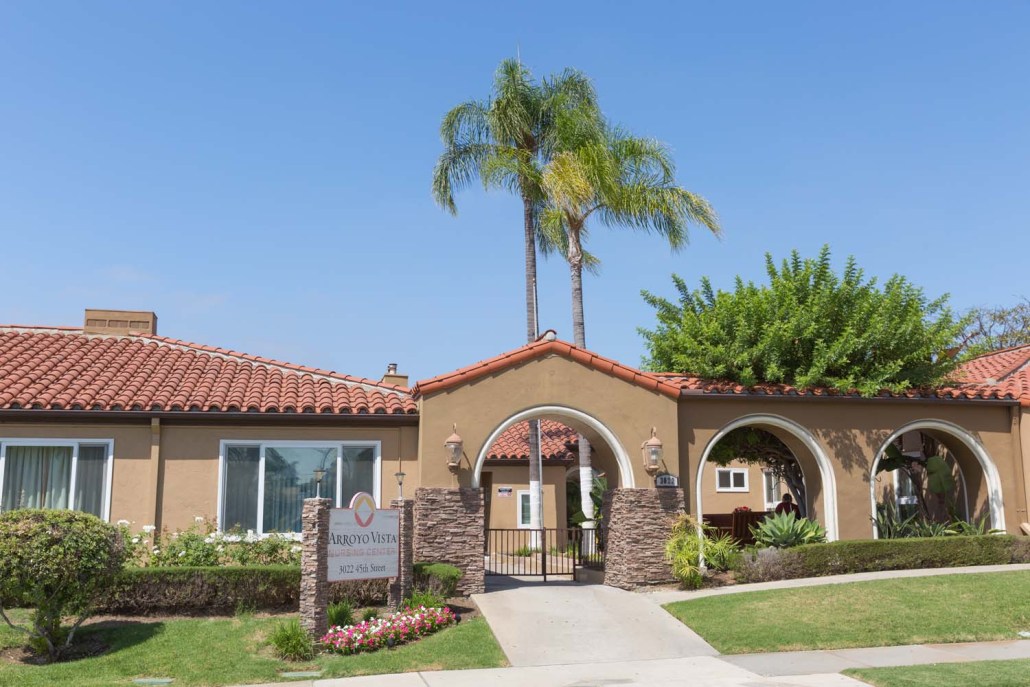
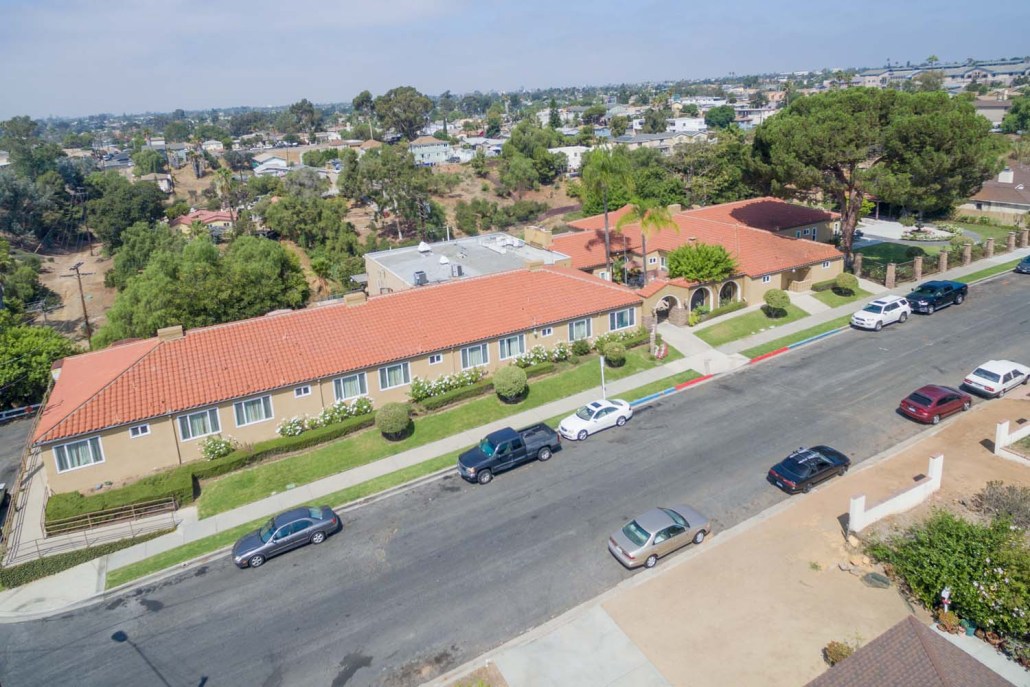
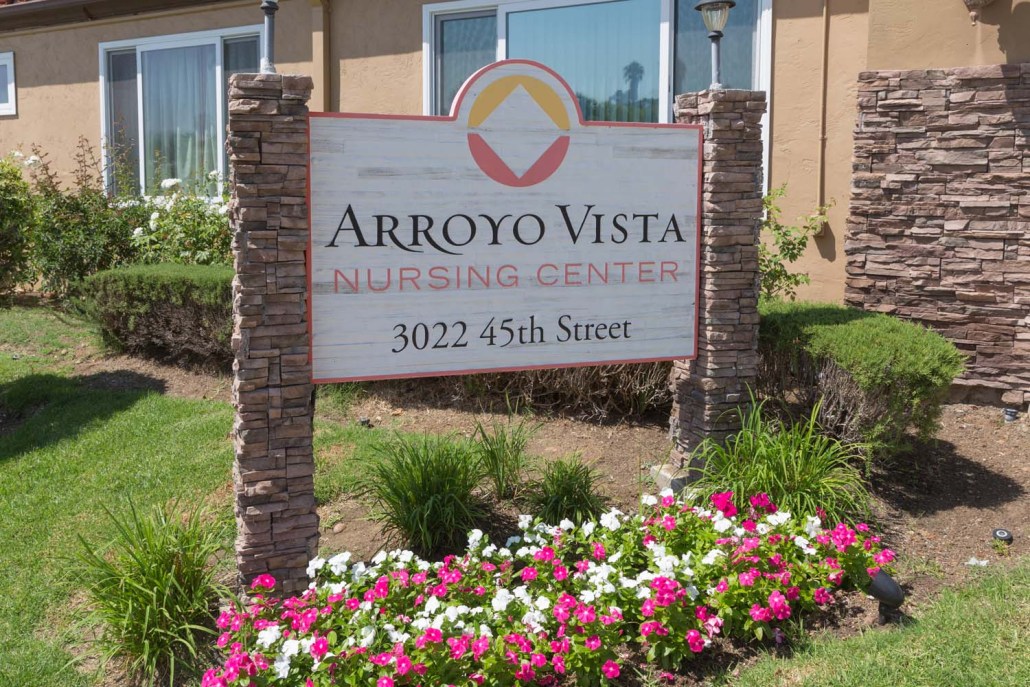
Arroyo Vista Nursing Center is located in San Diego, California.
Here are the financial assistance programs available to residents in California.

Get Financial aid guidance

Multipurpose Senior Services Program

MSSP (Medi-Cal Waiver)

Age 65+
General California resident, Medi-Cal eligible, nursing home risk.
Income Limits (2025) ~$2,829/month 300% FBR, individual
Asset Limits $2,000 (individual), $3,000 (couple).
CA

County-managed; waitlists possible.

Benefits
In-home support (4-6 hours/day) Respite care (14 days/year) Meals (~$6/meal) Transportation (8 trips/month) Care management

In-Home Supportive Services (IHSS)

California IHSS

Age 65+
General California resident, Medicaid-eligible or low-income.
Income Limits ~$1,732/month individual, Medi-Cal threshold
Asset Limits $2,000 individual
CA

Can hire family as caregivers.

Benefits
Personal care (up to 283 hours/month) Homemaker services Respite (varies)

Multipurpose Senior Services Program (MSSP)

CA MSSP

Age 65+
General California resident, Medi-Cal-eligible, nursing home-eligible but community-capable.
Income Limits ~$2,829/month 300% FBR, individual
Asset Limits $2,000 individual
CA

Available in 38 counties; waitlists common.

Benefits
Case management Respite care (up to 10 days/year) Minor home mods (avg. $500) Adult day care (~$50/day)

Property Tax Postponement Program (PTP)

CA PTP

Age 62+
General California resident, own and live in home, 40% equity.
Income Limits (2025) ~$51,500/year household, adjusted annually
Asset Limits Equity-based; no strict asset cap.
CA

Deferred taxes accrue interest (5% as of 2024); repaid upon sale/death.

Benefits
Property tax deferral (avg. $1,000-$3,000/year, varies by county)

Assisted Living Waiver (ALW)

CA ALW

Age 65+ or disabled
General California resident, Medi-Cal-eligible, nursing home-eligible.
Income Limits ~$2,829/month 300% FBR, individual
Asset Limits $2,000 individual
CA

Available in 15 counties (e.g., LA, Sacramento); waitlists common.

Benefits
Personal care in ALFs (5-7 hours/day) Medication management Social services

California CARES Program

CA CARES

Age
General Caregivers of California residents 60+ needing help with 3+ daily activities; no caregiver age limit.
Income Limits No strict limit; cost-sharing above ~$2,500/month threshold.
Asset Limits Not applicable; need-based.
CA

High demand in urban areas; complements IHSS respite.

Benefits
Respite care (up to 10 days/year) Counseling (4-6 sessions/year) Training (2-3 workshops/year) Supplies (~$200/year)

Low-Income Home Energy Assistance Program (LIHEAP)

CA LIHEAP

Age 60+ priority
General California resident, low-income, utility/heating need.
Income Limits (2025) ~$2,510/month 200% of poverty level, individual
Asset Limits Not applicable; income-focused.
CA

High demand in inland/coastal extremes; weatherization capped at $5,000/home.

Benefits
Utility payments (avg. $500-$1,000/year) Weatherization (e.g., insulation, avg. $1,000-$3,000 savings)

Places of interest near Arroyo Vista Nursing Center

Address 4.1 miles from city center Info Estimated distance in miles from San Diego's city center to Arroyo Vista Nursing Center's address, calculated via Google Maps. — 3.03 miles to nearest hospital (US Navy Med Center-Orthopedics)

Calculate Travel Distance to Arroyo Vista Nursing Center

Add your location

Address

Staffing Data (Q2 2025)

This data corresponds to Q2 2025 and is based on CMS Payroll-Based Journal.

Total staff 117
Employees 100
Contractors 17
Staff to resident ratio 2.21:1
2207447% better than California average

California average ratio: 0.00:1

Avg staff/day 37
Average shift 7.2 hours
6% worse than California average

California average: 7.7 hours

Total staff hours (quarter) 24,303
Nursing staff breakdown
Registered Nurse

Manages medical care and health needs.

Total count 9
Average shift length Info Average shift length. Calculated as total hours divided by days worked and average staff per day. 7.2 hours

No contractors work on this role.

Licensed Practical Nurse

Assists with medical care and medications.

Total count 21
Average shift length Info Average shift length. Calculated as total hours divided by days worked and average staff per day. 8 hours

This role is partially covered by contractors.

Certified Nursing Assistant

Helps with daily care and mobility.

Total count 47
Average shift length Info Average shift length. Calculated as total hours divided by days worked and average staff per day. 7.1 hours

This role is partially covered by contractors.

Contractor staffing

Total hours from contractors

1%

241 contractor hours this quarter

Licensed Practical Nurse: 10 Certified Nursing Assistant: 7
Staff by category
Certified Nursing Assistant407479,95391100%7.1
Licensed Practical Nurse1110214,10591100%8
Dental Services Staff6062,3338796%7.9
Registered Nurse9092,16591100%7.2
Respiratory Therapy Technician4048966673%7.3
Physical Therapy Aide5057818695%6
Nurse Practitioner1015837279%8.1
Physical Therapy Assistant4045387380%6.9
Speech Language Pathologist3035366774%7.1
Occupational Therapy Aide1015126470%8
Dietitian1014796369%7.6
Qualified Social Worker9094596571%5.3
Administrator1014325459%8
RN Director of Nursing1012513842%6.6
Nurse Aide in Training3032142730%6.9
Other Dietary Services Staff10167910%7.4
47 Certified Nursing Assistant
% of Days 100%
21 Licensed Practical Nurse
% of Days 100%
6 Dental Services Staff
% of Days 96%
9 Registered Nurse
% of Days 100%
4 Respiratory Therapy Technician
% of Days 73%
5 Physical Therapy Aide
% of Days 95%
1 Nurse Practitioner
% of Days 79%
4 Physical Therapy Assistant
% of Days 80%
3 Speech Language Pathologist
% of Days 74%
1 Occupational Therapy Aide
% of Days 70%
1 Dietitian
% of Days 69%
9 Qualified Social Worker
% of Days 71%
1 Administrator
% of Days 59%
1 RN Director of Nursing
% of Days 42%
3 Nurse Aide in Training
% of Days 30%
1 Other Dietary Services Staff
% of Days 10%

Facility Characteristics

Source: CMS Long-Term Care Facility Characteristics (Data as of Jan 2026)

Total residents 53
Medicare
53
100% of residents
Programs & Services
Residents Group

Residents meet regularly to discuss policies, care quality, and activities

Nurse Aide Training

State-approved Nurse Aide Training and Competency Evaluation Program on-site

Active Resident Council

Organized group of residents that meets regularly to discuss facility policies, quality of life, and activities.

Quality of care over time

These measures show how residents usually do over time at this home, based on health outcomes and preventive care.

High-risk clinical events score Info A composite score based on pressure ulcers, falls with injury, weight loss, walking ability decline, and activities of daily living decline. 3.2
52% better than California average

California average: 6.6

Functional decline score Info A composite score based on activities of daily living decline, walking ability decline, and incontinence. 5.6
51% better than California average

California average: 11.3

Long-stay resident measures
Significantly above average California avg: 4.2 Info CMS star rating based on long-stay quality measure performance. 5 stars = significantly above average, 1 star = significantly below average.
Need for Help with Daily Activities Increased Info Percent of long-stay residents whose need for help with daily activities has increased 3.0%
73% better than California average

California average: 11.1%

Walking Ability Worsened Info Percent of long-stay residents whose ability to move independently worsened 8.1%
32% better than California average

California average: 12.0%

Low Risk Residents with Bowel/Bladder Incontinence Info Percent of low risk long-stay residents who lose control of their bowels or bladder 5.6%
51% better than California average

California average: 11.3%

Falls with Major Injury Info Percent of long-stay residents experiencing one or more falls with major injury 0.0%
100% better than California average

California average: 1.7%

High Risk Residents with Pressure Ulcers Info Percent of long-stay high risk residents with pressure ulcers 4.9%
In line with California average

California average: 5.0%

Urinary Tract Infection Info Percent of long-stay residents with a urinary tract infection 0.0%
100% better than California average

California average: 1.2%

Lost Too Much Weight Info Percent of long-stay residents who lose too much weight 0.0%
100% better than California average

California average: 4.2%

Depressive Symptoms Info Percent of long-stay residents who have depressive symptoms 14.5%
116% worse than California average

California average: 6.7%

Antipsychotic Use Info Percent of long-stay residents who received an antipsychotic medication 0.0%
100% better than California average

California average: 10.1%

Pneumococcal Vaccine Info Percent of long-stay residents assessed and appropriately given the pneumococcal vaccine 100.0%
In line with California average

California average: 98.5%

Influenza Vaccine Info Percent of long-stay residents assessed and appropriately given the seasonal influenza vaccine 100.0%
In line with California average

California average: 98.2%

Short-stay resident measures
Above average California avg: 3.5 Info CMS star rating based on short-stay quality measure performance. 5 stars = much above average, 1 star = much below average.
Pneumococcal Vaccine Info Percent of short-stay residents assessed and appropriately given the pneumococcal vaccine 100.0%
6% better than California average

California average: 94.0%

Antipsychotic medication increase Info Percent of short-stay residents who newly received an antipsychotic medication 1.0%
34% better than California average

California average: 1.5%

Influenza Vaccine Info Percent of short-stay residents assessed and appropriately given the seasonal influenza vaccine 98.8%
6% better than California average

California average: 93.2%

Re-hospitalized after SNF stay Info Percentage of short-stay residents who were re-hospitalized after their nursing home admission. 20.3%
13% better than California average

California average: 23.2%

Emergency department visits Info Percentage of short-stay residents who had an outpatient emergency department visit. 17.7%
58% worse than California average

California average: 11.2%

Falls with major injury Info Percentage of SNF residents who experience falls with major injury during their stay. 0.0%
100% better than California average

California average: 0.8%

Ability to care for self at discharge Info Percentage of residents at or above expected ability to care for themselves at discharge. 65.6%
22% better than California average

California average: 53.7%

Successful return to home or community Info Rate of successful return to home or community from a skilled nursing facility. 70.8%
40% better than California average

California average: 50.6%

Penalties and fines

Federal penalties imposed by CMS for regulatory violations, including civil money penalties (fines) and denials of payment for new Medicare/Medicaid admissions.

Source: CMS Penalties Database

No penalties in the past 3 years

No civil money penalties or payment denials were reported in the last 3 years.

Compare Nursing Home around San Diego The information below is reported by the California Department of Social Services and Department of Public Health.

5 facilities compared · CMS & CA Dept. of Health data · Updated May 2026

Filter by care type
Ridgeview Health Center
NH

Nursing Home Licensed facility providing 24/7 skilled nursing care for residents with complex, ongoing medical needs. Staffed by RNs, LPNs, and CNAs. Inspected and star-rated annually by CMS. Accepts Medicare (short-term rehab) and Medicaid (long-term care).

AL

Assisted Living A licensed, long-term care setting for seniors or individuals with disabilities who need help with daily activities — like bathing, dressing, and medication management — but not 24-hour skilled nursing. Offers housing, meals, and around-the-clock support while aiming to maximize resident independence.

San Diego (Scripps Ranch)68 85.3% +1%5.54 -3%+31%6172.8-25- 11 Crestview Hc Llc$8.4M$4.1M48.8%555928
Arroyo Vista Nursing Center
NH

Nursing Home Licensed facility providing 24/7 skilled nursing care for residents with complex, ongoing medical needs. Staffed by RNs, LPNs, and CNAs. Inspected and star-rated annually by CMS. Accepts Medicare (short-term rehab) and Medicaid (long-term care).

AL

Assisted Living A licensed, long-term care setting for seniors or individuals with disabilities who need help with daily activities — like bathing, dressing, and medication management — but not 24-hour skilled nursing. Offers housing, meals, and around-the-clock support while aiming to maximize resident independence.

San Diego (City Heights)53 89.7% +6%3.39 -10%-20%0254.2-47- 49 Moore, Ome$10.4M$4.7M45.2%55505
The Springs of Pacific Regent
NH

Nursing Home Licensed facility providing 24/7 skilled nursing care for residents with complex, ongoing medical needs. Staffed by RNs, LPNs, and CNAs. Inspected and star-rated annually by CMS. Accepts Medicare (short-term rehab) and Medicaid (long-term care).

AL

Assisted Living A licensed, long-term care setting for seniors or individuals with disabilities who need help with daily activities — like bathing, dressing, and medication management — but not 24-hour skilled nursing. Offers housing, meals, and around-the-clock support while aiming to maximize resident independence.

San Diego (University City)58 96.8% +14%3.58 -4%-15%0262.2-57A+ 69 Stevenson, Matthew$19.4M$7.2M37.2%555739
Jacob Health Care Center
NH

Nursing Home Licensed facility providing 24/7 skilled nursing care for residents with complex, ongoing medical needs. Staffed by RNs, LPNs, and CNAs. Inspected and star-rated annually by CMS. Accepts Medicare (short-term rehab) and Medicaid (long-term care).

AL

Assisted Living A licensed, long-term care setting for seniors or individuals with disabilities who need help with daily activities — like bathing, dressing, and medication management — but not 24-hour skilled nursing. Offers housing, meals, and around-the-clock support while aiming to maximize resident independence.

San Diego (City Heights)40 89.5% +6%3.29 +54%-22%0305.0-118A+ 49 -$15.0M$8.3M55.5%55508
Cloisters of the Valley, LLC -
NH

Nursing Home Licensed facility providing 24/7 skilled nursing care for residents with complex, ongoing medical needs. Staffed by RNs, LPNs, and CNAs. Inspected and star-rated annually by CMS. Accepts Medicare (short-term rehab) and Medicaid (long-term care).

AL

Assisted Living A licensed, long-term care setting for seniors or individuals with disabilities who need help with daily activities — like bathing, dressing, and medication management — but not 24-hour skilled nursing. Offers housing, meals, and around-the-clock support while aiming to maximize resident independence.

San Diego (Mission Valley)70--------0----- 71 -----

Guides for Better Senior Living

Care Cost Calculator: See Prices in Your Area

Nursing Home Data Explorer

Don’t Wait Too Long: 7 Red Flag Signs Your Parent Needs Assisted Living Now

The True Cost of Assisted Living in 2025 – And How Families Are Paying For It

Understanding Senior Living Costs: Pricing Models, Discounts & Financial Assistance

Frequently Asked Questions about Arroyo Vista Nursing Center

What neighborhood is Arroyo Vista Nursing Center in?

Arroyo Vista Nursing Center is in the City Heights neighborhood.

Is Arroyo Vista Nursing Center in a walkable area?

Arroyo Vista Nursing Center has a walk score of 49. Somewhat walkable. A few nearby services may be reachable on foot, but most trips require transportation.

Are there photos of Arroyo Vista Nursing Center?

Yes — there are 23 photos of Arroyo Vista Nursing Center in the photo gallery on this page.

What is the phone number of Arroyo Vista Nursing Center?

(619) 283-5855 will put you in contact with the team at Arroyo Vista Nursing Center.

Is Arroyo Vista Nursing Center Medicare or Medicaid certified?

Yes — Arroyo Vista Nursing Center is a CMS-certified provider of Medicare and Medicaid.

Explore Open Rooms
1 Contact details
2 What type of senior care service are you looking for?
3 What budget do you have in mind for senior care?
4 How soon do you need to find care?
5 Additional details

Thank you for your interest!

Our team will be in touch shortly to help with next steps.