The Springs of Pacific Regent

Nursing Home · San Diego, CA
CMS overall rating Info The Overall CMS Rating is scored from 1 to 5 stars and combines results from health inspections, staffing levels, and quality measures. Health inspections carry the most weight. Staffing and quality scores can increase or decrease the final rating based on performance compared to state and national standards.
The Springs of Pacific Regent
Nursing Home · San Diego, CA
CMS overall rating Info The Overall CMS Rating is scored from 1 to 5 stars and combines results from health inspections, staffing levels, and quality measures. Health inspections carry the most weight. Staffing and quality scores can increase or decrease the final rating based on performance compared to state and national standards.
Calculator: See prices in your area
The Springs of Pacific Regent accepts Medicare and private pay.

Overview of The Springs of Pacific Regent

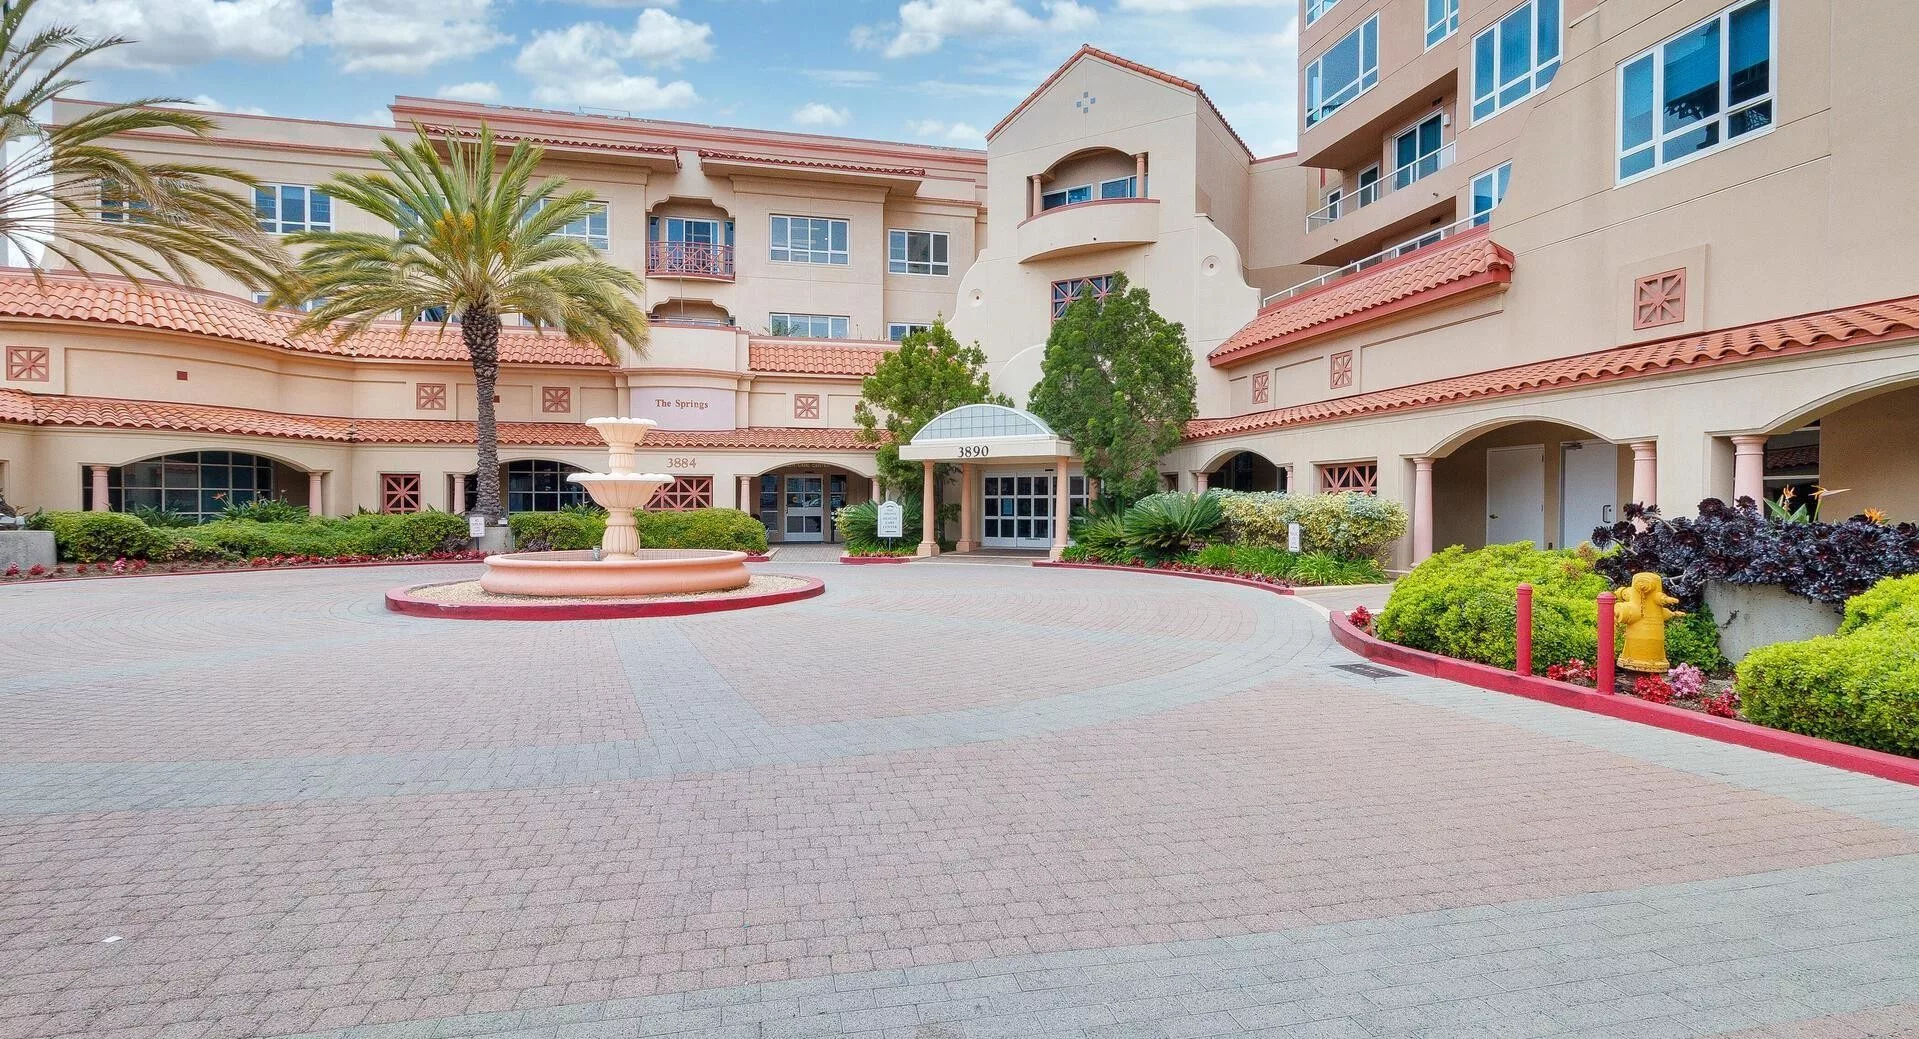
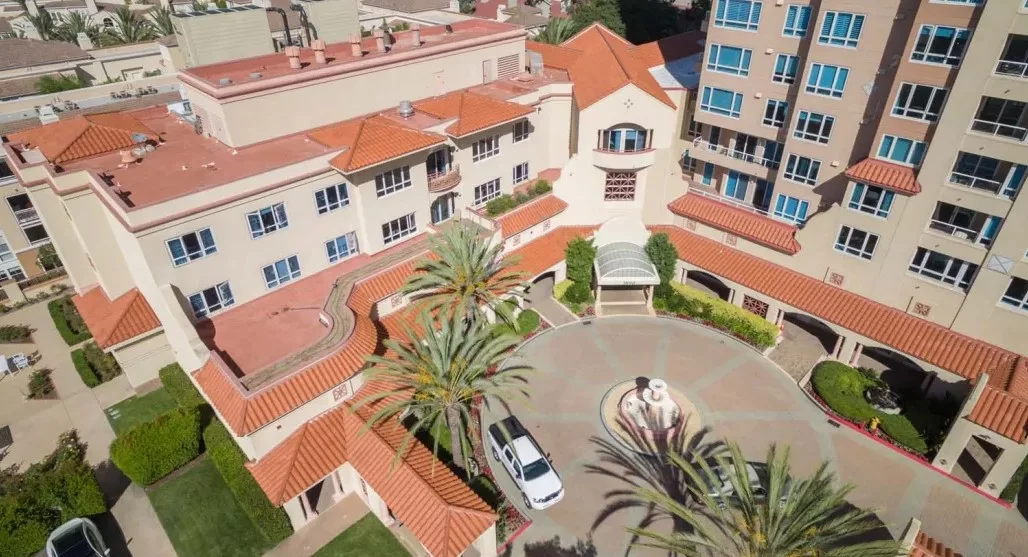
The Springs of Pacific Regent is a renowned health care center in San Diego that’s well-known for its advanced technology and customized therapy programs. The community’s focus is on providing its residents with the utmost comfort, safety, and therapy. The atmosphere of the community is bright and airy, with comfortable furnishings and beautiful artwork hanging on the walls. Each home is equipped with a flat-screen TV and telephone, which allows residents to stay in touch with their loved ones.
They firmly believe in keeping their residents entertained and engaged, which is why they offer a full calendar of activities, including arts and crafts classes, social events, live music shows, and cooking classes. Additionally, The Springs of Pacific Regent offers excursions and church services to those who seek spiritual fulfillment in their daily lives. The Springs of Pacific Regent ensures that their residents are never bored by providing them with the opportunity to enjoy life with a greater sense of freedom and self-expression.

(425) 643-9933

Quality ratings

Measured by Centers for Medicare & Medicaid Services (CMS)

Overall rating Info The Overall CMS Rating combines results from health inspections, staffing levels and quality measures. Health inspections carry the most weight. Staffing and quality scores can increase or decrease the final rating based on performance compared to state and national standards.
▲ 38.9% Above CA avg.
Health Inspection Info Based on the results of the facility's three most recent standard inspections and any complaint investigations. CMS reviews the number, scope, and severity of deficiencies, with more recent findings weighted more heavily.
▲ 27.0% Above CA avg.
Staffing Info Measures average nursing staff hours per resident per day, including Registered Nurses (RNs) and total nursing staff. Ratings are adjusted based on the level of care residents require and are compared to state and national benchmarks.
▼ 42.0% Below CA avg.
Quality Measures Info Based on clinical and physical health indicators reported to CMS, such as hospital readmissions, falls, pressure ulcers, and improvements in mobility. These measures reflect how well residents' health needs are being managed.
▲ 17.4% Above CA avg.

Staffing hours breakdown

Info Daily nursing hours per resident by staff type, reported to CMS. Higher is generally better — compare this facility to state and national averages to see where staffing stands.

Hours per resident per day — compared to California state averages

Total nursing care / resident Info This home is ranked 207th out of 271 homes in California.

Total adjusted nursing hours per resident per day, combining RN, LPN, and aide time. CMS adjusts this for case-mix so facilities can be fairly compared.
3h 35m per day
Rank #207 / 271Nurse hours — state benchmarkedThis home is ranked 207th out of 271 homes in California.Shows adjusted nurse hours per resident per day benchmarked to the California average, with a ranking across 271 California SNFs. More hours mean more direct care. The national average is about 3.5 hrs; below 3.0 is a red flag.
This facility California avg (4h 23m per day)
vs California avg
-18%

2 of 6 metrics below state avg

Standout metric Physical Therapist is +480% above state avg
Staff typeHours / dayvs state avg
Registered Nurse (RN) Info RNs hold the highest nursing license and can assess residents, interpret test results, and direct care plans. More RN hours per day often signals stronger clinical oversight and faster response to health changes. 44m per day ▲ 13% State avg: 39m per day · National avg: 41m per day
LPN / LVN Info Licensed Practical Nurses (LPNs) or Licensed Vocational Nurses (LVNs) deliver routine hands-on care — medication administration, wound dressing, and monitoring vital signs. They work under RN supervision and make up a large share of daily bedside care. 2h 0m per day ▲ 64% State avg: 1h 13m per day · National avg: 52m per day
Nurse Aide Info Certified Nurse Aides (CNAs) provide the most direct day-to-day assistance: bathing, dressing, feeding, and mobility. Nurse aide hours are typically the largest staffing category and directly affect residents' quality of life. 2h 33m per day ▼ 4% State avg: 2h 39m per day · National avg: 2h 21m per day
Total Nursing (Weekend) Info Combined nursing hours (RN + LPN + Nurse Aide) per resident per day on weekends. Staffing often drops on weekends — this figure reveals whether the facility maintains adequate coverage outside of weekday hours. 4h 0m per day ■ Avg State avg: 4h 5m per day · National avg: 3h 26m per day
Physical Therapist Info Hours per resident per day provided by licensed Physical Therapists (PTs) or PT Assistants. PT services help residents recover mobility after injury or illness and are especially important for post-acute (short-stay) rehabilitation. 29m per day ▲ 480% State avg: 5m per day · National avg: 4m per day
RN (Weekend) Info Registered nurse hours specifically on weekends. Facilities sometimes reduce RN presence on Saturdays and Sundays — a low weekend RN figure compared to weekday hours can indicate reduced clinical oversight when most administrative staff are absent. 24m per day ▼ 20% State avg: 30m per day · National avg: 29m per day

Capacity and availability

This home is often near full

Occupancy higher than 95% suggests steady demand, but availability may be limited.

Higher occupancy than the California average: 84.7%
Occupancy rate 96.8% Rank #19 / 277Occupancy rate — state benchmarkedThis home is ranked 19th out of 277 homes in California.Shows this facility's occupancy rate versus the California average, with its statewide rank out of 277. Higher occupancy signals strong local demand and financial stability.
Avg. Length of Stay 25 days
Occupancy rate
96.8% Rank #19 / 277Occupancy rate — state benchmarkedThis home is ranked 19th out of 277 homes in California.Shows this facility's occupancy rate versus the California average, with its statewide rank out of 277. Higher occupancy signals strong local demand and financial stability.
Avg. Length of Stay
25 days

Who this home usually serves

TYPE OF STAY

Mostly short-term rehab stays

Most residents typically stay for a few weeks or months before returning home or moving on.

Breakdown by payment type

Medicare

68% of new residents, usually for short-term rehab.

Typical stay 23 days

Private pay

32% of new residents, often for short stays.

Typical stay 24 days

Finances and operations

Privately-owned community
Operated by a business corporation.
Home revenue
$19.4M
Profit
$1.8M
Privately-owned community Operated by a business corporation.
Home revenue
$19.4M Rank #86 / 275Revenue — state benchmarkedThis home is ranked 86th out of 275 homes in California.Shows this facility's annual revenue compared to the California SNF average. Higher revenue generally means more resources for staffing and capital — read alongside Payroll %.
Profit
$1.8M
Payroll costs Info The portion of the home's budget spent on staff, including nurses, caregivers, and other employees who support care and operations. Rank #126 / 275Payroll — state benchmarkedThis home is ranked 126th out of 275 homes in California.Shows total annual staff payroll benchmarked to the California average. Higher payroll investment relative to peers often signals better staffing and less reliance on cheaper contract labor.
$8.3M
43.1% of revenue Rank #182 / 275Payroll % — state benchmarkedThis home is ranked 182nd out of 275 homes in California.Shows payroll as a percentage of revenue versus the California average. Well-run SNFs often land around 55–65%. Below 25% may signal understaffing or heavy agency use — read with Staffing ratings.
Other operating costs Info All remaining costs needed to run the home, such as food, utilities, building maintenance, supplies and administrative expenses.
$9.2M
Total costs $17.5M
Walk Score
Walk Score: 69 / 100 Rank #93 / 229Walk Score — state benchmarkedThis home is ranked 93rd out of 229 homes in California.Shows how walkable this facility's neighborhood is compared to the average Walk Score across California SNFs. Higher scores benefit residents, families, and staff.
Moderately walkable. Some errands can be accomplished on foot, with a mix of nearby amenities.
BBB Rating
BBB Rating: A+ (Not Accredited)
An independent rating from the Better Business Bureau based on factors such as complaint history, transparency, and business practices.
How BBB ratings work

Contact The Springs of Pacific Regent

Inspection History

In California, the Department of Social Services (for assisted living facilities) and the Department of Public Health (for nursing homes) conduct inspections to ensure resident safety and regulatory compliance.

The data displayed corresponds to the last 8 years.

Inspection Scorecard Info This scorecard compares key inspection, citation, and complaint metrics at this facility against the California state average. Metrics worse than average are highlighted in red; those better than average are highlighted in green.

Since 2019 vs. California state average
Overall vs. California average 0 Worse No metrics in this bucket. 3 Better Metrics better than California average:
• Total visits (100% below)
• Complaint visits (100% below)
• Other visits (100% below)
Latest Inspection August 6, 2025 Routine

Inspections & Visits Info Regulatory visits include scheduled inspections, complaint investigations, and other on-site visits by state regulators.

MetricThis FacilityCalifornia Averagevs. California Avg
Total visits Info Combined count of complaint visits, other regulatory visits, and official scheduled inspections. 016 This facility has 100% fewer total visits than a typical California facility (0 vs. California avg 16).↓ 100% better
Complaint visits Info On-site visits triggered by formal complaints filed by residents, families, or staff. Fewer complaint visits generally indicate fewer reported concerns. 013 This facility has 100% fewer complaint visits than a typical California facility (0 vs. California avg 13).↓ 100% better
Other visits Info Regulatory visits that are neither routine inspections nor complaint investigations — administrative check-ins, follow-up reviews, licensing-related visits. 07 This facility has 100% fewer other visits than a typical California facility (0 vs. California avg 7).↓ 100% better

Inspection Reports Summary Info An editor-reviewed summary of the themes and findings across this facility's recent inspection reports.

The Springs at Pacific Regent has a mixed inspection record marked by recurring deficiencies in care planning, medication management, infection control, and food safety. The most recent inspection on August 6, 2025, found four deficiencies including unsanitary food handling, medication record discrepancies, and poor infection prevention during wound care. Previous reports documented substantiated complaints about medication errors and care planning failures, with no immediate jeopardy or fines but ongoing issues across multiple areas.

Read the full state inspection reports, including specific deficiencies and facility responses.

Show Inspection Reports

Health Inspection History

Inspections
Total health inspections 12

California average 12.5


Last Health inspection on Aug 2025

Total health citations
26 Rank #69 / 275Health citations — state benchmarkedThis home is ranked 69th out of 275 homes in California.Shows this facility's total health deficiency citations benchmarked to the California state average, with a ranking across all 275 CA SNFs. Lower citation counts earn a better rank.

California average 50.2

Citations per inspection
2.17 Rank #7 / 275Citations per inspection — state benchmarkedThis home is ranked 7th out of 275 homes in California.Shows average deficiency citations per CMS inspection for this facility versus the California mean across 275 SNFs with citation data. Lower is better.

California average 4.65


Health citations are formal notices following inspections when they fail to comply with safety and care standards.

14 of 26 citations resulted from standard inspections; and 12 of 26 resulted from complaint investigations.

Breakdown of citation severity (last 7 years)
Critical Health citations More info
0
100% better than California average

California average: 0.4


Serious Health citations More info 0
100% better than California average

California average: 1

0 critical citations More info California average: 0.4

0 serious citations More info California average: 1

26 moderate citations More info California average: 47.2

0 minor citations More info California average: 1.5
Citations history (last 7 years)
Infection Control moderate citation Info Issues related to preventing and controlling infections, including hygiene practices and safety protocols. Aug 06, 2025
Corrected

Nutrition moderate citation Info Issues related to food quality, meal service, and resident's nutritional needs. Aug 06, 2025
Corrected

Pharmacy moderate citation Info Issues related to medication management, including how drugs are stored, administered, and monitored. Aug 06, 2025
Corrected

Care Planning moderate citation Info Issues related to creating and updating personalized care plans for residents based on their needs and conditions. Aug 06, 2025
Corrected

Financial Assistance for
Nursing Home in California

The Springs of Pacific Regent is located in San Diego, California.
Here are the financial assistance programs available to residents in California.

Get Financial aid guidance

Multipurpose Senior Services Program

MSSP (Medi-Cal Waiver)

Age 65+
General California resident, Medi-Cal eligible, nursing home risk.
Income Limits (2025) ~$2,829/month 300% FBR, individual
Asset Limits $2,000 (individual), $3,000 (couple).
CA

County-managed; waitlists possible.

Benefits
In-home support (4-6 hours/day) Respite care (14 days/year) Meals (~$6/meal) Transportation (8 trips/month) Care management

In-Home Supportive Services (IHSS)

California IHSS

Age 65+
General California resident, Medicaid-eligible or low-income.
Income Limits ~$1,732/month individual, Medi-Cal threshold
Asset Limits $2,000 individual
CA

Can hire family as caregivers.

Benefits
Personal care (up to 283 hours/month) Homemaker services Respite (varies)

Multipurpose Senior Services Program (MSSP)

CA MSSP

Age 65+
General California resident, Medi-Cal-eligible, nursing home-eligible but community-capable.
Income Limits ~$2,829/month 300% FBR, individual
Asset Limits $2,000 individual
CA

Available in 38 counties; waitlists common.

Benefits
Case management Respite care (up to 10 days/year) Minor home mods (avg. $500) Adult day care (~$50/day)

Property Tax Postponement Program (PTP)

CA PTP

Age 62+
General California resident, own and live in home, 40% equity.
Income Limits (2025) ~$51,500/year household, adjusted annually
Asset Limits Equity-based; no strict asset cap.
CA

Deferred taxes accrue interest (5% as of 2024); repaid upon sale/death.

Benefits
Property tax deferral (avg. $1,000-$3,000/year, varies by county)

Assisted Living Waiver (ALW)

CA ALW

Age 65+ or disabled
General California resident, Medi-Cal-eligible, nursing home-eligible.
Income Limits ~$2,829/month 300% FBR, individual
Asset Limits $2,000 individual
CA

Available in 15 counties (e.g., LA, Sacramento); waitlists common.

Benefits
Personal care in ALFs (5-7 hours/day) Medication management Social services

California CARES Program

CA CARES

Age
General Caregivers of California residents 60+ needing help with 3+ daily activities; no caregiver age limit.
Income Limits No strict limit; cost-sharing above ~$2,500/month threshold.
Asset Limits Not applicable; need-based.
CA

High demand in urban areas; complements IHSS respite.

Benefits
Respite care (up to 10 days/year) Counseling (4-6 sessions/year) Training (2-3 workshops/year) Supplies (~$200/year)

Low-Income Home Energy Assistance Program (LIHEAP)

CA LIHEAP

Age 60+ priority
General California resident, low-income, utility/heating need.
Income Limits (2025) ~$2,510/month 200% of poverty level, individual
Asset Limits Not applicable; income-focused.
CA

High demand in inland/coastal extremes; weatherization capped at $5,000/home.

Benefits
Utility payments (avg. $500-$1,000/year) Weatherization (e.g., insulation, avg. $1,000-$3,000 savings)

Places of interest near The Springs of Pacific Regent

Address 11.2 miles from city center Info Estimated distance in miles from San Diego's city center to The Springs of Pacific Regent's address, calculated via Google Maps. — 0.67 miles to nearest hospital (VA Medical Center-San Diego)

Calculate Travel Distance to The Springs of Pacific Regent

Add your location

Address

Staffing Data (Q2 2025)

This data corresponds to Q2 2025 and is based on CMS Payroll-Based Journal.

Total staff 196
Employees 146
Contractors 50
Staff to resident ratio 3.38:1
3379210% better than California average

California average ratio: 0.00:1

Avg staff/day 53
Average shift 8 hours
0% compared with California average

California average: 7.7 hours

Total staff hours (quarter) 38,559
Nursing staff breakdown
Registered Nurse

Manages medical care and health needs.

Total count 16
Average shift length Info Average shift length. Calculated as total hours divided by days worked and average staff per day. 8.5 hours

No contractors work on this role.

Licensed Practical Nurse

Assists with medical care and medications.

Total count 29
Average shift length Info Average shift length. Calculated as total hours divided by days worked and average staff per day. 9.6 hours

No contractors work on this role.

Certified Nursing Assistant

Helps with daily care and mobility.

Total count 97
Average shift length Info Average shift length. Calculated as total hours divided by days worked and average staff per day. 7.5 hours

This role is partially covered by contractors.

Contractor staffing

Total hours from contractors

3.1%

1,201 contractor hours this quarter

Certified Nursing Assistant: 50
Staff by category
Certified Nursing Assistant47509712,45691100%7.5
Licensed Practical Nurse290298,91891100%9.6
Dental Services Staff5052,46991100%7.9
Respiratory Therapy Technician120122,3507987%7
Registered Nurse160161,94691100%8.5
Physical Therapy Aide6061,8408189%7.2
Speech Language Pathologist4041,4467886%7.5
Physical Therapy Assistant7071,3738998%6.8
RN Director of Nursing3031,1967178%8.4
Clinical Nurse Specialist4049086066%8.4
Qualified Social Worker6066987785%6.9
Nurse Practitioner1015856571%9
Dietitian1015477077%7.8
Administrator1015206571%8
Therapeutic Recreation Specialist1014716066%7.8
Other Dietary Services Staff1014566571%7
Occupational Therapy Aide2023834752%8.1
97 Certified Nursing Assistant
% of Days 100%
29 Licensed Practical Nurse
% of Days 100%
5 Dental Services Staff
% of Days 100%
12 Respiratory Therapy Technician
% of Days 87%
16 Registered Nurse
% of Days 100%
6 Physical Therapy Aide
% of Days 89%
4 Speech Language Pathologist
% of Days 86%
7 Physical Therapy Assistant
% of Days 98%
3 RN Director of Nursing
% of Days 78%
4 Clinical Nurse Specialist
% of Days 66%
6 Qualified Social Worker
% of Days 85%
1 Nurse Practitioner
% of Days 71%
1 Dietitian
% of Days 77%
1 Administrator
% of Days 71%
1 Therapeutic Recreation Specialist
% of Days 66%
1 Other Dietary Services Staff
% of Days 71%
2 Occupational Therapy Aide
% of Days 52%

Facility Characteristics

Source: CMS Long-Term Care Facility Characteristics (Data as of Jan 2026)

Total residents 58
Medicare
31
53.4% of residents
Private pay or other
27
46.6% of residents
Programs & Services
Residents Group

Residents meet regularly to discuss policies, care quality, and activities

Active Resident Council

Organized group of residents that meets regularly to discuss facility policies, quality of life, and activities.

Quality of care over time

These measures show how residents usually do over time at this home, based on health outcomes and preventive care.

Short-stay resident measures
Significantly above average California avg: 3.5 Info CMS star rating based on short-stay quality measure performance. 5 stars = much above average, 1 star = much below average.
Pneumococcal Vaccine Info Percent of short-stay residents assessed and appropriately given the pneumococcal vaccine 99.6%
6% better than California average

California average: 94.0%

Antipsychotic medication increase Info Percent of short-stay residents who newly received an antipsychotic medication 0.5%
66% better than California average

California average: 1.5%

Influenza Vaccine Info Percent of short-stay residents assessed and appropriately given the seasonal influenza vaccine 96.0%
In line with California average

California average: 93.2%

Re-hospitalized after SNF stay Info Percentage of short-stay residents who were re-hospitalized after their nursing home admission. 22.9%
In line with California average

California average: 23.2%

Emergency department visits Info Percentage of short-stay residents who had an outpatient emergency department visit. 7.8%
30% better than California average

California average: 11.2%

Falls with major injury Info Percentage of SNF residents who experience falls with major injury during their stay. 0.2%
77% better than California average

California average: 0.8%

Ability to care for self at discharge Info Percentage of residents at or above expected ability to care for themselves at discharge. 71.2%
33% better than California average

California average: 53.7%

Successful return to home or community Info Rate of successful return to home or community from a skilled nursing facility. 72.8%
44% better than California average

California average: 50.6%

Penalties and fines

Federal penalties imposed by CMS for regulatory violations, including civil money penalties (fines) and denials of payment for new Medicare/Medicaid admissions.

Source: CMS Penalties Database

No penalties in the past 3 years

No civil money penalties or payment denials were reported in the last 3 years.

Compare Nursing Home around San Diego The information below is reported by the California Department of Social Services and Department of Public Health.

5 facilities compared · CMS & CA Dept. of Health data · Updated May 2026

Filter by care type
Ridgeview Health Center
NH

Nursing Home Licensed facility providing 24/7 skilled nursing care for residents with complex, ongoing medical needs. Staffed by RNs, LPNs, and CNAs. Inspected and star-rated annually by CMS. Accepts Medicare (short-term rehab) and Medicaid (long-term care).

AL

Assisted Living A licensed, long-term care setting for seniors or individuals with disabilities who need help with daily activities — like bathing, dressing, and medication management — but not 24-hour skilled nursing. Offers housing, meals, and around-the-clock support while aiming to maximize resident independence.

San Diego (Scripps Ranch)68 85.3% +1%5.54 -3%+31%6172.8-25- 11 Crestview Hc Llc$8.4M$4.1M48.8%555928
Arroyo Vista Nursing Center
NH

Nursing Home Licensed facility providing 24/7 skilled nursing care for residents with complex, ongoing medical needs. Staffed by RNs, LPNs, and CNAs. Inspected and star-rated annually by CMS. Accepts Medicare (short-term rehab) and Medicaid (long-term care).

AL

Assisted Living A licensed, long-term care setting for seniors or individuals with disabilities who need help with daily activities — like bathing, dressing, and medication management — but not 24-hour skilled nursing. Offers housing, meals, and around-the-clock support while aiming to maximize resident independence.

San Diego (City Heights)53 89.7% +6%3.39 -10%-20%0254.2-47- 49 Moore, Ome$10.4M$4.7M45.2%55505
The Springs of Pacific Regent
NH

Nursing Home Licensed facility providing 24/7 skilled nursing care for residents with complex, ongoing medical needs. Staffed by RNs, LPNs, and CNAs. Inspected and star-rated annually by CMS. Accepts Medicare (short-term rehab) and Medicaid (long-term care).

AL

Assisted Living A licensed, long-term care setting for seniors or individuals with disabilities who need help with daily activities — like bathing, dressing, and medication management — but not 24-hour skilled nursing. Offers housing, meals, and around-the-clock support while aiming to maximize resident independence.

San Diego (University City)58 96.8% +14%3.58 -4%-15%0262.2-57A+ 69 Stevenson, Matthew$19.4M$7.2M37.2%555739
Jacob Health Care Center
NH

Nursing Home Licensed facility providing 24/7 skilled nursing care for residents with complex, ongoing medical needs. Staffed by RNs, LPNs, and CNAs. Inspected and star-rated annually by CMS. Accepts Medicare (short-term rehab) and Medicaid (long-term care).

AL

Assisted Living A licensed, long-term care setting for seniors or individuals with disabilities who need help with daily activities — like bathing, dressing, and medication management — but not 24-hour skilled nursing. Offers housing, meals, and around-the-clock support while aiming to maximize resident independence.

San Diego (City Heights)40 89.5% +6%3.29 +54%-22%0305.0-118A+ 49 -$15.0M$8.3M55.5%55508
Cloisters of the Valley, LLC -
NH

Nursing Home Licensed facility providing 24/7 skilled nursing care for residents with complex, ongoing medical needs. Staffed by RNs, LPNs, and CNAs. Inspected and star-rated annually by CMS. Accepts Medicare (short-term rehab) and Medicaid (long-term care).

AL

Assisted Living A licensed, long-term care setting for seniors or individuals with disabilities who need help with daily activities — like bathing, dressing, and medication management — but not 24-hour skilled nursing. Offers housing, meals, and around-the-clock support while aiming to maximize resident independence.

San Diego (Mission Valley)70--------0----- 71 -----

Guides for Better Senior Living

Care Cost Calculator: See Prices in Your Area

Nursing Home Data Explorer

Don’t Wait Too Long: 7 Red Flag Signs Your Parent Needs Assisted Living Now

The True Cost of Assisted Living in 2025 – And How Families Are Paying For It

Understanding Senior Living Costs: Pricing Models, Discounts & Financial Assistance

Frequently Asked Questions about The Springs of Pacific Regent

What neighborhood is The Springs of Pacific Regent in?

The Springs of Pacific Regent is in the University City neighborhood of San Diego.

Is The Springs of Pacific Regent in a walkable area?

The Springs of Pacific Regent has a walk score of 69. Moderately walkable. Some errands can be accomplished on foot, with a mix of nearby amenities.

What is the phone number of The Springs of Pacific Regent?

(425) 643-9933 will put you in contact with the team at The Springs of Pacific Regent.

Is The Springs of Pacific Regent Medicare or Medicaid certified?

Yes — The Springs of Pacific Regent is a CMS-certified provider of Medicare and Medicaid.

Explore Open Rooms
1 Contact details
2 What type of senior care service are you looking for?
3 What budget do you have in mind for senior care?
4 How soon do you need to find care?
5 Additional details

Thank you for your interest!

Our team will be in touch shortly to help with next steps.