Asbury Towers Retirement Community
Nursing Home, Assisted Living, Independent Living & Nursing Care · Greencastle, IN
CMS overall rating Info CMS (the Centers for Medicare & Medicaid Services) is the federal agency that rates nursing home quality. Its Overall Rating runs from 1 to 5 stars, combining health inspections, staffing, and quality measures, with inspections weighted most heavily.

Asbury Towers Retirement Community

Nursing Home, Assisted Living, Independent Living & Nursing Care · Greencastle, IN
CMS overall rating Info CMS (the Centers for Medicare & Medicaid Services) is the federal agency that rates nursing home quality. Its Overall Rating runs from 1 to 5 stars, combining health inspections, staffing, and quality measures, with inspections weighted most heavily.
Calculator: See prices in your area
Asbury Towers Retirement Community accepts Medicaid, Medicare, and private pay.

Overview of Asbury Towers Retirement Community

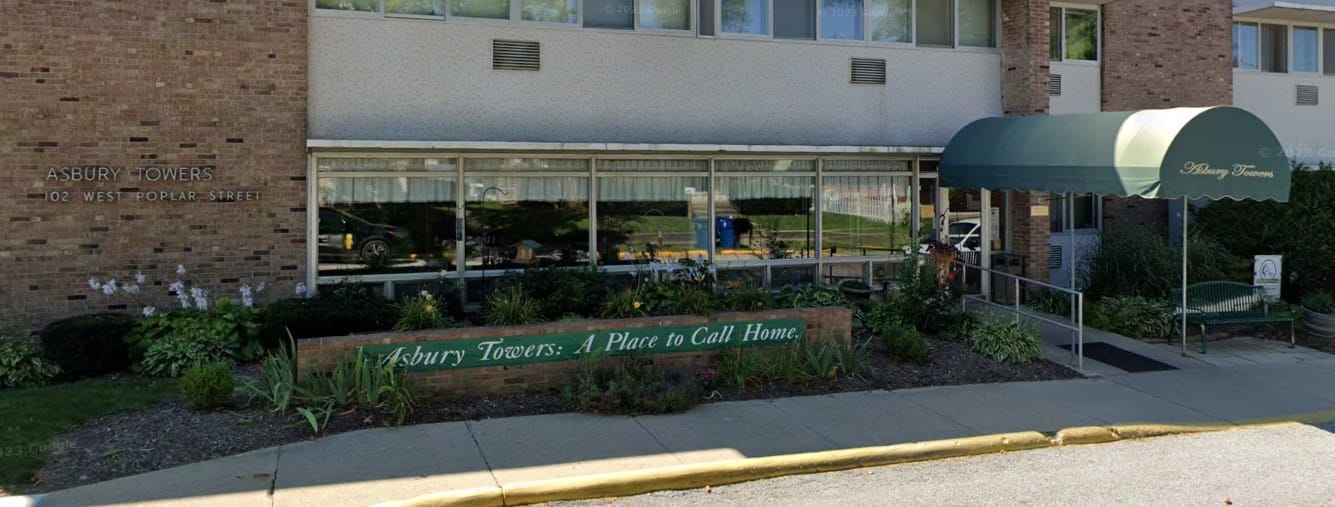
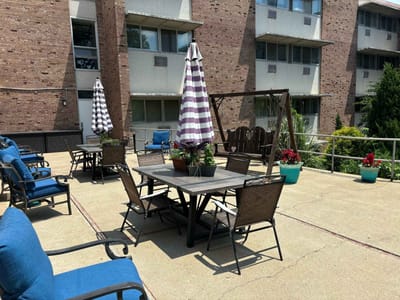
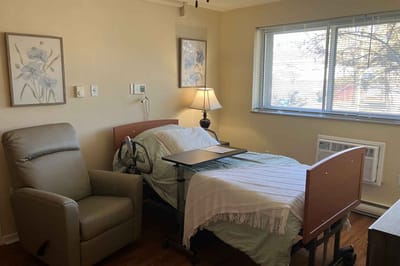
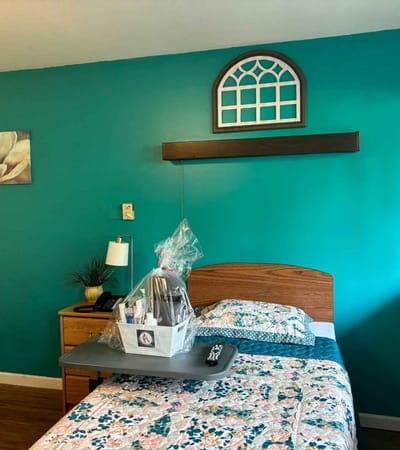
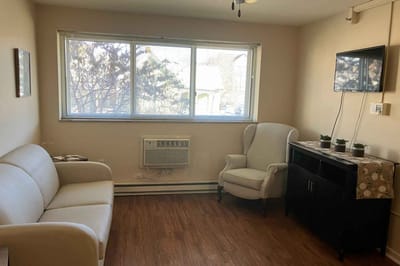
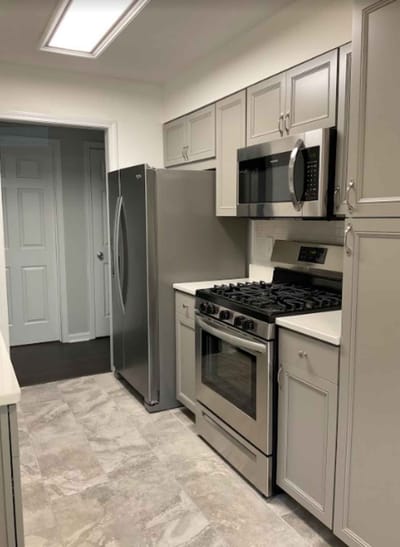
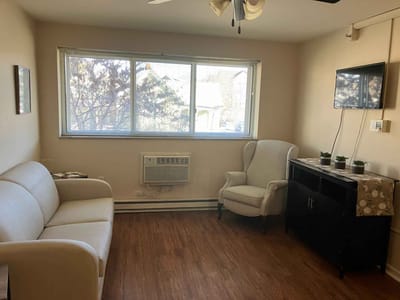
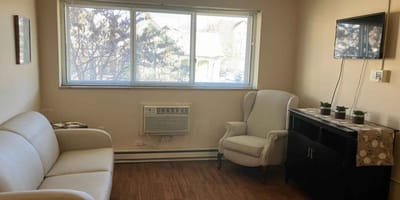
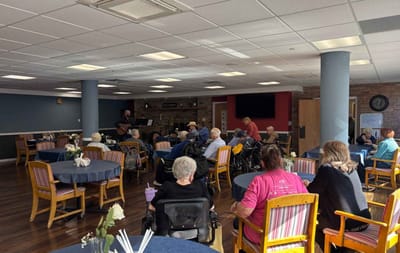
Surrounded by breathtaking scenery, Asbury Towers Retirement Community offers an ideal blend of exceptional care and a vibrant community, making it the perfect choice for residents in Greencastle, IN. Residents can benefit from personalized, compassionate support in independent living, assisted living, and skilled nursing, all provided by a team of experienced professionals. With a variety of floor plans available, the community accommodates different preferences and budgets, ensuring that each resident can find the ideal living space.

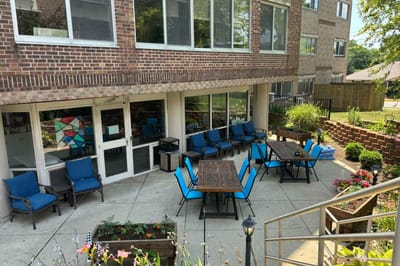
To enhance their quality of life even further, Asbury Towers provides a range of top-tier amenities and services, including a fully equipped fitness room to promote physical well-being, as well as a beauty and barber shop for residents to enjoy regular grooming services without leaving the community. With these thoughtful additions, residents can relax, unwind, and fully embrace their golden years in comfort and style.

Quality ratings

Measured by Centers for Medicare & Medicaid Services (CMS)

Overall rating Info The Overall CMS Rating combines results from health inspections, staffing levels and quality measures. Health inspections carry the most weight. Staffing and quality scores can increase or decrease the final rating based on performance compared to state and national standards.
▲ 62.1% Above IN avg. ▲ 62.1% Above IN avg.IN average: 3.1Click the badge to see the full State ranking.Click here to see the full State ranking.
Health Inspection Info Based on the results of the facility's three most recent standard inspections and any complaint investigations. CMS reviews the number, scope, and severity of deficiencies, with more recent findings weighted more heavily.
▲ 42.5% Above IN avg. ▲ 42.5% Above IN avg.IN average: 2.8Click the badge to see the full State ranking.Click here to see the full State ranking.
Staffing Info Measures average nursing staff hours per resident per day, including Registered Nurses (RNs) and total nursing staff. Ratings are adjusted based on the level of care residents require and are compared to state and national benchmarks.
▲ 103.4% Above IN avg. ▲ 103.4% Above IN avg.IN average: 2.5Click the badge to see the full State ranking.Click here to see the full State ranking.
Quality Measures Info Based on clinical and physical health indicators reported to CMS, such as hospital readmissions, falls, pressure ulcers, and improvements in mobility. These measures reflect how well residents' health needs are being managed.
▼ 26.6% Below IN avg. ▼ 26.6% Below IN avg.IN average: 4.1Click the badge to see the full State ranking.Click here to see the full State ranking.

Staffing hours breakdown

Info Daily nursing hours per resident by staff type, reported to CMS. Higher is generally better — compare this facility to state and national averages to see where staffing stands.

Hours per resident per day — compared to Indiana state averages

Total nursing care / resident Info This home is ranked 4th out of 291 homes in Indiana for nurse hours. Total adjusted nursing hours per resident per day, combining RN, LPN, and aide time. CMS adjusts this for case-mix so facilities can be fairly compared.
7h 2m per day
Rank #4 / 291Nurse hours — State benchmarkedThis home is ranked 4th out of 291 homes in Indiana. Shows adjusted nurse hours per resident per day benchmarked to the Indiana average, with a ranking across 291 Indiana facilities. More hours mean more direct care. The national average is about 3.5 hrs; below 3.0 is a red flag.Ranking totals vary by category as each rank only includes facilities that report data for that metric. Homes missing that data point aren't included in the ranking.Click the rank badge to see the full State ranking.Click here to see the full State ranking.
This facility Indiana avg (3h 26m per day)
vs Indiana avg
+104%

1 of 6 metrics below state avg

Standout metric Registered Nurse (RN) is +67% above state avg
Staff typeHours / Day / Residentvs state avg
Registered Nurse (RN) Info RNs hold the highest nursing license and can assess residents, interpret test results, and direct care plans. More RN hours per day often signals stronger clinical oversight and faster response to health changes. 1h 5m per day ▲ 67% State avg: 39m per day · National avg: 41m per day
LPN / LVN Info Licensed Practical Nurses (LPNs) or Licensed Vocational Nurses (LVNs) deliver routine hands-on care — medication administration, wound dressing, and monitoring vital signs. They work under RN supervision and make up a large share of daily bedside care. 1h 1m per day ▲ 30% State avg: 47m per day · National avg: 52m per day
Nurse Aide Info Certified Nurse Aides (CNAs) provide the most direct day-to-day assistance: bathing, dressing, feeding, and mobility. Nurse aide hours are typically the largest staffing category and directly affect residents' quality of life. 3h 46m per day ▲ 67% State avg: 2h 15m per day · National avg: 2h 20m per day
Weekend Total Nursing Info Combined nursing hours (RN + LPN + Nurse Aide) per resident per day on weekends. Staffing often drops on weekends — this figure reveals whether the facility maintains adequate coverage outside of weekday hours. 4h 59m per day ▲ 53% State avg: 3h 16m per day · National avg: 3h 27m per day
Physical Therapist Info Hours per resident per day provided by licensed Physical Therapists (PTs) or PT Assistants. PT services help residents recover mobility after injury or illness and are especially important for post-acute (short-stay) rehabilitation. 1m per day ▼ 79% State avg: 4m per day · National avg: 4m per day
Weekend RN Info Registered nurse hours specifically on weekends. Facilities sometimes reduce RN presence on Saturdays and Sundays — a low weekend RN figure compared to weekday hours can indicate reduced clinical oversight when most administrative staff are absent. 33m per day ▲ 23% State avg: 27m per day · National avg: 29m per day

Capacity and availability

Avg. Length of Stay
98 days
Bed community size
123-bed community Rank #163 / 437Bed count — State benchmarkedThis home is ranked 163rd out of 437 homes in Indiana. Shows this facility's certified or reported bed count compared to other Indiana facilities. Larger communities may offer more amenities, programs, and on-site services for residents and families.Ranking totals vary by category as each rank only includes facilities that report data for that metric. Homes missing that data point aren't included in the ranking.Click the rank badge to see the full State ranking.Click here to see the full State ranking.
A larger shared setting that may offer more common spaces and organized community services.
Walk Score
Walk Score: 73 / 100 Rank #49 / 587Walk Score — State benchmarkedThis home is ranked 49th out of 587 homes in Indiana. Shows how walkable this facility's neighborhood is compared to the average Walk Score across Indiana facilities. Higher scores benefit residents, families, and staff.Ranking totals vary by category as each rank only includes facilities that report data for that metric. Homes missing that data point aren't included in the ranking.Click the rank badge to see the full State ranking.Click here to see the full State ranking.
Very walkable. Most errands can be accomplished on foot, and many essentials are within a short walk.
BBB Rating
BBB Rating: A+ (Not Accredited)
An independent rating from the Better Business Bureau based on factors such as complaint history, transparency, and business practices.
How BBB ratings work

About this community

License Details

Facility TypeNursing Home / Skilled Nursing Facility / Nursing Facility Dually Certified
StatusActive
IssuanceJuly 1, 2025
ExpirationJune 30, 2026
License Number25-001120-1
CertificationsMedicare, Medicaid

Ownership & Operating Entity

Asbury Towers Retirement Community is legally operated by Pulaski Memorial Hospital, and administrated by Eric Ahlbrand.

Profit StatusNon-Profit

Type Of Units

SNF/NF (Combined)
48 units
Residential
75 units
Total beds
123 units

Safety & Compliance

Secured Perimeter
Safety Features24-hour security

Staffing

Key information about the people who lead and staff this community.

Leadership

Medical DirectorJohn Savage
Director of NursingAudra Rose
ContactMr. John Eley, Executive Director/Administrator

Payment & Insurance

1 service
Accept Medicaid

Therapy & Rehabilitation

2 services
Rehabilitation Services
Short-Term Rehab

Staffing & Medical

1 service
Doctor on Staff

Additional Services

1 service
Home Care

Contact Information

Fax(765) 653-5587

Amenities & Lifestyle

Library
Restaurant
Craft Room
ActivitiesResidents can engage in a variety of activities, programs, and religious services to keep them active and involved.
Wellness ProgramThe life enrichment team at Asbury Towers plays a vital role in our person-centered philosophy, focusing on meeting emotional, spiritual, and social needs through various activities.
Specific ProgramsInsurance Plans, Staff Spotlights, Asbury Newsletter, Sterling Healthcare, Video Testimonials
Religious ServicesYes

Dining & Nutrition

Food DescriptionMeals are served with an emphasis on well-being, promoting good nutrition and healthy recovery. The dining program includes chef-prepared meals served restaurant-style.

Contact Asbury Towers Retirement Community

Inspection History

In Indiana, the Department of Health, Division of Long Term Care is the primary regulatory body that performs onsite inspections and quality of care reviews for all licensed facilities.

Since 2022 · 4 years of data 87 deficiencies 2 complaints 20 inspections
Inspection Score Info A composite 0–100 score combining this facility's inspections, citations, complaints, and enforcement actions relative to the Indiana state average. The score below shows how many points this facility sits above or below the typical Indiana nursing home score (the benchmark); higher is better.

6 points below the Indiana average for nursing homes (83/100)

Rank #228 / 384 in Indiana Inspection Score — State benchmarked This home is ranked 228th out of 384 homes in Indiana. Shows this facility's inspection score compared to the Indiana average among 384 comparable communities in the ranking pool. Ranking totals vary by category as each rank only includes facilities that report data for that metric. Homes missing that data point aren't included in the ranking. Inspection score: 77 out of 100. Letter grade C+. 6 points below the Indiana average for nursing homes (83/100)

Inspection Scorecard Info This scorecard compares key inspection, citation, and complaint metrics at this facility against the Indiana state average. Metrics rated ≥15% worse than average are highlighted in red; those ≥15% better are highlighted in green.

Since 2022 vs. Indiana state average
Overall vs. IN average 6 Worse Metrics worse than Indiana average:
• Total deficiencies (142% above)
• Deficiencies per year (142% above)
• Deficiencies per inspection (132% above)
• Total visits (5% above)
• Inspections with deficiencies (43% above)
• Inspection deficiency rate (35% above)
4 Better Metrics better than Indiana average:
• Inspections (54% below)
• Total complaints (60% below)
• Complaints per year (62% below)
• Complaint visits (25% below)
Latest Inspection June 5, 2025 Re Inspection

Deficiencies Info Deficiencies are formal regulatory issues recorded during state inspections.

This FacilityIN Averagevs. IN Avg
Total deficiencies Info Formal regulatory issues recorded by inspectors across all inspection types. 8736 This facility has 142% more total deficiencies than a typical Indiana nursing home (87 vs. IN avg 36).↑ 142% worse Rank #318 / 386 Total deficiencies — State benchmarked This home is ranked 318th out of 386 homes in Indiana. Shows this facility's deficiencies compared to the Indiana average among 386 comparable communities in the ranking pool. Ranking totals vary by category as each rank only includes facilities that report data for that metric. Homes missing that data point aren't included in the ranking.
Deficiencies per year Info Average deficiencies per year since 2022. 21.89 This facility has 142% more deficiencies per year than a typical Indiana nursing home (21.8 vs. IN avg 9).↑ 142% worse
Deficiencies per inspection Info Average deficiencies per inspection. 4.41.9 This facility has 132% more deficiencies per inspection than a typical Indiana nursing home (4.4 vs. IN avg 1.9).↑ 132% worse Rank #289 / 386 Deficiencies per inspection — State benchmarked This home is ranked 289th out of 386 homes in Indiana. Shows this facility's deficiencies per inspection compared to the Indiana average among 386 comparable communities in the ranking pool. Ranking totals vary by category as each rank only includes facilities that report data for that metric. Homes missing that data point aren't included in the ranking.

Inspections Info State inspections evaluate whether the facility meets health and safety standards.

This FacilityIN Averagevs. IN Avg
Total visits Info Combined count of all on-site visits — routine inspections, complaint visits, follow-ups, and other focused visits. 2019 This facility has 5% more total visits than a typical Indiana nursing home (20 vs. IN avg 19).↑ 5% worse
Inspections with deficiencies Info Inspections that resulted in at least one regulatory deficiency. 107 This facility has 43% more inspections with deficiencies than a typical Indiana nursing home (10 vs. IN avg 7).↑ 43% worse
Inspection deficiency rate Info Percentage of inspections that resulted in at least one deficiency. 50%37% This facility has 13 percentage points higher inspection deficiency rate than a typical Indiana nursing home (50% vs. IN avg 37%).↑ 13% worse
Inspections Info Routine, scheduled inspections conducted by state regulators. 613 This facility has 54% fewer inspections than a typical Indiana nursing home (6 vs. IN avg 13).↓ 54% better

Complaints & Investigations Info Complaints are formal concerns filed by residents, families, or staff. Investigations are on-site follow-ups.

This FacilityIN Averagevs. IN Avg
Total complaints Info Formal expressions of concern made by residents, families, or staff. 25 This facility has 60% fewer total complaints than a typical Indiana nursing home (2 vs. IN avg 5).↓ 60% better Rank #50 / 352 Total complaints — State benchmarked This home is ranked 50th out of 352 homes in Indiana. Shows this facility's total complaints compared to the Indiana average among 352 comparable communities in the ranking pool. Ranking totals vary by category as each rank only includes facilities that report data for that metric. Homes missing that data point aren't included in the ranking.
Complaints per year Info Average complaints per year since 2022. 0.51.3 This facility has 62% fewer complaints per year than a typical Indiana nursing home (0.5 vs. IN avg 1.3).↓ 62% better
Complaint visits Info On-site visits triggered by formal complaints. Formal complaints can result in multiple visits. 68 This facility has 25% fewer complaint visits than a typical Indiana nursing home (6 vs. IN avg 8).↓ 25% better

Inspection Reports Summary Info An editor-reviewed summary of the themes and findings across this facility's recent inspection reports.

  • The June 5, 2025 re-inspection found the facility in compliance with Life Safety Code and Medicare/Medicaid requirements, with no deficiencies noted.
  • The April 23, 2025 Life Safety Code survey cited five deficiencies including obstructed egress, sprinkler system testing lapses, improperly installed fire extinguishers, faulty corridor door latches, and missing electrical receptacle testing.
  • The March 28, 2025 annual inspection found five deficiencies including failure to document hospital transfer communications, inaccurate MDS assessments, improper food temperatures, lack of hair/beard nets in food service, and missing physician orders for transfers.

Health Inspection History

Inspections since 2022
Total health inspections 3

Indiana average 6


Last Health inspection on Mar 2025

Total health citations
14 Rank #66 / 292Health citations — State benchmarkedThis home is ranked 66th out of 292 homes in Indiana. Shows this facility's total health deficiency citations benchmarked to the Indiana State average, with a ranking across all 292 IN facilities. Lower citation counts earn a better rank.Ranking totals vary by category as each rank only includes facilities that report data for that metric. Homes missing that data point aren't included in the ranking.Click the rank badge to see the full State ranking.Click here to see the full State ranking.

Indiana average 25

Citations per inspection
4.67 Rank #194 / 292Citations per inspection — State benchmarkedThis home is ranked 194th out of 292 homes in Indiana. Shows average deficiency citations per CMS inspection for this facility versus the Indiana mean across 292 facilities with citation data. Lower is better.Ranking totals vary by category as each rank only includes facilities that report data for that metric. Homes missing that data point aren't included in the ranking.Click the rank badge to see the full State ranking.Click here to see the full State ranking.

Indiana average 4.12


Health citations are formal notices following inspections when they fail to comply with safety and care standards.

All 14 citations resulted from standard inspections.

Breakdown of citation severity (last 4 years)
Critical health citations
0
100% better than Indiana average

Indiana average: 0.2


Serious health citations
0
100% better than Indiana average

Indiana average: 0.6

0 critical citations Indiana average: 0.2

0 serious citations Indiana average: 0.6

14 moderate citations Indiana average: 23.8

0 minor citations Indiana average: 0.4
Citations history (last 4 years)
Nutrition moderate citation Mar 28, 2025
Corrected

Nutrition moderate citation Mar 28, 2025
Corrected

Care Planning moderate citation Mar 28, 2025
Corrected

Resident Rights moderate citation Mar 28, 2025
Corrected

Staffing Data

Reporting period: October 1 – December 31, 2025 (Q4 2025). Source: CMS Payroll-Based Journal report.

Total staff 111
Employees 57
Contractors 54
Staff to resident ratio 1.63 : 1
1632253% more staff per resident than Indiana average
Indiana average ratio: 0.00 : 1 Indiana average ratio: 0.00 : 1See full Indiana ranking
Avg staff/day 28
Average shift 8.2 hours
6% better than Indiana average
Indiana average: 7.7 hours Indiana average shift: 7.7 hoursSee full Indiana ranking
Total staff hours (quarter) 21,133

Nursing staff breakdown

Q4 2025 · Oct 1 – Dec 31 More info This data comes from the CMS Payroll-Based Journal report covering October 1 – December 31, 2025.
Registered Nurse

Manages medical care and health needs.

RN Staff Info 16 total: 7 full-time employees and 9 contractors. 16
Average shift length Info Average shift length. Calculated as total hours divided by days worked and average staff per day. 10.3 hours
Licensed Practical Nurse

Assists with medical care and medications.

LPN Staff Info 32 total: 6 full-time employees and 26 contractors. 32
Average shift length Info Average shift length. Calculated as total hours divided by days worked and average staff per day. 8.6 hours
Certified Nursing Assistant

Helps with daily care and mobility.

CNA Staff Info 33 total: 25 full-time employees and 8 contractors. 33
Average shift length Info Average shift length. Calculated as total hours divided by days worked and average staff per day. 8.8 hours

Contractor staffing

Q4 2025 · Oct 1 – Dec 31 More info This data comes from the CMS Payroll-Based Journal report covering October 1 – December 31, 2025.

Total hours from contractors

7.5%

1,584 contractor hours this quarter

Licensed Practical Nurse: 26 Registered Nurse: 9 Certified Nursing Assistant: 8 Speech Language Pathologist: 4 Respiratory Therapy Technician: 4 Physical Therapy Aide: 1 Qualified Social Worker: 1 Physical Therapy Assistant: 1

Staff by category

Q4 2025 · Oct 1 – Dec 31 More info This data comes from the CMS Payroll-Based Journal report covering October 1 – December 31, 2025.
Certified Nursing Assistant258338,20892100%8.8
Licensed Practical Nurse626322,3619199%8.6
Medication Aide/Technician6062,29592100%8.5
Registered Nurse79162,05792100%10.3
Other Dietary Services Staff5051,6659098%6.9
Occupational Therapy Aide2029937784%7.6
Nurse Practitioner1015156571%7.9
RN Director of Nursing1014856672%7.4
Mental Health Service Worker1014826065%8
Administrator1014805560%8.7
Clinical Nurse Specialist1014725863%8.1
Dietitian1014645863%8
Physical Therapy Aide0112623639%7.3
Speech Language Pathologist0441894549%3.9
Qualified Social Worker011974043%2.4
Physical Therapy Assistant011732527%2.9
Respiratory Therapy Technician044362022%1.8
33 Certified Nursing Assistant
% of Days 100%
32 Licensed Practical Nurse
% of Days 99%
6 Medication Aide/Technician
% of Days 100%
16 Registered Nurse
% of Days 100%
5 Other Dietary Services Staff
% of Days 98%
2 Occupational Therapy Aide
% of Days 84%
1 Nurse Practitioner
% of Days 71%
1 RN Director of Nursing
% of Days 72%
1 Mental Health Service Worker
% of Days 65%
1 Administrator
% of Days 60%
1 Clinical Nurse Specialist
% of Days 63%
1 Dietitian
% of Days 63%
1 Physical Therapy Aide
% of Days 39%
4 Speech Language Pathologist
% of Days 49%
1 Qualified Social Worker
% of Days 43%
1 Physical Therapy Assistant
% of Days 27%
4 Respiratory Therapy Technician
% of Days 22%

Penalties and fines

Federal penalties imposed by CMS for regulatory violations, including civil money penalties (fines) and denials of payment for new Medicare/Medicaid admissions.

Source: CMS Penalties Database

No penalties in the past 3 years

No civil money penalties or payment denials were reported in the last 3 years.

Quality of care over time

These measures show how residents usually do over time at this home, based on health outcomes and preventive care.

High-risk clinical events score Info A composite score based on pressure ulcers, falls with injury, weight loss, walking ability decline, and activities of daily living decline. 7.2
10% better than Indiana average

Indiana average: 8.0

Functional decline score Info A composite score based on activities of daily living decline, walking ability decline, and incontinence. 15.2
11% better than Indiana average

Indiana average: 17.1

Long-stay resident measures
Need for Help with Daily Activities Increased Info Percent of long-stay residents whose need for help with daily activities has increased 13.3%
11% worse than Indiana average

Indiana average: 12.0%

Walking Ability Worsened Info Percent of long-stay residents whose ability to move independently worsened 11.9%
17% better than Indiana average

Indiana average: 14.4%

Low Risk Residents with Bowel/Bladder Incontinence Info Percent of low risk long-stay residents who lose control of their bowels or bladder 20.4%
17% better than Indiana average

Indiana average: 24.6%

Falls with Major Injury Info Percent of long-stay residents experiencing one or more falls with major injury 3.7%
In line with Indiana average

Indiana average: 3.9%

High Risk Residents with Pressure Ulcers Info Percent of long-stay high risk residents with pressure ulcers 2.0%
55% better than Indiana average

Indiana average: 4.4%

Urinary Tract Infection Info Percent of long-stay residents with a urinary tract infection 3.8%
209% worse than Indiana average

Indiana average: 1.2%

Lost Too Much Weight Info Percent of long-stay residents who lose too much weight 5.2%
9% better than Indiana average

Indiana average: 5.7%

Depressive Symptoms Info Percent of long-stay residents who have depressive symptoms 16.2%
33% better than Indiana average

Indiana average: 24.1%

Antipsychotic Use Info Percent of long-stay residents who received an antipsychotic medication 28.6%
130% worse than Indiana average

Indiana average: 12.4%

Pneumococcal Vaccine Info Percent of long-stay residents assessed and appropriately given the pneumococcal vaccine 77.8%
17% worse than Indiana average

Indiana average: 93.7%

Influenza Vaccine Info Percent of long-stay residents assessed and appropriately given the seasonal influenza vaccine 95.8%
In line with Indiana average

Indiana average: 95.4%

Short-stay resident measures
Pneumococcal Vaccine Info Percent of short-stay residents assessed and appropriately given the pneumococcal vaccine 65.9%
19% worse than Indiana average

Indiana average: 81.7%

Antipsychotic medication increase Info Percent of short-stay residents who newly received an antipsychotic medication 4.1%
198% worse than Indiana average

Indiana average: 1.4%

Influenza Vaccine Info Percent of short-stay residents assessed and appropriately given the seasonal influenza vaccine 61.9%
22% worse than Indiana average

Indiana average: 79.0%

Breakdown by payment type

Medicare

32% of new residents, usually for short-term rehab.

Typical stay 1 - 2 months

Private pay

68% of new residents, often for short stays.

Typical stay 4 - 5 months

Facility Characteristics

Source: CMS Long-Term Care Facility Characteristics (Data as of Jan 2026)

Total residents 68
Medicare
3
4.4% of residents
Medicaid
38
55.9% of residents
Private pay or other
27
39.7% of residents
Programs & Services
Residents Group

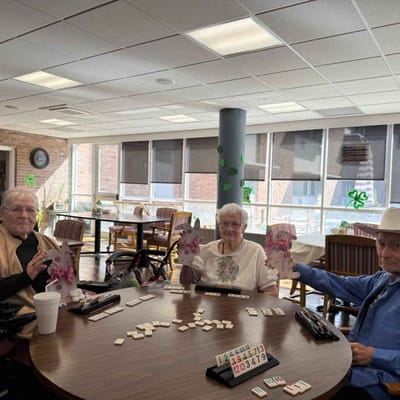
Residents meet regularly to discuss policies, care quality, and activities

CCRC

Part of a Continuing Care Retirement Community offering multiple care levels

Active Resident Council

Organized group of residents that meets regularly to discuss facility policies, quality of life, and activities.

Finances and operations

Based on CMS SNF Cost Report for fiscal year ending in 12/2023.

Governmental community
Operated by a subsidized facility district.
Net patient revenue Info Net patient revenue — what the home actually collects for resident care, after contractual allowances, bad debt and discounts are subtracted from its gross charges (CMS cost report, Worksheet G-3). It covers resident care only; money the home earns from other sources is shown separately as "Other income."
$5.5M
Net patient income Info Net patient income: net patient revenue minus the home's total operating expenses. A positive figure means it earns more from resident care than it spends to deliver it; a negative figure means the opposite. It excludes non-operating "other income."
-$55.6K
Governmental community Operated by a subsidized facility district.
Net patient revenue Info Net patient revenue — what the home actually collects for resident care, after contractual allowances, bad debt and discounts are subtracted from its gross charges (CMS cost report, Worksheet G-3). It covers resident care only; money the home earns from other sources is shown separately as "Other income."
$5.5M Rank #252 / 294Revenue — State benchmarkedThis home is ranked 252nd out of 294 homes in Indiana. Shows this facility's annual revenue compared to the Indiana average. Higher revenue generally means more resources for staffing and capital — read alongside Payroll %.Ranking totals vary by category as each rank only includes facilities that report data for that metric. Homes missing that data point aren't included in the ranking.Click the rank badge to see the full State ranking.Click here to see the full State ranking.
Net patient income Info Net patient income: net patient revenue minus the home's total operating expenses. A positive figure means it earns more from resident care than it spends to deliver it; a negative figure means the opposite. It excludes non-operating "other income."
-$55.6K
Other income Info Money the home earns outside of resident care — such as investments, grants, rentals and other non-operating sources (CMS cost report, Worksheet G-3). It is tracked separately from net patient revenue: it is not part of that figure, and it is not included in net patient income.
$117.0K
Payroll costs Info Staff salaries plus wage-related costs — benefits such as payroll taxes, health insurance and retirement — from the home's own accounting records (CMS cost report, Worksheet A). Contract or agency labor is counted separately, under other operating costs. Rank #178 / 294Payroll — State benchmarkedThis home is ranked 178th out of 294 homes in Indiana. Shows total annual staff payroll benchmarked to the Indiana average. Higher payroll investment relative to peers often signals better staffing and less reliance on cheaper contract labor.Ranking totals vary by category as each rank only includes facilities that report data for that metric. Homes missing that data point aren't included in the ranking.Click the rank badge to see the full State ranking.Click here to see the full State ranking.
$4.3M 78.7% of net patient revenue Info Payroll as a share of revenue: staff salaries and wage-related benefits divided by net patient revenue. A higher figure means more of each revenue dollar goes to staff pay. Rank #4 / 294Payroll % — State benchmarkedThis home is ranked 4th out of 294 homes in Indiana. Shows payroll as a percentage of revenue versus the Indiana average. Well-run Indiana facilities typically land around 54–68% — the top third Statewide. Below 25% may signal understaffing or heavy agency use — read with Staffing ratings.Ranking totals vary by category as each rank only includes facilities that report data for that metric. Homes missing that data point aren't included in the ranking.Click the rank badge to see the full State ranking.Click here to see the full State ranking.
Other operating costs Info Everything it costs to run the home apart from payroll — food, utilities, supplies, maintenance, contract labor and administration. Calculated as total operating expense minus payroll (staff salaries and wage-related benefits).
$1.2M
Total costs Info The home's total operating expense for the year — all the costs of running it, salaries included (CMS cost report, Worksheet G-3).
$5.5M

What does this home offer?

Housing options icon

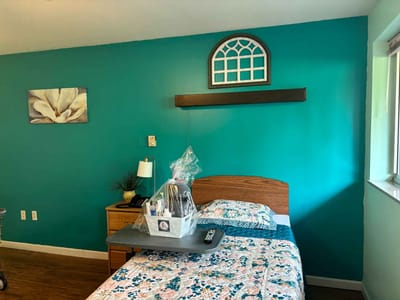
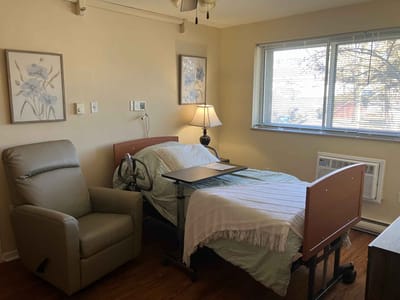
Housing Options: Studio / 1 Bed / 2 Bed

Building type icon
Building type icon

Building Type: 3-story

Transportation services icon

Transportation Services

Fitness and recreation icon

Fitness and Recreation

Dining services icon

Three Meals Per Day

Who this home usually serves

TYPE OF STAY

Primarily short stays

Residents typically stay for brief periods, with frequent admissions and discharges throughout the year.

Most new residents arrive under private pay (68% of admissions), and a typical private pay stay runs around 4 - 5 months.

Admissions
71 total

Coverage residents most often arrive under.

Medicare 32%
Private pay 68%
Discharges
75 total

Coverage residents most often leave under.

Medicare 25%
Private pay 75%

Managed by Eric Ahlbrand

Executive Director

Places of interest near Asbury Towers Retirement Community

Address 0.3 mile from city center

Calculate Travel Distance to Asbury Towers Retirement Community

Add your location

Address

Compare Nursing Home around Greencastle

The information below is reported by the Indiana Department of Health, Division of Long Term Care.

4 facilities compared · CMS & IN Dept. of Health data

Asbury Towers Retirement Community
NH
AL
IL
NC
Greencastle
123
Facility 123
IN AVG 116
Rank #163 / 437
--
7.03
Facility 7.03
IN AVG 3.44
Rank #4 / 291
+47%+104%
$0
Facility $0
IN AVG $31.4k
Rank #1 / 293
77
Facility 77
IN AVG 83
Rank #228 / 384
14
Facility 14
IN AVG 25.0
Rank #66 / 292
4.7
Facility 4.7
IN AVG 4.1
Rank #194 / 292
-24A+
73
Facility 73
IN AVG 37
Rank #49 / 587
Pulaski Memorial Hospital
$5.5M
Facility $5.5M
IN AVG $10.7M
Rank #252 / 294
$4.3M
Facility $4.3M
IN AVG $4.2M
Rank #178 / 294
78.7%
Facility 78.7%
IN AVG 42%
Rank #4 / 294
155758
Mill Pond Health Campus
NH
AL
MC
Greencastle
117
Facility 117
IN AVG 116
Rank #179 / 437
27.4%
Facility 27.4%
IN AVG 69.4%
Rank #419 / 434
-61%
3.00
Facility 3.00
IN AVG 3.44
Rank #213 / 291
+7%-13%
$0
Facility $0
IN AVG $31.4k
Rank #1 / 293
-
22
Facility 22
IN AVG 25.0
Rank #140 / 292
3.7
Facility 3.7
IN AVG 4.1
Rank #130 / 292
232-
36
Facility 36
IN AVG 37
Rank #288 / 587
Trilogy Healthcare Operations Of Greencastle, LLC
$8.6M
Facility $8.6M
IN AVG $10.7M
Rank #183 / 294
$4.5M
Facility $4.5M
IN AVG $4.2M
Rank #165 / 294
52.5%
Facility 52.5%
IN AVG 42%
Rank #103 / 294
155736
Hickory Creek at Sunset
NH
AL
IL
MC
Greencastle
68
Facility 68
IN AVG 116
Rank #354 / 437
75.0%
Facility 75.0%
IN AVG 69.4%
Rank #147 / 434
+8%
2.89
Facility 2.89
IN AVG 3.44
Rank #232 / 291
+13%-16%
$0
Facility $0
IN AVG $31.4k
Rank #1 / 293
79
Facility 79
IN AVG 83
Rank #209 / 384
15
Facility 15
IN AVG 25.0
Rank #77 / 292
3.0
Facility 3.0
IN AVG 4.1
Rank #82 / 292
-54A+
42
Facility 42
IN AVG 37
Rank #261 / 587
Yvonne Culpepper
$5.4M
Facility $5.4M
IN AVG $10.7M
Rank #271 / 294
$2.6M
Facility $2.6M
IN AVG $4.2M
Rank #261 / 294
47.8%
Facility 47.8%
IN AVG 42%
Rank #61 / 294
155565
The Waters of Greencastle
NH
MC
RC
Greencastle
100
Facility 100
IN AVG 116
Rank #237 / 437
64.0%
Facility 64.0%
IN AVG 69.4%
Rank #244 / 434
-8%
2.83
Facility 2.83
IN AVG 3.44
Rank #245 / 291
-20%-18%
$0
Facility $0
IN AVG $31.4k
Rank #1 / 293
-
21
Facility 21
IN AVG 25.0
Rank #131 / 292
4.2
Facility 4.2
IN AVG 4.1
Rank #170 / 292
-71-
1
Facility 1
IN AVG 37
Rank #553 / 587
Jennifer Etienne
$8.2M
Facility $8.2M
IN AVG $10.7M
Rank #197 / 294
$3.7M
Facility $3.7M
IN AVG $4.2M
Rank #228 / 294
44.7%
Facility 44.7%
IN AVG 42%
Rank #224 / 294
155202

Financial Assistance for
Nursing Home in Indiana

Asbury Towers Retirement Community is located in Greencastle, Indiana.
Here are the financial assistance programs available to residents in Indiana.

Get Financial aid guidance

Aged and Disabled Waiver

Indiana Medicaid A&D Waiver

Age 65+ or disabled
General Indiana resident, Medicaid-eligible, nursing home-level care need.
Income Limits (2025) ~$2,829/month 300% FBR, individual
Asset Limits $2,000 (individual), $3,000 (couple).
IN

Requires level-of-care determination.

Benefits
Personal care (5-7 hours/day) Respite (240 hours/year) Adult day care (~$60/day) Home health services

CHOICE Program

Indiana CHOICE

Age 60+
General Indiana resident, at risk of nursing home.
Income Limits ~$2,000/month varies
Asset Limits $10,000 individual
IN

Limited funding; regional variation.

Benefits
In-home care (3-5 hours/week) Respite (up to 10 days/year) Transportation (~5 trips/month)

Residential Care Assistance Program (RCAP)

Indiana Residential Care Assistance Program

Age 65+
General or blind, or disabled, Indiana resident, in approved facility, low-income or SSI recipient.
Income Limits (2025) ~$1,004/month including SSI
Asset Limits $2,000 (individual), $3,000 (couple).
IN

~50 facilities statewide; per diem rate set by FSSA.

Benefits
Room/board Laundry Minimal care coordination (~$20-$50/day subsidy)

Medicare Savings Program (MSP)

Indiana Medicare Savings Program

Age 65+ or disabled
General Indiana resident, Medicare Part A/B.
Income Limits (2025) ~$2,510/month (QMB), ~$3,380/month (SLMB), ~$3,598/month (QI)—individual.
Asset Limits $9,430 (individual), $14,130 (couple).
IN

Three tiers; no waitlist.

Benefits
Covers Part B premiums ($174.70/month) Deductibles ($240/year) Copays (~20%)

National Family Caregiver Support Program (NFCSP) Respite

Indiana NFCSP Respite Care

Age
General Caregivers of 60+ needing care or 55+ caregivers of others; Indiana resident; functional needs (2+ ADLs).
Income Limits (2025) Prioritizes ~$24,980/year (individual); no strict cap.
Asset Limits Not assessed; need-based.
IN

16 AAAs; prioritizes low-income, rural caregivers.

Benefits
Respite (4-6 hours/week or 5 days/year) Adult day care ($60/day) Caregiver training

VA Aid and Attendance (A&A) and Housebound Benefits

Indiana VA Aid and Attendance/Housebound

Age 65+ or disabled veteran/spouse
General Indiana resident, wartime service, need for ADL help (A&A) or homebound.
Income Limits (2025) Net income < ~$1,984/month (veteran with dependent, A&A); pension offsets income.
Asset Limits ~$155,356 net worth limit
IN

High veteran demand statewide.

Benefits
Cash (~$1,433-$2,642/month veteran, ~$951-$1,318 spouse) for care costs (e.g., in-home, assisted living)

Frequently Asked Questions about Asbury Towers Retirement Community

Who is the Director of Nursing at Asbury Towers Retirement Community?

Audra Rose is the Director of Nursing at Asbury Towers Retirement Community.

Who is the owner of Asbury Towers Retirement Community?

The legal owner and operator of Asbury Towers Retirement Community is Pulaski Memorial Hospital.

Is Asbury Towers Retirement Community in a walkable area?

Asbury Towers Retirement Community has a walk score of 73. Very walkable. Most errands can be accomplished on foot, and many essentials are within a short walk.

What is the license number of Asbury Towers Retirement Community?

According to IN state health department records, Asbury Towers Retirement Community's license number is 25-001120-1.

When does Asbury Towers Retirement Community's license expire?

According to IN state health department records, Asbury Towers Retirement Community's license expires on June 30, 2026.

What is the occupancy rate at Asbury Towers Retirement Community?

Asbury Towers Retirement Community's occupancy is 58.5%.

Does Asbury Towers Retirement Community operate as a for-profit or non-profit?

Asbury Towers Retirement Community is registered as a non-profit in IN.

Guides for Better Senior Living

Care Cost Calculator: See Prices in Your Area

Nursing Home Data Explorer

Don’t Wait Too Long: 7 Red Flag Signs Your Parent Needs Assisted Living Now

The True Cost of Assisted Living in 2025 – And How Families Are Paying For It

Understanding Senior Living Costs: Pricing Models, Discounts & Financial Assistance