Ascension Living Nazarethville Place
Nursing Home, Adult Day Care, Assisted Living, Home Care, Independent Living, Memory Care & Nursing Care · Des Plaines, IL
CMS overall rating Info CMS (the Centers for Medicare & Medicaid Services) is the federal agency that rates nursing home quality. Its Overall Rating runs from 1 to 5 stars, combining health inspections, staffing, and quality measures, with inspections weighted most heavily.

Ascension Living Nazarethville Place

Nursing Home, Adult Day Care, Assisted Living, Home Care, Independent Living, Memory Care & Nursing Care · Des Plaines, IL
CMS overall rating Info CMS (the Centers for Medicare & Medicaid Services) is the federal agency that rates nursing home quality. Its Overall Rating runs from 1 to 5 stars, combining health inspections, staffing, and quality measures, with inspections weighted most heavily.
Calculator: See prices in your area
Ascension Living Nazarethville Place accepts Medicare and private pay.

Overview of Ascension Living Nazarethville Place

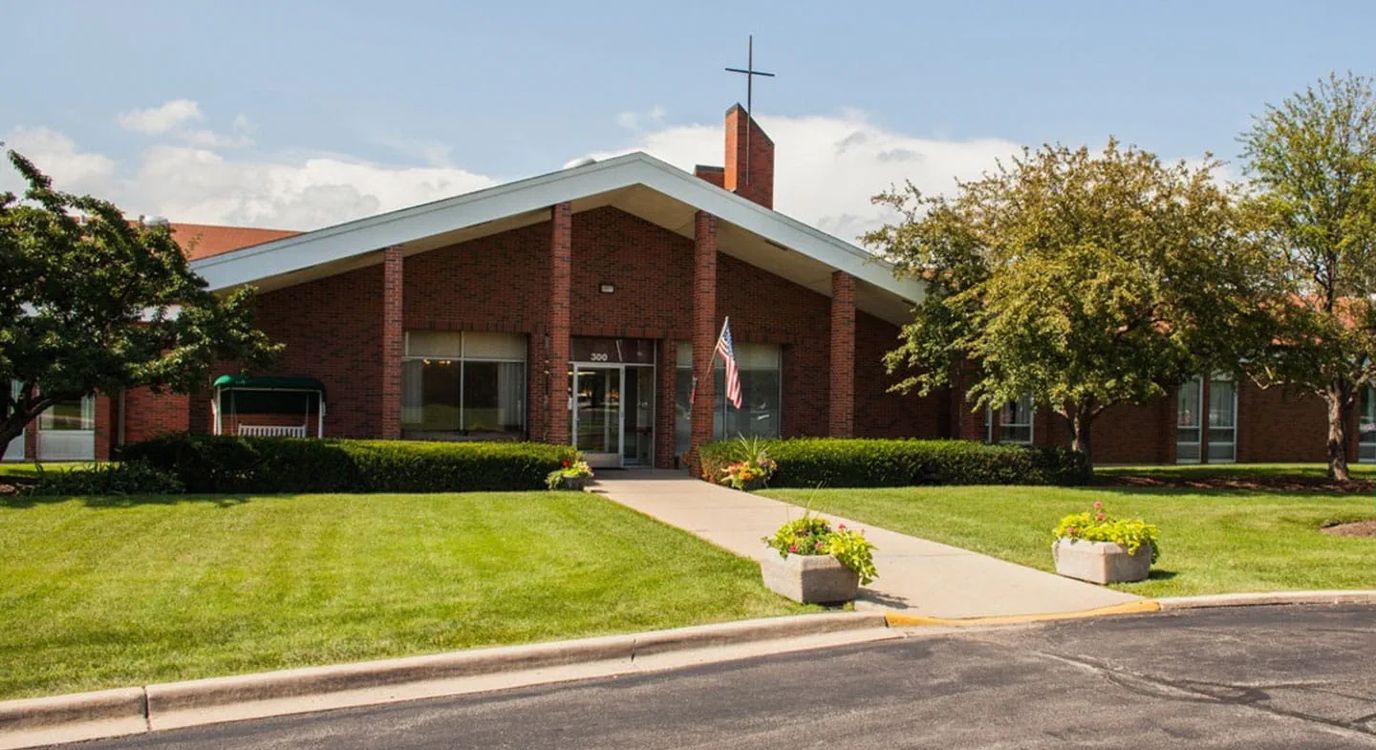
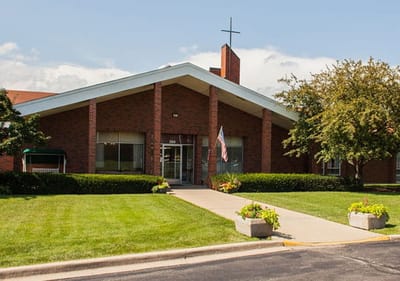
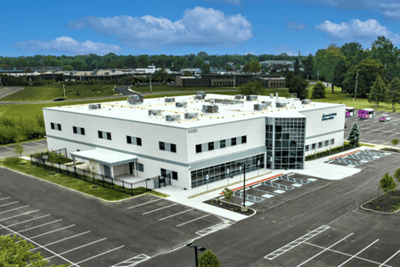
Ascension Living Nazarethville Place is a highly regarded nursing home in Des Plaines, IL, offering rehabilitation and skilled nursing. Dedicated to older adults’ comfort and healing, the community has a comfortable and welcoming environment. A maintenance-free lifestyle is also guaranteed, as 24-hour care, housekeeping, and nutritious meals are provided. Through personalized care plans, residents receive the utmost attention and care to recover and return to their routines with ease.

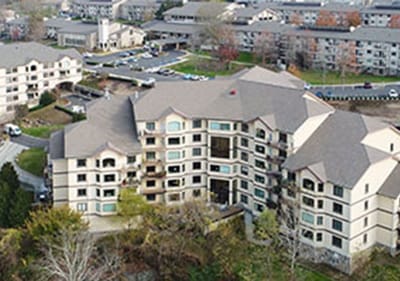
Fun gatherings, light exercises, and various games provide residents with more opportunities to interact with friends and have fun. Spacious outdoors and cozy lounges also ensure residents can rest and move around comfortably. Holy Family Medical Center and public transportation are also available in the area, providing residents with quick access to their necessities. This nursing home is a trusted choice for senior living in Illinois, especially with its high-quality services and well-maintained amenities.

Quality ratings

Measured by Centers for Medicare & Medicaid Services (CMS)

Overall rating Info The Overall CMS Rating combines results from health inspections, staffing levels and quality measures. Health inspections carry the most weight. Staffing and quality scores can increase or decrease the final rating based on performance compared to state and national standards.
▲ 98.4% Above IL avg. ▲ 98.4% Above IL avg.IL average: 2.5Click the badge to see the full State ranking.Click here to see the full State ranking.
Health Inspection Info Based on the results of the facility's three most recent standard inspections and any complaint investigations. CMS reviews the number, scope, and severity of deficiencies, with more recent findings weighted more heavily.
▲ 80.1% Above IL avg. ▲ 80.1% Above IL avg.IL average: 2.8Click the badge to see the full State ranking.Click here to see the full State ranking.
Staffing Info Measures average nursing staff hours per resident per day, including Registered Nurses (RNs) and total nursing staff. Ratings are adjusted based on the level of care residents require and are compared to state and national benchmarks.
▲ 87.2% Above IL avg. ▲ 87.2% Above IL avg.IL average: 2.1Click the badge to see the full State ranking.Click here to see the full State ranking.
Quality Measures Info Based on clinical and physical health indicators reported to CMS, such as hospital readmissions, falls, pressure ulcers, and improvements in mobility. These measures reflect how well residents' health needs are being managed.
▼ 29.0% Below IL avg. ▼ 29.0% Below IL avg.IL average: 2.8Click the badge to see the full State ranking.Click here to see the full State ranking.

Staffing hours breakdown

Info Daily nursing hours per resident by staff type, reported to CMS. Higher is generally better — compare this facility to state and national averages to see where staffing stands.

Hours per resident per day — compared to Illinois state averages

Total nursing care / resident Info This home is ranked 50th out of 172 homes in Illinois for nurse hours. Total adjusted nursing hours per resident per day, combining RN, LPN, and aide time. CMS adjusts this for case-mix so facilities can be fairly compared.
3h 39m per day
Rank #50 / 172Nurse hours — State benchmarkedThis home is ranked 50th out of 172 homes in Illinois. Shows adjusted nurse hours per resident per day benchmarked to the Illinois average, with a ranking across 172 Illinois facilities. More hours mean more direct care. The national average is about 3.5 hrs; below 3.0 is a red flag.Rankings are based only on facilities in Illinois that report data for that category. Facilities without available data are excluded from the ranking.Click the rank badge to see the full State ranking.Click here to see the full State ranking.
This facility Illinois avg (3h 6m per day)
vs Illinois avg
+18%

1 of 6 metrics below state avg

Standout metric Weekend RN is +105% above state avg
Staff typeHours / Day / Residentvs state avg
Registered Nurse (RN) Info RNs hold the highest nursing license and can assess residents, interpret test results, and direct care plans. More RN hours per day often signals stronger clinical oversight and faster response to health changes. 1h 24m per day ▲ 95% State avg: 43m per day · National avg: 41m per day
LPN / LVN Info Licensed Practical Nurses (LPNs) or Licensed Vocational Nurses (LVNs) deliver routine hands-on care — medication administration, wound dressing, and monitoring vital signs. They work under RN supervision and make up a large share of daily bedside care. 10m per day ▼ 74% State avg: 39m per day · National avg: 52m per day
Nurse Aide Info Certified Nurse Aides (CNAs) provide the most direct day-to-day assistance: bathing, dressing, feeding, and mobility. Nurse aide hours are typically the largest staffing category and directly affect residents' quality of life. 2h 30m per day ▲ 18% State avg: 2h 7m per day · National avg: 2h 20m per day
Weekend Total Nursing Info Combined nursing hours (RN + LPN + Nurse Aide) per resident per day on weekends. Staffing often drops on weekends — this figure reveals whether the facility maintains adequate coverage outside of weekday hours. 3h 44m per day ▲ 20% State avg: 3h 6m per day · National avg: 3h 27m per day
Physical Therapist Info Hours per resident per day provided by licensed Physical Therapists (PTs) or PT Assistants. PT services help residents recover mobility after injury or illness and are especially important for post-acute (short-stay) rehabilitation. 5m per day ▲ 65% State avg: 3m per day · National avg: 4m per day
Weekend RN Info Registered nurse hours specifically on weekends. Facilities sometimes reduce RN presence on Saturdays and Sundays — a low weekend RN figure compared to weekday hours can indicate reduced clinical oversight when most administrative staff are absent. 1h 8m per day ▲ 105% State avg: 33m per day · National avg: 29m per day

Capacity and availability

This home usually has availability

Higher occupancy than the Illinois average: 69.3%
Occupancy rate
78.4% Rank #87 / 204Occupancy rate — State benchmarkedThis home is ranked 87th out of 204 homes in Illinois. Shows this facility's occupancy rate versus the Illinois average, with its Statewide rank out of 204. Higher occupancy signals strong local demand and financial stability.Rankings are based only on facilities in Illinois that report data for that category. Facilities without available data are excluded from the ranking.Click the rank badge to see the full State ranking.Click here to see the full State ranking.
Avg. Length of Stay
335 days
Bed community size
68-bed community Rank #219 / 426Bed count — State benchmarkedThis home is ranked 219th out of 426 homes in Illinois. Shows this facility's certified or reported bed count compared to other Illinois facilities. Larger communities may offer more amenities, programs, and on-site services for residents and families.Rankings are based only on facilities in Illinois that report data for that category. Facilities without available data are excluded from the ranking.Click the rank badge to see the full State ranking.Click here to see the full State ranking.
A moderately sized community that may balance personal attention with shared amenities and social activities.
Walk Score
Walk Score: 28 / 100 Rank #509 / 648Walk Score — State benchmarkedThis home is ranked 509th out of 648 homes in Illinois. Shows how walkable this facility's neighborhood is compared to the average Walk Score across Illinois facilities. Higher scores benefit residents, families, and staff.Rankings are based only on facilities in Illinois that report data for that category. Facilities without available data are excluded from the ranking.Click the rank badge to see the full State ranking.Click here to see the full State ranking.
Somewhat walkable. A few nearby services may be reachable on foot, but most trips require transportation.

About this community

Awards

U.S. News and World Report Best Nursing Homes

License Details

CertificationsMedicare-certified
AccreditationsLeadingAge

Safety & Compliance

Emergency SystemsYes
Safety Features24/7 emergency alert system with fall prevention technology

Therapy & Rehabilitation

3 services
Rehabilitation Services
Respite Care
Short-Term Rehab

Staffing & Medical

2 services
Licensed Nurses/CNAs
24-Hour Staffing

Additional Services

1 service
Home Care

Additional Policies & Features

Pets Allowed
Linen ServiceYes

Amenities & Lifestyle

Fitness Center
Swimming Pool
Library
Salon
Chapel
Restaurant
Craft Room
Transportation
Housekeeping
Linen Service
Wellness Programfall risk evaluation, muscle strengthening program, muscle stretching program
Specific ProgramsLiving choices, Memory Support, Retreat Stays
Religious Services

Dining & Nutrition

Food DescriptionThe dining program features nutritious meals made with fresh ingredients, including vegetables, fruits, and whole grains.

Contact Ascension Living Nazarethville Place

Staffing Data

Reporting period: October 1 – December 31, 2025 (Q4 2025). Source: CMS Payroll-Based Journal report.

Total staff 115
Employees 56
Contractors 59
Staff to resident ratio 1.77 : 1
0% compared with Illinois average
Illinois average ratio: 1.80 : 1 Illinois average ratio: 1.80 : 1See full Illinois ranking
Avg staff/day 35
Average shift 7.6 hours
0% compared with Illinois average
Illinois average: 7.6 hours Illinois average shift: 7.6 hoursSee full Illinois ranking
Total staff hours (quarter) 24,362

Nursing staff breakdown

Q4 2025 · Oct 1 – Dec 31 More info This data comes from the CMS Payroll-Based Journal report covering October 1 – December 31, 2025.
Registered Nurse

Manages medical care and health needs.

RN Staff Info 25 total: 15 full-time employees and 10 contractors. 25
Average shift length Info Average shift length. Calculated as total hours divided by days worked and average staff per day. 7.8 hours
Licensed Practical Nurse

Assists with medical care and medications.

LPN Staff Info 9 total: 2 full-time employees and 7 contractors. 9
Average shift length Info Average shift length. Calculated as total hours divided by days worked and average staff per day. 8.5 hours
Certified Nursing Assistant

Helps with daily care and mobility.

CNA Staff Info 49 total: 28 full-time employees and 21 contractors. 49
Average shift length Info Average shift length. Calculated as total hours divided by days worked and average staff per day. 8 hours

Contractor staffing

Q4 2025 · Oct 1 – Dec 31 More info This data comes from the CMS Payroll-Based Journal report covering October 1 – December 31, 2025.

Total hours from contractors

12.8%

3,107 contractor hours this quarter

Certified Nursing Assistant: 21 Registered Nurse: 10 Licensed Practical Nurse: 7 Respiratory Therapy Technician: 5 Qualified Social Worker: 5 Physical Therapy Aide: 3 Physical Therapy Assistant: 3 Occupational Therapy Aide: 3 Clinical Nurse Specialist: 1 Speech Language Pathologist: 1

Staff by category

Q4 2025 · Oct 1 – Dec 31 More info This data comes from the CMS Payroll-Based Journal report covering October 1 – December 31, 2025.
Certified Nursing Assistant28214912,42492100%8
Registered Nurse1510255,77892100%7.8
Other Dietary Services Staff6061,79692100%5.9
Licensed Practical Nurse2798357076%8.5
Clinical Nurse Specialist1128226267%8.1
Administrator1014806065%8
Dental Services Staff1014445661%7.9
Physical Therapy Aide0334416571%6.7
Respiratory Therapy Technician0554176773%6
Nurse Practitioner2023604549%8
Qualified Social Worker0553365762%5.9
Occupational Therapy Aide0331622729%5.4
Physical Therapy Assistant033593134%1.9
Speech Language Pathologist011933%3
49 Certified Nursing Assistant
% of Days 100%
25 Registered Nurse
% of Days 100%
6 Other Dietary Services Staff
% of Days 100%
9 Licensed Practical Nurse
% of Days 76%
2 Clinical Nurse Specialist
% of Days 67%
1 Administrator
% of Days 65%
1 Dental Services Staff
% of Days 61%
3 Physical Therapy Aide
% of Days 71%
5 Respiratory Therapy Technician
% of Days 73%
2 Nurse Practitioner
% of Days 49%
5 Qualified Social Worker
% of Days 62%
3 Occupational Therapy Aide
% of Days 29%
3 Physical Therapy Assistant
% of Days 34%
1 Speech Language Pathologist
% of Days 3%

Penalties and fines

Federal penalties imposed by CMS for regulatory violations, including civil money penalties (fines) and denials of payment for new Medicare/Medicaid admissions.

Source: CMS Penalties Database

No penalties in the past 3 years

No civil money penalties or payment denials were reported in the last 3 years.

Quality of care over time

These measures show how residents usually do over time at this home, based on health outcomes and preventive care.

High-risk clinical events score Info A composite score based on pressure ulcers, falls with injury, weight loss, walking ability decline, and activities of daily living decline. 7.6
22% better than Illinois average

Illinois average: 9.7

Functional decline score Info A composite score based on activities of daily living decline, walking ability decline, and incontinence. 12.0
36% better than Illinois average

Illinois average: 18.6

Long-stay resident measures
Need for Help with Daily Activities Increased Info Percent of long-stay residents whose need for help with daily activities has increased 16.5%
7% worse than Illinois average

Illinois average: 15.5%

Walking Ability Worsened Info Percent of long-stay residents whose ability to move independently worsened 11.7%
37% better than Illinois average

Illinois average: 18.4%

Low Risk Residents with Bowel/Bladder Incontinence Info Percent of low risk long-stay residents who lose control of their bowels or bladder 7.7%
64% better than Illinois average

Illinois average: 21.6%

Falls with Major Injury Info Percent of long-stay residents experiencing one or more falls with major injury 3.8%
12% worse than Illinois average

Illinois average: 3.4%

High Risk Residents with Pressure Ulcers Info Percent of long-stay high risk residents with pressure ulcers 4.0%
25% better than Illinois average

Illinois average: 5.3%

Urinary Tract Infection Info Percent of long-stay residents with a urinary tract infection 0.9%
52% better than Illinois average

Illinois average: 1.8%

Lost Too Much Weight Info Percent of long-stay residents who lose too much weight 2.0%
70% better than Illinois average

Illinois average: 6.5%

Depressive Symptoms Info Percent of long-stay residents who have depressive symptoms 49.3%
In line with Illinois average

Illinois average: 48.1%

Antipsychotic Use Info Percent of long-stay residents who received an antipsychotic medication 19.3%
5% better than Illinois average

Illinois average: 20.2%

Pneumococcal Vaccine Info Percent of long-stay residents assessed and appropriately given the pneumococcal vaccine 61.9%
31% worse than Illinois average

Illinois average: 89.2%

Influenza Vaccine Info Percent of long-stay residents assessed and appropriately given the seasonal influenza vaccine 95.2%
In line with Illinois average

Illinois average: 91.6%

Short-stay resident measures
Pneumococcal Vaccine Info Percent of short-stay residents assessed and appropriately given the pneumococcal vaccine 9.2%
87% worse than Illinois average

Illinois average: 68.3%

Antipsychotic medication increase Info Percent of short-stay residents who newly received an antipsychotic medication 0.0%
100% better than Illinois average

Illinois average: 2.3%

Influenza Vaccine Info Percent of short-stay residents assessed and appropriately given the seasonal influenza vaccine 12.5%
80% worse than Illinois average

Illinois average: 63.0%

Breakdown by payment type

Medicare

33% of new residents, usually for short-term rehab.

Typical stay 1 - 2 months

Private pay

67% of new residents, often for short stays.

Typical stay 2 years

Facility Characteristics

Source: CMS Long-Term Care Facility Characteristics (Data as of Jan 2026)

Total residents 65
Medicare
2
3.1% of residents
Medicaid
49
75.4% of residents
Private pay or other
14
21.5% of residents
Programs & Services
Residents Group

Residents meet regularly to discuss policies, care quality, and activities

Active Resident Council

Organized group of residents that meets regularly to discuss facility policies, quality of life, and activities.

Finances and operations

Based on CMS SNF Cost Report for fiscal year ending in 06/2024.

Nonprofit
Church Related
Net patient revenue Info Net patient revenue — what the home actually collects for resident care, after contractual allowances, bad debt and discounts are subtracted from its gross charges (CMS cost report, Worksheet G-3). It covers resident care only; money the home earns from other sources is shown separately as "Other income."
$7.6M
Net patient income Info Net patient income: net patient revenue minus the home's total operating expenses. A positive figure means it earns more from resident care than it spends to deliver it; a negative figure means the opposite. It excludes non-operating "other income."
-$1.8M
Nonprofit Church Related
Net patient revenue Info Net patient revenue — what the home actually collects for resident care, after contractual allowances, bad debt and discounts are subtracted from its gross charges (CMS cost report, Worksheet G-3). It covers resident care only; money the home earns from other sources is shown separately as "Other income."
$7.6M Rank #130 / 171Revenue — State benchmarkedThis home is ranked 130th out of 171 homes in Illinois. Shows this facility's annual revenue compared to the Illinois average. Higher revenue generally means more resources for staffing and capital — read alongside Payroll %.Rankings are based only on facilities in Illinois that report data for that category. Facilities without available data are excluded from the ranking.Click the rank badge to see the full State ranking.Click here to see the full State ranking.
Net patient income Info Net patient income: net patient revenue minus the home's total operating expenses. A positive figure means it earns more from resident care than it spends to deliver it; a negative figure means the opposite. It excludes non-operating "other income."
-$1.8M
Other income Info Money the home earns outside of resident care — such as investments, grants, rentals and other non-operating sources (CMS cost report, Worksheet G-3). It is tracked separately from net patient revenue: it is not part of that figure, and it is not included in net patient income.
$69.3K
Payroll costs Info Staff salaries plus wage-related costs — benefits such as payroll taxes, health insurance and retirement — from the home's own accounting records (CMS cost report, Worksheet A). Contract or agency labor is counted separately, under other operating costs. Rank #119 / 171Payroll — State benchmarkedThis home is ranked 119th out of 171 homes in Illinois. Shows total annual staff payroll benchmarked to the Illinois average. Higher payroll investment relative to peers often signals better staffing and less reliance on cheaper contract labor.Rankings are based only on facilities in Illinois that report data for that category. Facilities without available data are excluded from the ranking.Click the rank badge to see the full State ranking.Click here to see the full State ranking.
$4.7M 61.5% of net patient revenue Info Payroll as a share of revenue: staff salaries and wage-related benefits divided by net patient revenue. A higher figure means more of each revenue dollar goes to staff pay. Rank #55 / 171Payroll % — State benchmarkedThis home is ranked 55th out of 171 homes in Illinois. Shows payroll as a percentage of revenue versus the Illinois average. Well-run Illinois facilities typically land around 54–67% — the top third Statewide. Below 25% may signal understaffing or heavy agency use — read with Staffing ratings.Rankings are based only on facilities in Illinois that report data for that category. Facilities without available data are excluded from the ranking.Click the rank badge to see the full State ranking.Click here to see the full State ranking.
Other operating costs Info Everything it costs to run the home apart from payroll — food, utilities, supplies, maintenance, contract labor and administration. Calculated as total operating expense minus payroll (staff salaries and wage-related benefits).
$4.7M
Total costs Info The home's total operating expense for the year — all the costs of running it, salaries included (CMS cost report, Worksheet G-3).
$9.4M

What does this home offer?

Housing options icon

Housing Options: Private Rooms

Building type icon
Building type icon

Building Type: Single-story

On-site medical care and health services icon

On-site Medical Care and Health Services

Rehabilitative support icon

Rehabilitative Support

Beauty services icon

Beauty Services

Housekeeping icon
Housekeeping icon

Housekeeping Services

Social and recreational activities icon

Social and Recreational Activities

Who this home usually serves

TYPE OF STAY

Primarily short stays

Residents typically stay for brief periods, with frequent admissions and discharges throughout the year.

Most new residents arrive under private pay (67% of admissions), and a typical private pay stay runs around 2 years.

Admissions
52 total

Coverage residents most often arrive under.

Medicare 33%
Private pay 67%
Discharges
71 total

Coverage residents most often leave under.

Medicare 15%
Private pay 85%

Living Spaces & Floor Plans for Ascension Living Nazarethville Place

Floor plan
Floor Plan
Floor plan
Floor Plan

Places of interest near Ascension Living Nazarethville Place

Address 1.3 miles from city center Info Estimated distance in miles from Des Plaines's city center to Ascension Living Nazarethville Place's address, calculated via Google Maps.

Calculate Travel Distance to Ascension Living Nazarethville Place

Add your location

Address

Compare Assisted Living around Mount Prospect

The information below is reported by the Illinois Department of Public Health, Office of Health Care Regulation.

Ascension Living Nazarethville Place
AL
ADC
HC
IL
MC
NC
NH
Des Plaines -
68
Facility 68
IL AVG 86
Rank #219 / 426
-
28
Facility 28
IL AVG 51
Rank #509 / 648
Private Rooms
Citadel of Northbrook
AL
HC
MC
NH
RC
Northbrook -
158
Facility 158
IL AVG 86
Rank #44 / 426
-
56
Facility 56
IL AVG 51
Rank #272 / 648
Private/Semi-Private Rooms
Alden Des Plaines Rehabilitation & Health Care Center
AL
IL
MC
NH
Des Plaines -
110
Facility 110
IL AVG 86
Rank #101 / 426
-
42
Facility 42
IL AVG 51
Rank #403 / 648
Private/Semi-Private Rooms

Financial Assistance for
Assisted Living in Illinois

Ascension Living Nazarethville Place is located in Des Plaines, Illinois.
Here are the financial assistance programs available to residents in Illinois.

Get Financial aid guidance

Community Care Program

Illinois CCP

Age 60+
General Illinois resident, at risk of nursing home placement.
Income Limits (2025) ~$1,215/month individual
Asset Limits $17,500 individual, excludes home, car
IL

High demand in urban areas; waitlists possible.

Benefits
In-home care (3-5 hours/day) Adult day services ($65/day) Emergency home response systems ($30/month)

Illinois Respite Program

IL Respite (via NFCSP)

Age Caregiver of someone 60+ (or with dementia)
General Illinois resident.
Income Limits No strict limit; prioritizes low-income.
Asset Limits Not applicable.
IL

Limited slots; urban/rural balance.

Benefits
In-home respite (4-6 hours/day) Adult day care (~$65/day) Short-term facility care (up to 5 days)

Supportive Living Program (SLP)

Illinois Medicaid Supportive Living Program

Age 65+ or 22-64 with disability
General Illinois resident, Medicaid-eligible, needs moderate assistance (not nursing home-level).
Income Limits (2025) ~$2,829/month (300% FBR, individual); QIT allowed.
Asset Limits $2,000 (individual), $3,000 (couple) (excludes home, car).
IL

~200 SLP sites statewide; room/board not covered.

Benefits
Personal care (5-7 hours/day, e.g., bathing, mobility) Meals Housekeeping Medication management Respite (~240 hours/year)

Persons Who Are Elderly Waiver

Illinois Medicaid Elderly Waiver

Age 65+
General Illinois resident, Medicaid-eligible, nursing home-level care need.
Income Limits (2025) ~$2,829/month 300% FBR, individual
Asset Limits $2,000 (individual), $3,000 (couple).
IL

Part of HealthChoice Illinois; consumer-directed options available.

Benefits
Personal care (5-7 hours/day, e.g., dressing, eating) Homemaker Adult day care (~$60/day) Respite (240 hours/year) Home mods ($1,000 avg.)

Medicare Savings Program (MSP)

Illinois Medicare Savings Program

Age 65+ or disabled
General Illinois resident, Medicare Part A/B.
Income Limits (2025) ~$2,510/month (QMB), ~$3,380/month (SLMB), ~$3,598/month (QI)—individual.
Asset Limits $9,430 (individual), $14,130 (couple).
IL

Three tiers; no waitlist.

Benefits
Covers Part B premiums ($174.70/month) Deductibles ($240/year) Copays (~20%)

Optional State Supplementation (OSS)

Illinois Optional State Supplementation

Age 65+ or disabled
General Illinois resident, in approved facility, SSI recipient or low-income.
Income Limits (2025) ~$1,004/month including SSI
Asset Limits $2,000 (individual), $3,000 (couple).
IL

~$50-$500/month based on facility type.

Benefits
Cash (~$50-$500/month) for room/board in personal care homes or SLFs

VA Aid and Attendance (A&A) and Housebound Benefits

Illinois VA Aid and Attendance/Housebound

Age 65+ or disabled veteran/spouse
General Illinois resident, wartime service, need for ADL help (A&A) or homebound.
Income Limits (2025) Net income < ~$1,984/month (veteran with dependent, A&A); pension offsets income.
Asset Limits ~$155,356 net worth limit
IL

High veteran demand in urban/rural areas.

Benefits
Cash (~$1,433-$2,642/month veteran, ~$951-$1,318 spouse) for care costs (e.g., in-home, assisted living)

Frequently Asked Questions about Ascension Living Nazarethville Place

Is Ascension Living Nazarethville Place in a walkable area?

Ascension Living Nazarethville Place has a walk score of 28. Somewhat walkable. A few nearby services may be reachable on foot, but most trips require transportation.

What is the occupancy rate at Ascension Living Nazarethville Place?

Ascension Living Nazarethville Place's occupancy is 78.4%.

Does Ascension Living Nazarethville Place have different floorplan options?

Yes — see the floorplan options available at Ascension Living Nazarethville Place on this page.

Does Ascension Living Nazarethville Place operate as a for-profit or non-profit?

Ascension Living Nazarethville Place is registered as a non-profit.

Are there photos of Ascension Living Nazarethville Place?

Yes — there are 15 photos of Ascension Living Nazarethville Place in the photo gallery on this page.

What is the address of Ascension Living Nazarethville Place?

Ascension Living Nazarethville Place is located at 300 River Rd, Des Plaines, IL 60016.

What is the phone number of Ascension Living Nazarethville Place?

(847) 750-3094 will put you in contact with the team at Ascension Living Nazarethville Place.

Guides for Better Senior Living

Care Cost Calculator: See Prices in Your Area

Nursing Home Data Explorer

Don’t Wait Too Long: 7 Red Flag Signs Your Parent Needs Assisted Living Now

The True Cost of Assisted Living in 2025 – And How Families Are Paying For It

Understanding Senior Living Costs: Pricing Models, Discounts & Financial Assistance